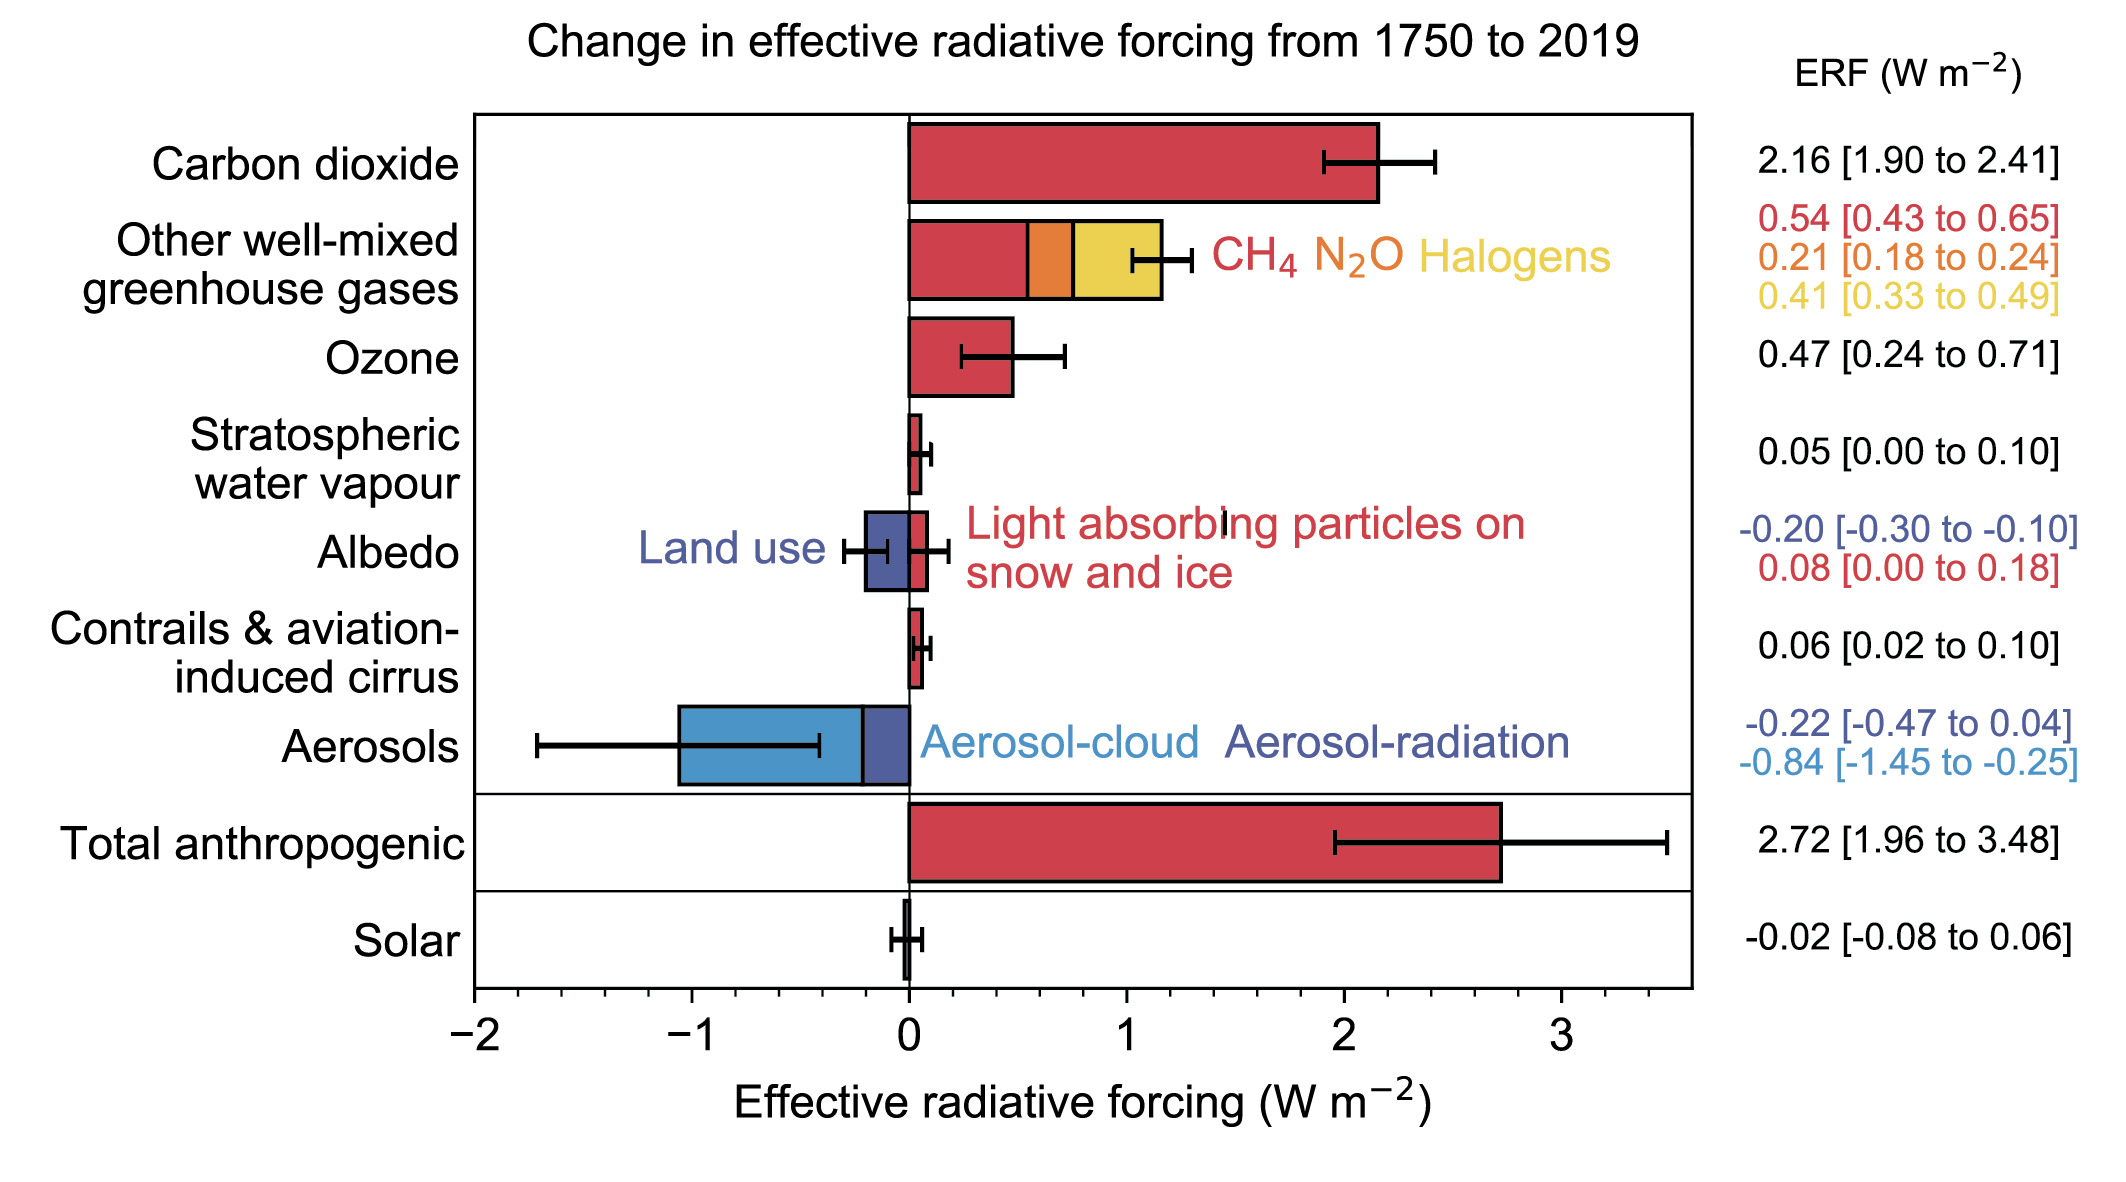
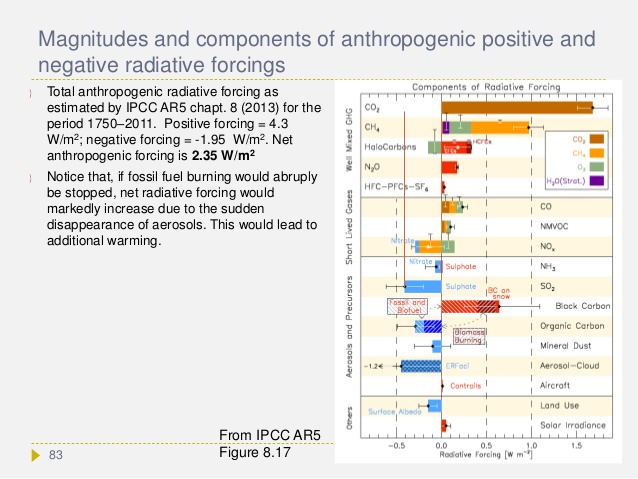
By far, the strongest greenhouse gas is water vapor, not because it is very strong of itself, but it absorbs nearly all outgoing energy in the infrared spectrum except in the so called atmospheric window, where it only partially absorbs. Yet water vapor is missing from the IPCC AR6 chart seen here:
IPCC has consistently treated the effect of greenhouse gasses as additive, but it is impossible to absorb more than 100% of all emitted energy for a given wavelength. This leads to an overestimation of absorption when 2 or more gasses are present. For example, if CO2 absorbs 90% of available energy at 13 μm and water vapor another 50%, the sum is 90% + (1 -0.9} * 0.5 = 95%, not 140%
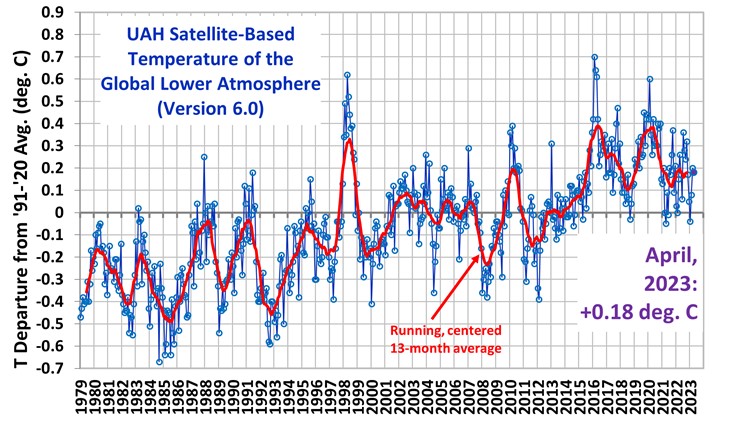
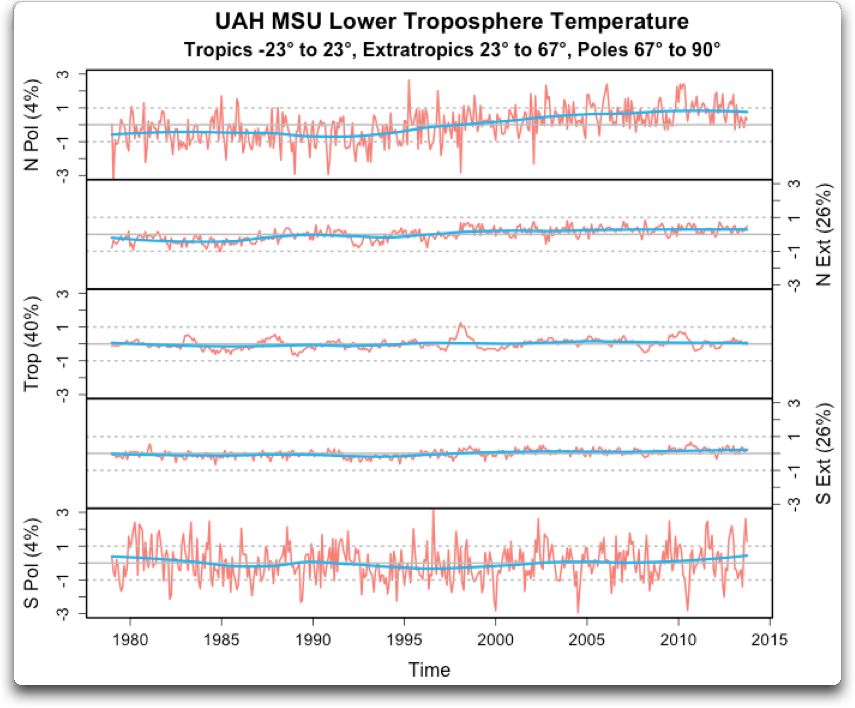
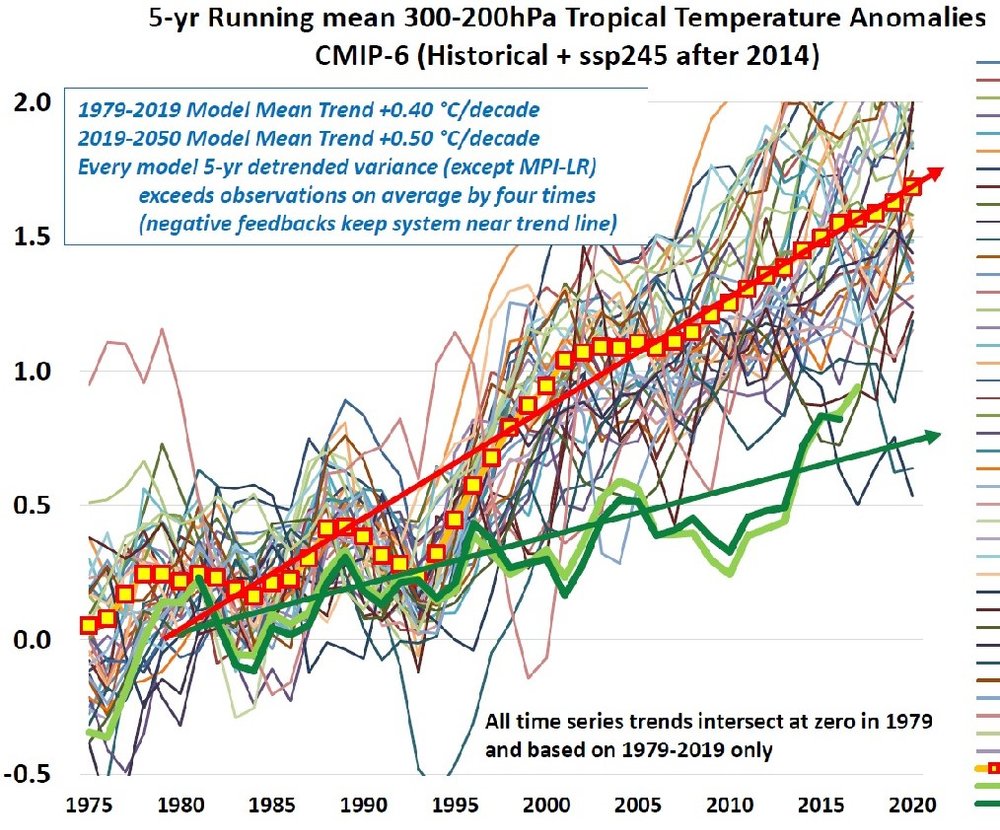
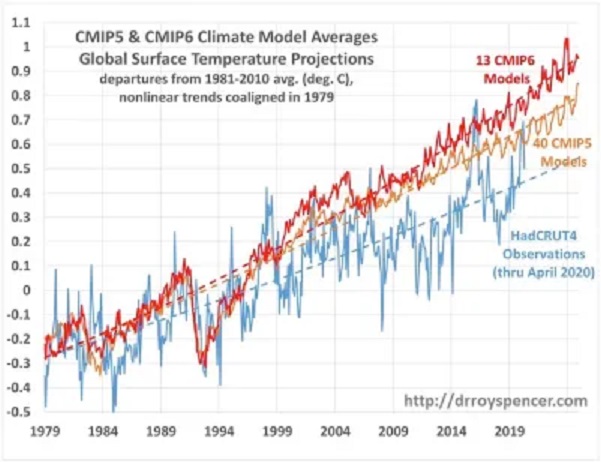
This will change the relative importance of greenhouse gasses drastically so it must be tested against reality. We now have a good global satellite temperature record from 1980 to 2022 or 43 years:
During this time the temperature rise was 0.5 C, which translates to 2.375 W/m2 ERF
Water vapor.
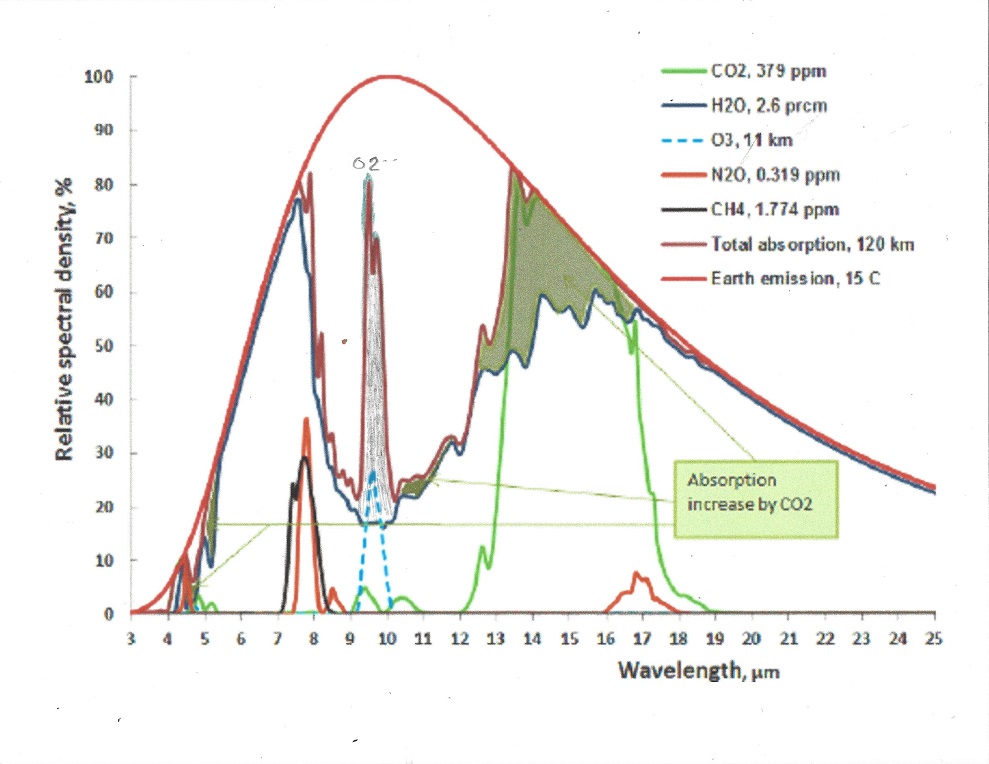
This is a good chart to see the relative importance of all major greenhouse gasses:
It is to be noted that water vapor also absorbs the incoming solar radiation in certain wavelengths, but solar influx is assumed to be constant.
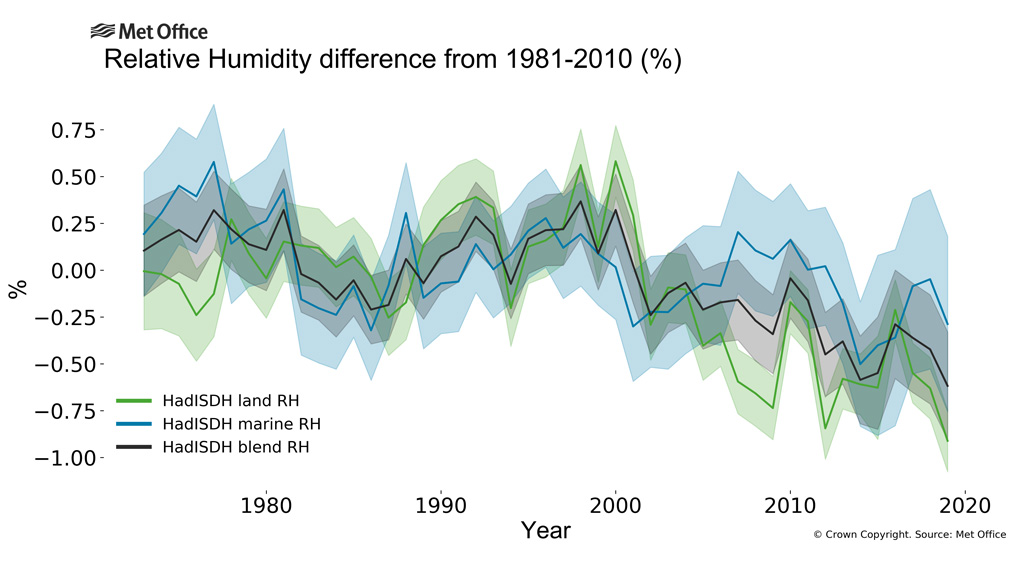
When average temperature rises 0.5 C, the possible absorption rises by 2.375 W/m2 minus the energy that escapes through the atmospheric window.Water vapor through saturation: is responsible for all of this increase except where other gasses also absorb in the atmospheric window, and in the atmospheric window the absorption must be proportionally shared, subject to the 100% absorption limitation.The atmospheric window is about 26% of all the emitted radiation so net water absorption is 0.74 * 2.375 = 1.6 W.m2 or 0.34 C. However, the relative humidity is also decreasing, see picture:
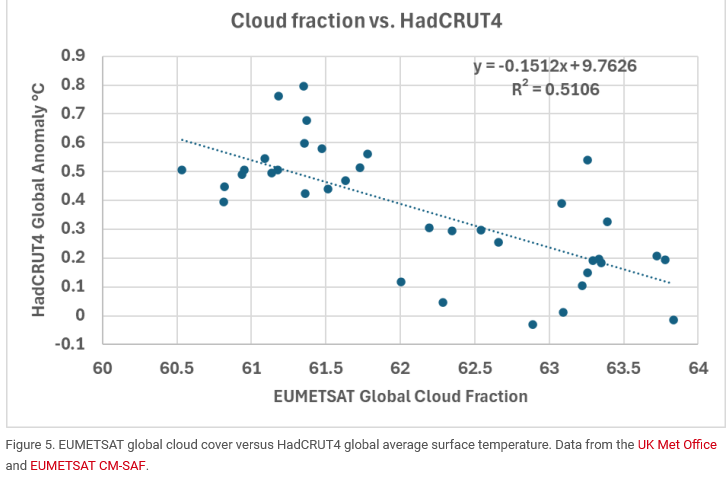
Between 1980 and 2022 the net humidity increase is 3.6% minus 0.75% relative humidity for a net increase of 3.54%. This increase only matters in the atmospheric window which is on average 25% saturated, so the total increase from water vapor increase is 0.26 * 2.375 * 0.25 * 0.9925 = 0.15 W/m2 or 0.03 C., to be added to the total before increase in humidity.This means that for a 0.5C temperature increase between 1980 and 2022 the total sensitivity to water vapor is 1.75 W/m2 or 0.37 C. A confirming picture of the total cloud cover shows the , but temperature sensitivity to the decline in cloud cover between 1980 and 2015
This is of course a very crude method, since it incorporates all temperature rises from all sources, which is 0,5C degrees, from which should be deducted the 0.08C rise from all. This is of course a very cruse assessment of the influence of clouds vary greatly between low clouds, middle clouds and high clouds; as well as when they occur, day or night, and even what time of day they appear. Because of this complexity IPCC has consistently failed to give clouds their full respect. The clouds are the main regulator of temperature on earth!
Carbon dioxide
CO2 is the strongest greenhouse gas after water vapor. The only wavelength band that is meaningful is 13 to 17.4 μm and absorption occurs from both CO2 and water vapor. Since they exist together, the effect of each of them must be proportionally allocated, or the sum of them added would exceed 100%
Between 1980 and 2022 the CO2 levels rose from 335 ppm to 415 ppm or 24% increase. The temperature increase 0.5 C. The net temperature increase or ERF in the 13 to 17.4 μm band is 0.035C or +0.17 W/m2 for the water vapor and 0.04C or +0.19 W/m2 for the CO2. To see how the calculation was made, go to Appendix 1.
Methane.
Methane gas is created from a variety of sources, both man made and natural. See pie chart
The good thing about methane is that its lifetime in the atmosphere is only 10 to 15 years, and the real contribution to climate change is only 1/5th of what is commonly advertised, since iits absorption bands occur together with partly saturated absorption from water vapor. See appendix 2.
In 1980 the CH4 concentration was 1.6 ppm and will be 2.0 ppm in 2022 which results in an increase of the greenhouse effect of 0.035 C or 0.17 W/m2 ERF from rising levels of Methane since 1980.
N2O.
Atmospheric N2Olevels averaged 336 ppb (parts per billion) during 2022, about and was 301 ppb in 1980. It is a 300 times stronger greenhouse gas than CO2 by itself, because its absorption is not saturated in the atmosphere. When water vapor is dominant it is diminished by over 70% since it is at the edges of the Atmospheric window. For calculations see Appendix 3.
In 1980 the N2O concentration was 0.3 ppm which results in an increase of the greenhouse effect of 0.0065 C or 0.031 W/m2 ERF from rising levels of N2O since 1980 .
Ozone.
Ozone occurs as stratospheric O3 which is good. It protects us from uv radiation. O3 in the troposphere is considered harmful if it is over 0.08% It is normally around 0,01% in the troposphere. For calculations and figures, see appendix 4.
When the earth’s temperature rises by 0.5C, from 1980 to 2022, the amount of tropospheric O3 probably rises by 2% (Lacking good data I am guessing wildly, in urban areas it may be much more, but this is global average). This comes to 0.0034C temperature increase or 0.016 W/m2 ERF from O3, from 1980 to 2022.
CFC gasses.
CFC’s are cheap and efficient gasses to use in refrigerators and air conditioners.Their use rose rapidly until it was discovered they destroyed the protective ozone layer in the stratosphere, so its use, got banned in 1994, later diminished including its use in inhalers. CFCs has since diminished slowly and is maybe already below the levels in 1980. See also Appendix 5.
HFC gasses.
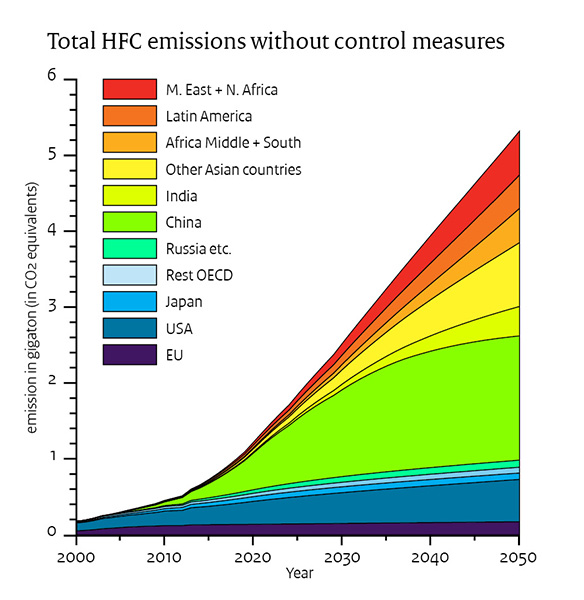
HFCs replaced CFCs and are rapidly growing in use, and the compressor seals still leak. For pictures on why they are a growing concern for the future, see Appendix 6.
The temperature increase from 1980 to 2022 was 0.0015 C or 0.007 W/m2 ERF.
Summary of all greenhouse effect causes for temperature rise from 1980 until 2022:
Effect from water vapor increase: 0.37 C or 1.75 W/m2; 80.9% of total
Effect from rising CO2: 0.04C or 0.19 W/m2; 8.78% of total
Effect from rising Methane: 0.036 C or 0.17 W/m2, 7.86% of total
Effect from rising N2O: 0.0065 C or 0.031 W/m2 1.4% of total
Effect from rising Ozone: 0.0034C or 0.016 W/m2 0.7% of total
Effect from rising HFCs : 0.0015 C or 0.007 W/m2 0.3% of total
TOTAL TEMPERATURE CHANGE 1980 to 2022: 0.4544C or 2.164 W/m2
Conclusion
CO2 amounts to less than 10% if the temperature increase since 1980, and so does Methane. The green new deal is a pipe dream that does not solve the climate problem, but will make it worse.the price of lithium carbonate used in batteries has risen sixteen-fold between 2020 and late 2022. Since then, it has dropped to one third of its peak price. China has corned the market in Lithium for now. There is not enough Lithium to be economically and ecologically justifiable to mine to meet demand in the future. Since solar and wind power are intermittent supplier of electricity they can never be used as base supplier of energy. Other solutions must be offered
Actions to be taken
What congress is doing to solve the problem.
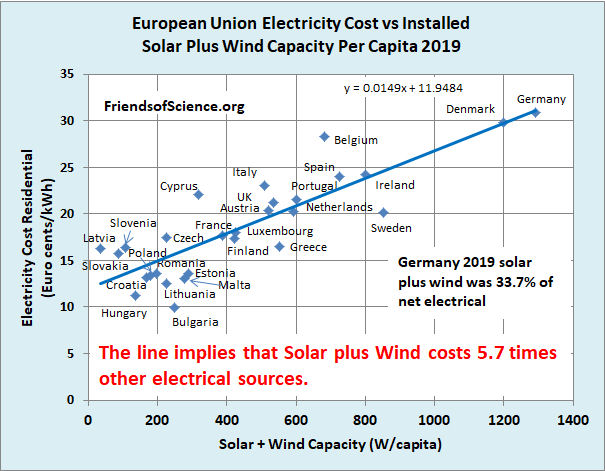
Congress has passed the anti-inflation bill that included over 300 billion to fight climate change, and it included more solar panels and wind turbine motors to be imported from China. The experience from Europe is that electricity from solar panels and windmills is 5.7 times as expensive as conventional power generation.
This analysis was done for 2019, before COVID. The situation is worse now, with electricity rares up to 80 c/kWh, topping $1 /kWh last winter in some countries before subsides.
Even at the current increased European Gas prices, the estimated excess expenditures on Weather-Dependent “Renewables” in Europe is still very large: $0.5 trillion in capital expenditures and $1.2 trillion excess expenditures in the long-term.
These simple calculations show that any claim that Wind and Solar power are now cost competitive with conventional fossil fuel (Gas-fired) generation are patently false. The figures give an outline of the financial achievements of Green activists in stopping fracking for gas in Europe, close on to $1.2 trillion of excess costs.
It would be better not to import any solar panels and wind power generators from China and let them pay for the extra cost rather than building more coal burning plants. After all they were planning to build over a thousand new plants between now and 2030, all legal under the Paris accord. This would benefit the world climate much more, since Chinese coal plants are far more polluting, since China has far less stringent environmental regulations than U.S.
U.S. uses 13.5% of the world’s coal, and eliminating U.S. CO2 emissions would in time reduce the world temperature by 0.023C, providing no other country, such as China and India would increase their use of Coal, which they are, to the total of 1300 new coal plants between now and 2030. This would raise global temperature by more than 0.06 C.
What congress should do instead.
a. What congress should do immediately.
Immediately stop downblending U 233 and pass The Thorium Energy security act SB 4242a. See more here.
2. Remove Thorium from the list of nuclear source material. The half-life of Thorium232 is 14 billion years, so its radioactivity is barely above background noise. More importantly, while Thorium is fertile, it is not fissile and should therefore not be included in the list. This would make it far easier to mine rare earth metals, as long as the ore consists of less than 0.05% Uranium, but any amount of Thorium is allowed without classifying the ore “Source material”.
3. Separate nuclear power into 3 categories. a. conventional nuclear power. b. Thorium breeder reactors that make more U233 than it consumes.c. Thorium reactors that reduce nuclear waste, and d. Plutonium and other trans uranium depletion reactors.
4. Stop buying solar panels from China. Stop buying wind turbine generators from China. Let them install those in China and pay 5 times as much for their electricity.
5. Immediately form a commission led by competent people, not politicians; to decide how to best expand the electric grid and to best harden it against electro-magnetic pulses, whether solar or nuclear and to safeguard it against sabotage.
6. Remove all subsidies on electric cars, solar panels and wind generators, but continue to encourage energy conservation.
7. Encourage research and development of Thorium fueled reactors, especially liquid salt reactors by drastically simplifying and speeding up the approval process. President Trump issued an executive order in the last month of his presidency EO 13972 specifying that the United States must sustain its ability to meet the energy requirements for its national defense and space exploration initiatives. The ability to use small modular reactors will help maintain and advance United States dominance and strategic leadership across the space and terrestrial domains. This EO should be expanded to include civilian small modular reactors, including Liquid salt Thorium reactors less than 200 MW, which are the only valid reactors for space exploration.
Appendix 1, CO2
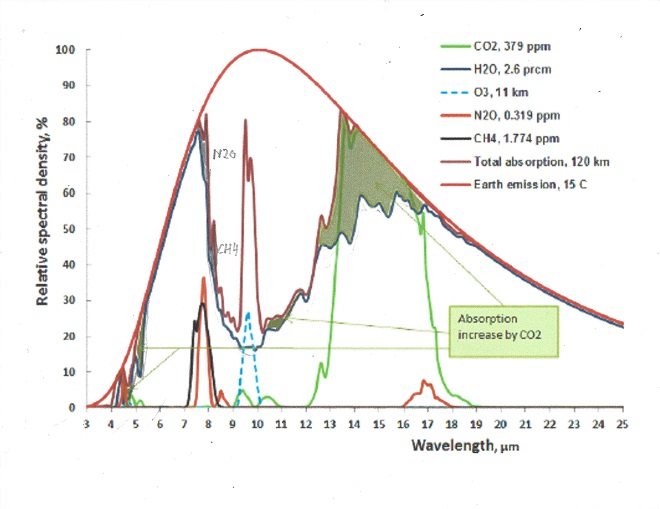
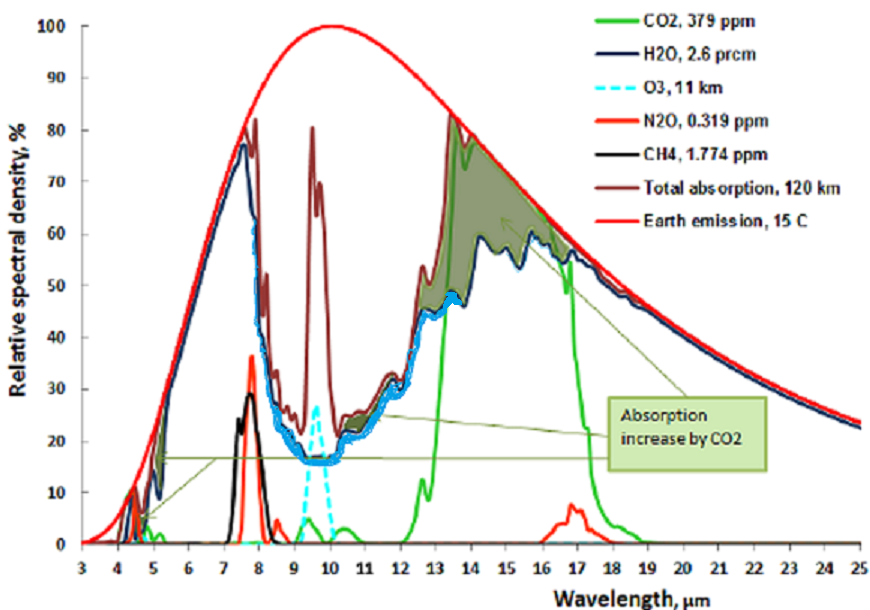
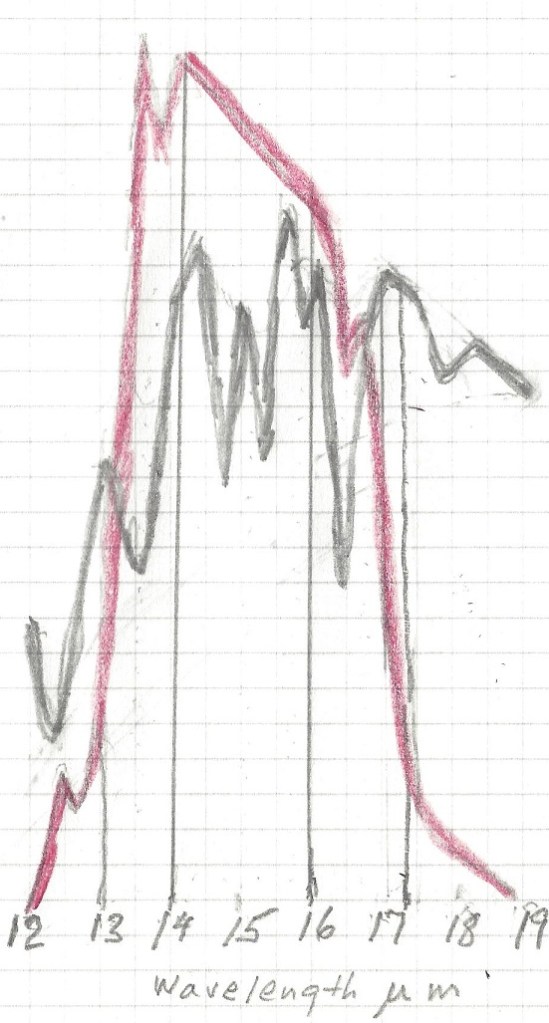
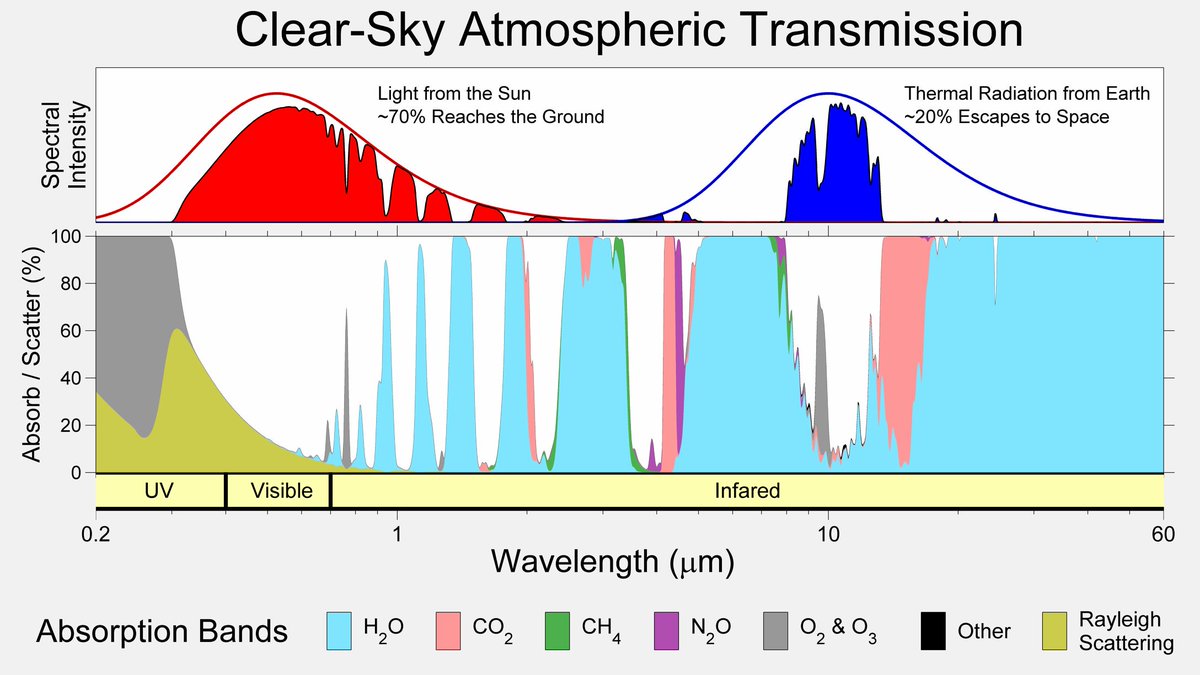
The following chart shows both CO2 and H2O are absorbing greenhouse gases, with H20 being the stronger greenhouse gas, absorbing over a much wider spectrum, and they overlap for the most part. But it also matters in what frequency ranges they absorb.
For this we will have to look at the frequency ranges of the incoming solar radiation and the outgoing black body radiation of the earth. It is the latter that causes the greenhouse effect. Take a look at this chart:
The red area represents the observed amount of solar radiation that reaches the earth’s surface. the white area under the red line represents radiation absorbed in the atmosphere. Likewise, the blue area represents the outgoing black body radiation that is not absorbed. The remaining white area under the magenta, blue or black line represents the retained absorbed energy that causes the greenhouse effect.
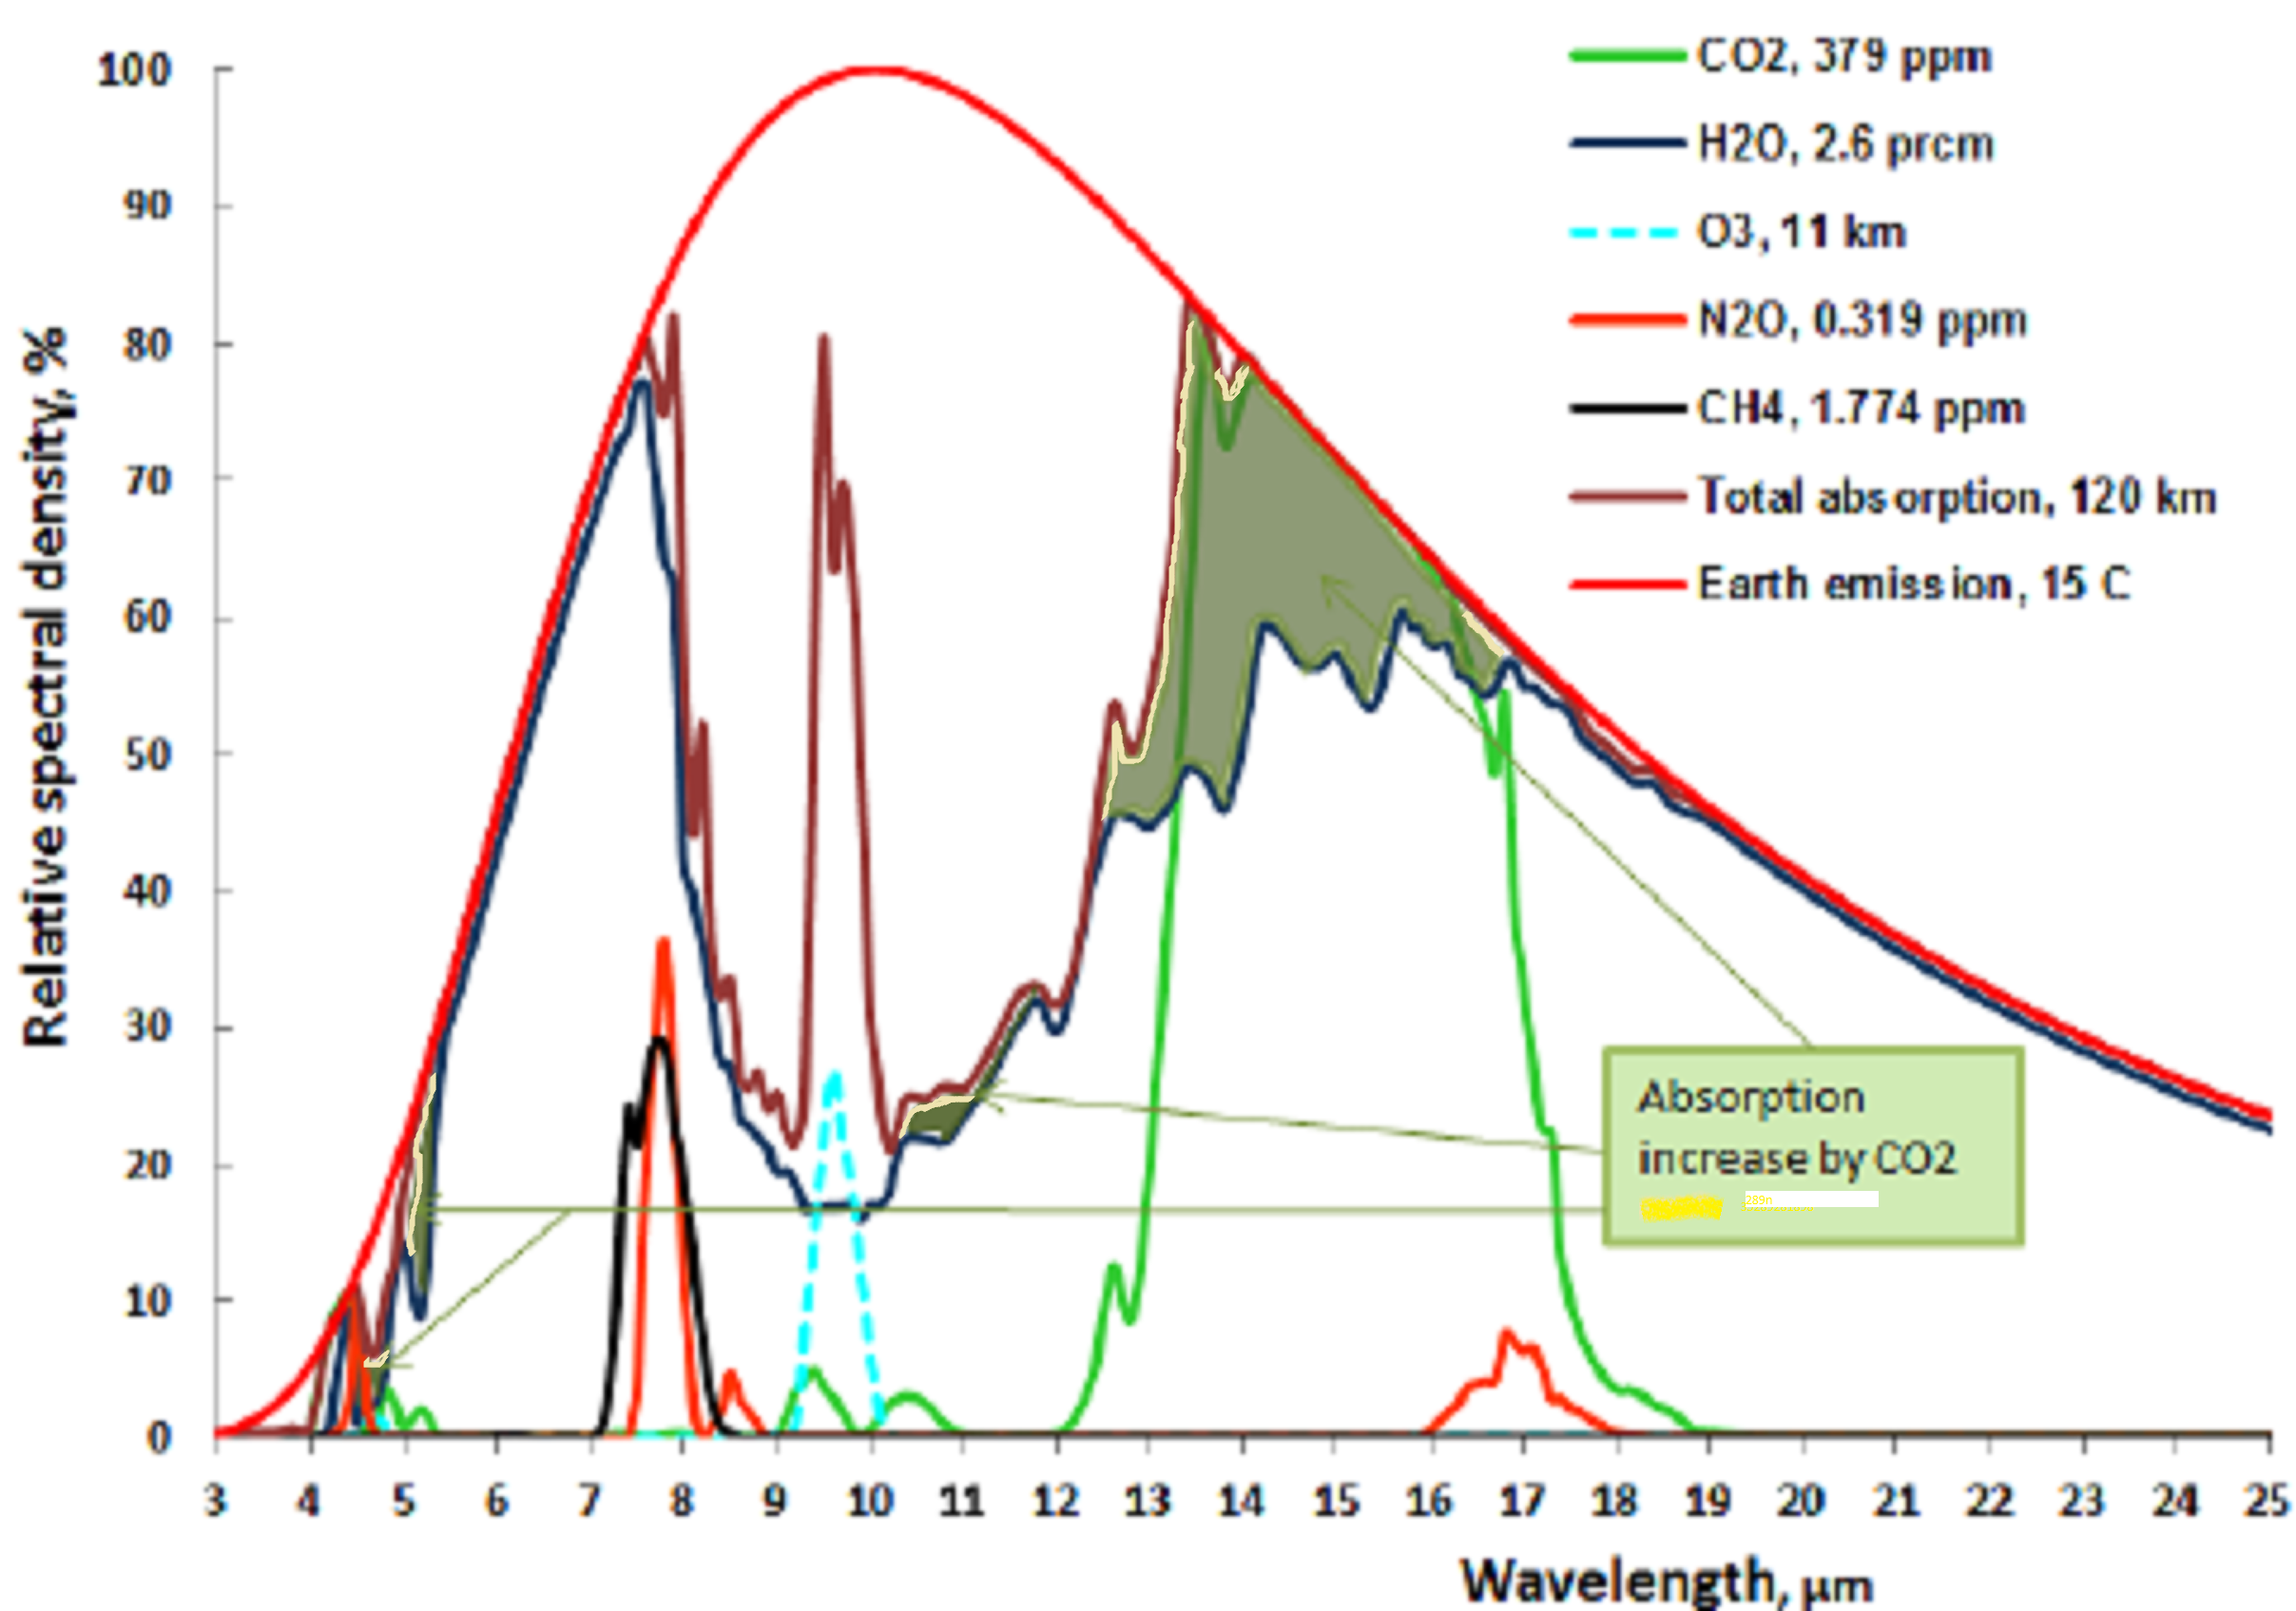
Let us now take a look at the Carbon Dioxide bands of absorption, at 2.7, 4.3 and 15 μm. Of them the 2.7 and 4.3 μm bands absorb where there is little black body radiation, the only band that counts is at 14.9 μm, and that is in a band where the black body radiation is near its maximum. Let us first consider the CO2 alone in a dry atmosphere, that is one with no water vapor at all. We will investigate the concentration of 335 ppm (in 1980) and 415 ppm (in 2022)
The very top line of the top black band represents total absorption at 415 ppm, the bottom of the black black band represents absorption at 335 ppm. Divide the frequency spectrum in 3 parts, below 14 μm, 14-16 μm, and above 16 μm, In the 13 to 14 μm band 66% of available energy is absorbed at 335 ppm, 70% at 415 ppm. in the 14 to 16 μm band 100% of available energy is absorbed at both 335 and 415 ppm. In the > 16 μm the numbers are also 66 and 70%. In addition, temperature is 0.5 C higher at 415 than at 335 ppm, so available energy is 0.7 % higher at 415 ppm.
The net result is greenhouse gas contribution for CO2 is 5.10 C at 335 ppm and 5.26 C at 415 ppm and 1.5C higher ambient temperature for a dry atmosphere.
The normal way to account for greenhouse gasses contribution is to simply add together the CO2 contribution and the contribution from water vapor. This leads to the wrong result for in doing so, the total result is more than 100% for some energy band, because it is impossible to add more than 100% of all available energy for a given wavelength. Again, the spectrum of interest is 13 to 17.4 μm.
The first thing to notice is that no absorption exceeds 100% , so at 14.9 μm wavelength CO2 absorbed 100%, and water vapor absorbed another 75%, the total sum is still 100%. It is impossible to absorb more than 100% of the total energy available for that wavelength. Therefore between the wavelengths 14 and 16 μm all energy was absorbed regardless of CO2 concentration and water vapor concentration. The only fair way to allocate the absorption is proportionally, 57% to CO2 and 43% to water vapor. Likewise, the 13 to 14 μm band is not fully saturated, so the total absorption is 62% of available energy for CO2 and 33% for water vapor. In the 16 to 17.4 μm range the total absorption is 44% for CO2 and 55 % for water vapor. For CO2 at 335 ppm and average temp 13.5 C the total temperature rise, when proportionally allocated comes to 2.73 C for the CO2 and 2.30 C for the water vapor. For CO2 at 415 ppm and an average temp 0.5 C higher, at 14 C average the net temperature increase or ERF in the 13 to 17.4 μm band is 0.035C or +0.17 W/m2 for the water vapor and 0.04C or +0.19 W/m2 for the CO2.
Appendix 2, Methane
Atmospheric methanelevels averaged 2.0 ppm (parts per million) during 2022, or around 25% greater than in 1980. It is a 28 times stronger greenhouse gas by itself unlike CO2, because its absorption is not saturated in the atmosphere. On the other hand the lifetime of Methane in the atmosphere is 10 to 15 years, some of the Methane eating bacteria will do its job. There is only one significant absorption band that absorbs in the atmospheric window at 7.7 μm, at the edge of the atmospheric window.
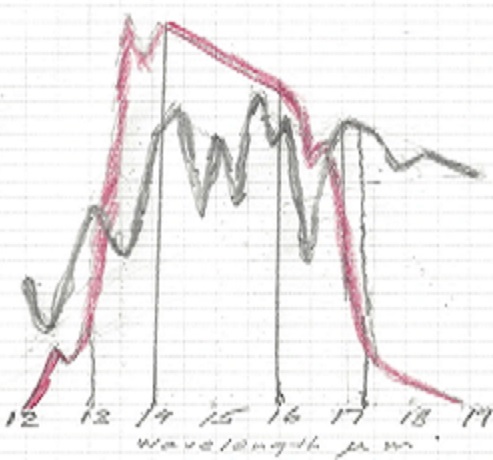
The picture shows a small peak at 7.7μm. This is because at lower wavelengths absorption from water vapor has nearly eliminated the CH4 contribution. Remember that total absorption can never exceed 100 %, so the maximum absorption from CH4 occurs at 7.7μm. At 1.6 ppm it amounts to a greenhouse effect of 0.68 C for a dry gas.
The only major absorption line at 7.7 μm has two side lobes, at 7.5 and 7.9 μm. In the 7.5 μm sideband water vapor already absorbs nearly all energy, so the NH4 is of little effect. In the 7.9 μm sideband water vapor is 50% saturated at that level and the NH4 net absorption is 20% the net greenhouse effect is one fifth of the effect for a dry gas, or 0.14 C. In 1980 the CH4 concentration was 1.6 ppm and will be 2.0 ppm in 2022 which results in an increase of the greenhouse effect of 0.035 C or 0.17 W/m2 ERF from rising levels of Methane since 1980
Appendix 3, N2O.
Atmospheric N2Olevels averaged 336 ppb (parts per billion) during 2022, about and was 301 ppb in 1980. It is a 300 times stronger greenhouse gas than CO2 by itself, because its absorption is not saturated in the atmosphere. When water vapor is dominant it is diminished by over 70% since it is at the edges of the Atmospheric window. On the other hand the lifetime of N20 in the atmosphere is short and is typically greatest at 5 p.m. One of the major reasons for the N2O increase is the increase of fertilization with nitrates, the other is from diesel fumes from trains, boats, ships, trucks and mining equipment
The picture shows a double N2O peak at 7.4 and 7.8 μm. . At 0.336 ppm in 2022it amounts to a greenhouse effect of 0.325 C for a dry gas. In the 7.4 μm band water vapor is saturated, in the 7.8 μm band 80% is saturated by water vapor.In 1980 the N2O concentration was 0.3 ppm which results in an increase of the greenhouse effect of 0.0065 C or 0.031 W/m2 ERF from rising levels of N2O since 1980 .
N2O is commonly called laughing gas, and is hazardous in high concentrations, and should be limited in confined places, but in concentrations of under 1 ppm nobody laughs because of that.
Appendix 4, Ozone.
Ozone or 03 is good if it is in the stratosphere. There it helps to absorb the ultraviolet and cosmic rays from the sun and other cosmic radiation. Ozone is bad if it is near the ground. The total proportion of O3 in the troposphere is about 0.01 ppm, yet it is a substantial greenhouse gas because it forms by uv radiation in the stratosphere and mesosphere, and thus protecting us from uv damage. See figure:
The O3 in the troposphere on the other hand is bad. It is normally around 0.01 ppm, but is considered damaging if people are exposed to more than 0.08 ppm in an 8 hour period. This can happen in urban environments in warm and stagnant weather, typically through car traffic. It is a great greenhouse gas because its main absorption band is at 9.5 μm, right in the atmospheric window where the outgoing black body radiation is the greatest. See fig:
The dotted blue line at 9.5 μm represents the tropospheric absorption, the total absorption is between the brown and the solid blue line. The total greenhouse effect from O3 is 0.88C, but the stratosphere does not interact very much with the troposphere, so the stratospheric O3 does not count as a greenhouse gas, only tropospheric O3. The total contribution to the greenhouse effect from tropospheric O3 is about 1/5 of the total, because atmospheric O2 absorbs in the same band limits the temperature rise to 0.17C When the earth’s temperature rises by 0.5C, from 1980 to 2022, the amount of tropospheric O3 probably rises by 2% (Lacking good data I am guessing wildly, in urban areas it may be much more, but this is global average). This comes to 0.0035C temperature increase or 0.016 W/m2 ERF from O3, from 1980 to 2022.
Appendix 5, CFC gasses.
ChloroFluoroCarbon (CFC) gasses started to be manufactured at the beginning of the refrigeration age, replacing ice as the refrigerant. It soon appeared in the atmosphere, mostly due to leaks in the air conditioner compressor seals. It didn’t amount to much as a greenhouse gas even though it was five thousand times more efficient than CO2 as a greenhouse gas. It was discovered that CFCs ate up the Ozone in the stratosphere, and if it continued to increase it could deplete the protective Ozone layer faster than it could be produced. In fact it created an Ozone hole over Antarctica. So it got forbidden Jan 17, 1994, In 2020 even China stopped production. Since 1994 CFC are decreasing by about 1% per year, but cheating persisted, especially among poorer nations and China. By 2022 it will probably have a greenhouse effect of 0.01C or 0,05 W/m2 ERF.
Appendix 6, HFC gases.
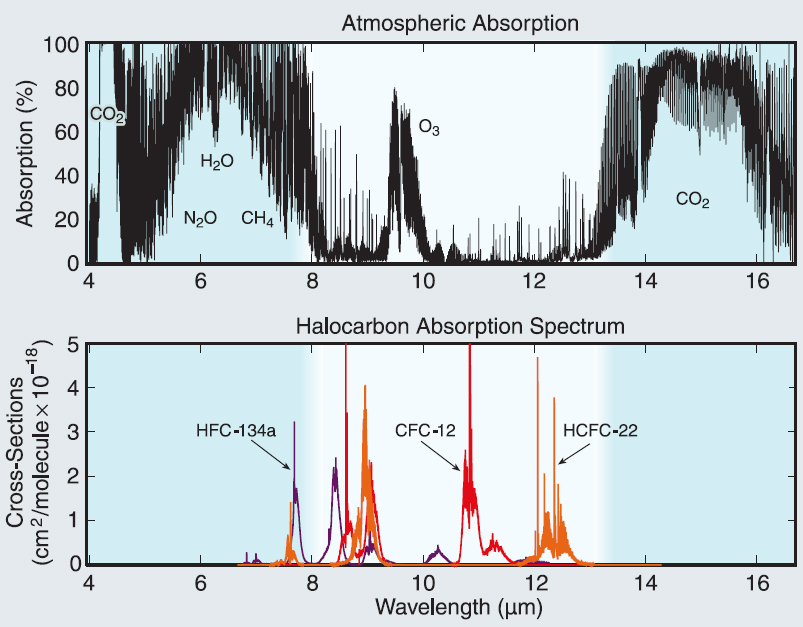
CFC started to be phased out and replaced by HydroFluoroCarbons (HFC), less efficient and more expensive, but at least they do not deplete the Ozone layer that protects us from cancer. Some of the HFCs are even bigger greenhouse effect generators than CFC, but well worth it to protect the Ozone layer. Their biggest absorption bands are in the middle of the atmospheric window.
If nothing is done to control them they will increase from nothing in 1980 until 2022 and beyond. See fig: NOAA Research News
The temperature increase from 1980 to 2022 was 0.0014 C or 0.007 W/m2 ERF..
If you live in the higher latitudes, rain is a nuisance, and as they say in England: Everybody complains about the weather, but nobody does anything about it. In areas of drought, rain is a blessing. The quip ‘poem’ refers to the Bible (of course) and can be found in Matthew 5:43-45. Jesus says in the sermon on the mount:
43 “You have heard that it was said, ‘You shall love your neighbor and hate your enemy.’ 44 But I say to you, love your enemies, bless those who curse you, do good to those who hate you, and pray for those who spitefully use you and persecute you, 45 that you may be sons of your Father who is in heaven. For He makes His sun rise on the evil and on the good and sends rain on the just and on the unjust. (Modern English Version).
It all goes back to the beginning: The Bible says in Genesis 1:
In the beginning God created the heavens and the earth. 2 The earth was formless and void, darkness was over the surface of the deep, and the Spirit of God was moving over the surface of the water.
3 God said, “Let there be light,” and there was light. 4 God saw that the light was good, …..
So the evening and the morning were the first day.
6 Then God said, “Let there be an expanse in the midst of the waters, and let it separate the waters from the waters.” 7 So God made the expanse and separated the waters which were under the expanse from the waters which were above the expanse. And it was so. 8 God called the expanse Heaven. So the evening and the morning were the second day.
Day 3,4,5 and 6 God created Sun, Moon and stars, flora and fauna all after its kind, and at the end of each day God saw that it was good. But God didn’t say it was good after day two!
At the end of day six 26 Then God said, “Let us make man in our image, after our likeness, and let them have dominion over the fish of the sea, and over the birds of the air, and over the livestock, and over all the earth, and over every creeping thing that creeps on the earth.”
27 So God created man in His own image; in the image of God He created him; male and female He created them.
After God had created man in His own image, one kind, two equivalent sexes, male and female, the ecosystem that was started in day 2 was complete, including man and woman; God could finally say: It was very good. God gave us the stewardship of earth, and it is our responsibility not to destroy God’s creation.
There is now great anxiety that we will exceed the all important 1.5 degree Celsius temperature increase since pre-industrial times soon, since we are about to have another el niño. A direct quote in Jan 2019 from scaremonger congresswoman Alexandra Ocasio-Cortez states: ‘The world is going to end in 12 years if we don’t address climate change,‘ Her ‘solution’ is to follow the climate alarmists and do away with all fossil fuel in the next 8 years or sooner. As if that would solve anything.
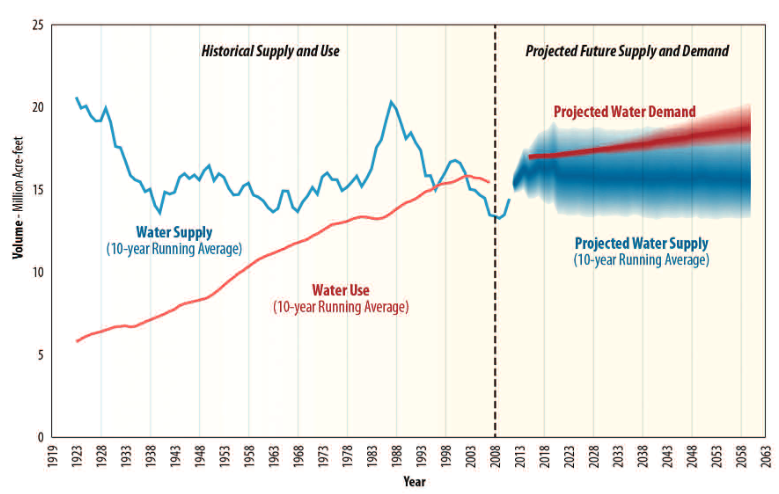
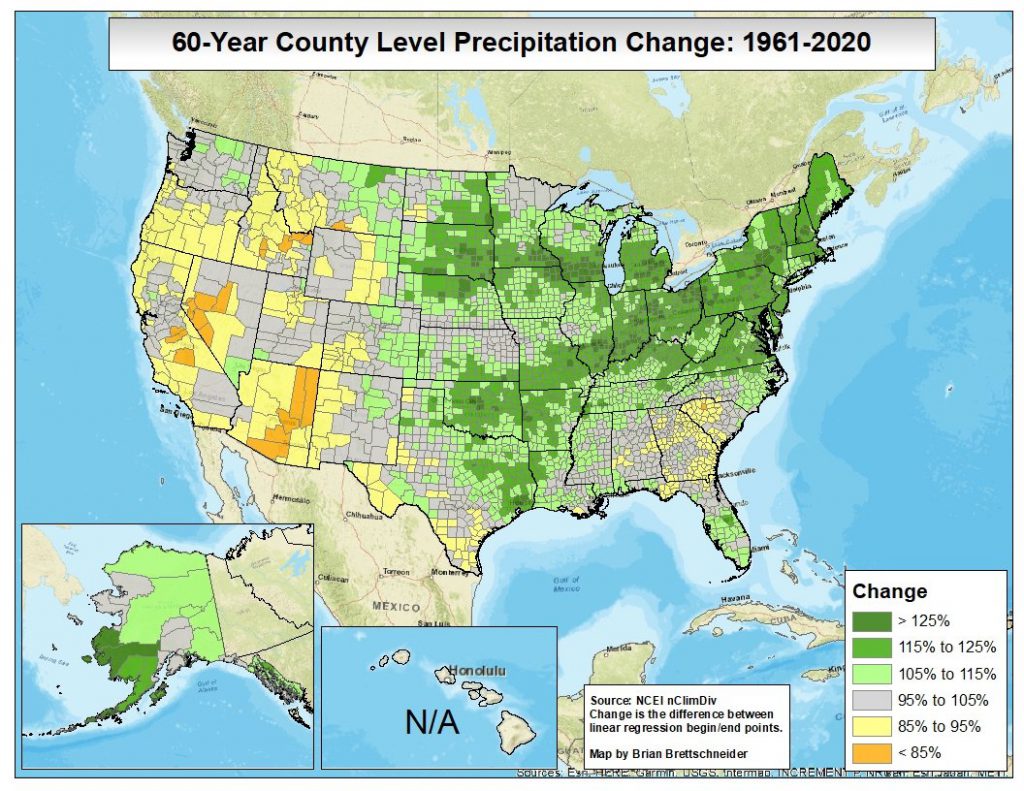
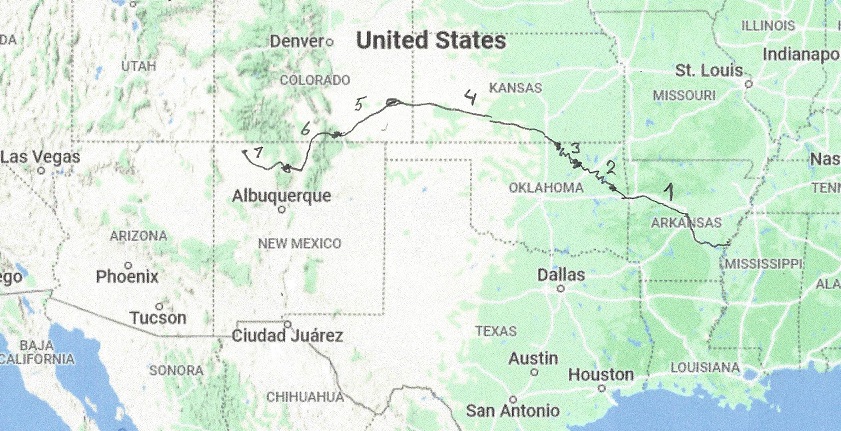
There is a better solution. CO2 is our strongest greenhouse gas, next after water vapor, which is between 5 and 10 times stronger. In fact water vapor is a condensing gas and exists in the atmosphere as unsaturated, oversaturated, as water drops and as ice crystals. The critical thing about precipitation as rain or snow is that it is increasing in areas that already get enough, and is decreasing in areas of insufficient rain or snow. Since 1901, global annual precipitation has increased at an average rate of 0.04 inches per decade, while precipitation in the contiguous 48 states has increased at a rate of 0.20 inches per decade. The eastern parts of the United States have experienced greater increases in precipitation, while the American southwest has experienced a decrease. For example, the Colorado river basin has experienced an annual precipitation decline of 0.6 inches per decade, see fig.
Looking at all of the contiguous 48 states, the precipitation figure looks like this:
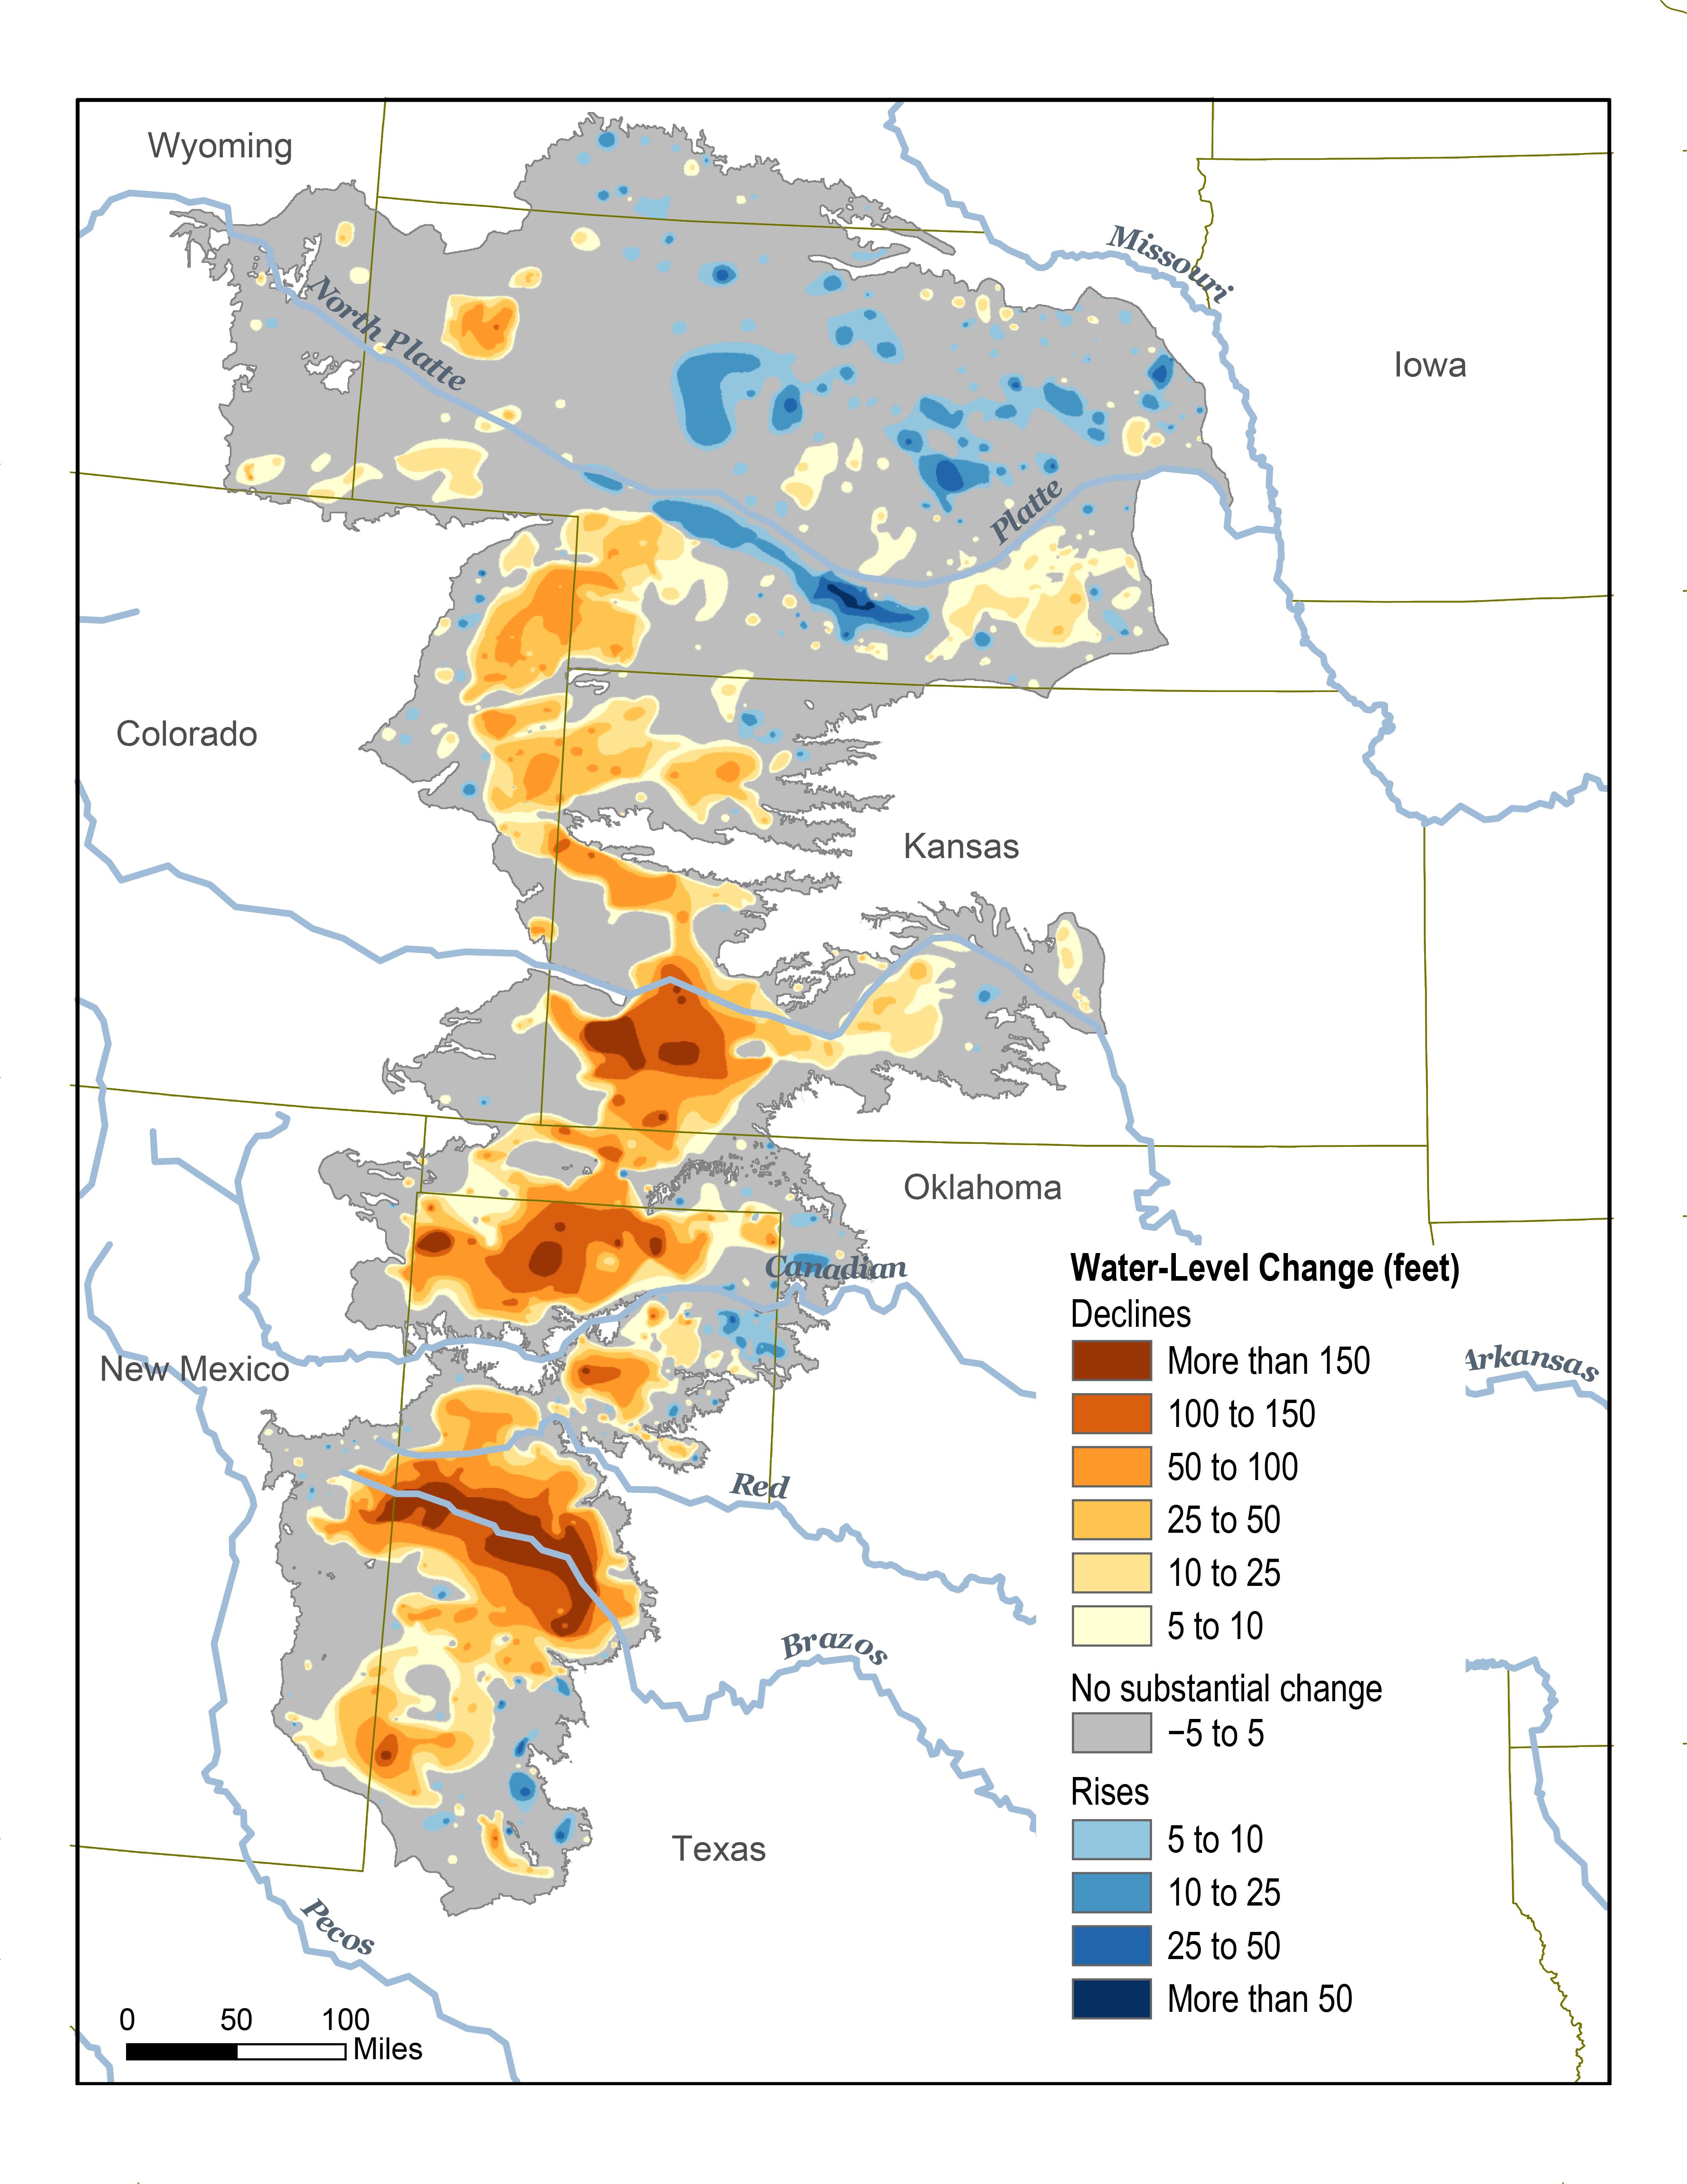
In the East it is all about water responsibilities, you must build a catch basin to catch the water that falls on roads and roofs and other paved surfaces, and release it slowly to lessen floods. In the West it is the other way around, it is all about water rights. If you don’t own the water rights on your property you are not even allowed to water the plants outside with the water that falls on the roof of your own house, even though thatt would benefit the aquifer. In fact, one of the most effective way to destroy the environment is to deplete the aquifers. The situation for the aquifers in the world is already dire. Nearly all big cities in the 10-40 latitudes zone that are not fed by major rivers are already depleting their aquifers at an alarming rate. Mexico City e.g. have exhausted their aquifers and are looking for more water supplies. In addition the lakes are disappearing. Salt Lake is a third of what it was in 1970,The Aral Sea is but a memory, rivers are being dammed so much that even the Euphrates river was running dry last fall, the list goes on. This must be solved.
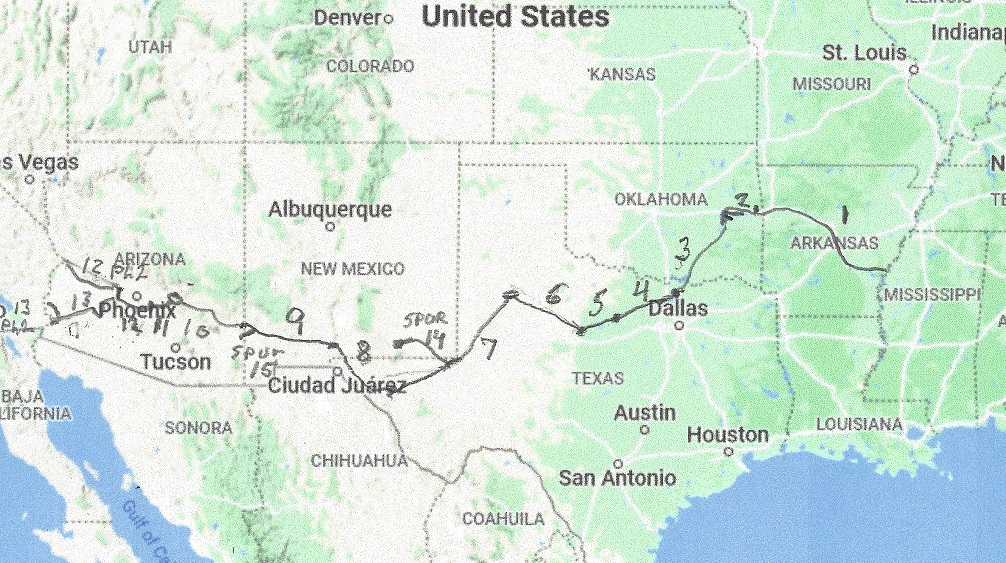
This is a proposal. As in the east, let the water rights belong to the property and cannot be sold separately. This way the water can be stored where it will do most good, at the source. With this comes water responsibility. The landowner is responsible for maintaining the aquifer, and keep it replenished at all times. In times of drought, the aquifers can be temporarily drawn down if there is no water available to purchase at market value. This requires a water exchange market, complete with futures. (This is much more important than a Carbon exchange market). When the drought is over the aquifers must be refilled over time. The West is mostly federal land, except for Indian reservations, see map:
The Indian reservations will be given back the water rights they had before it was taken from them, which was the water that rained on their land. In addition they will be given back the right to use the water from the rivers up to the point of reason, that is what was used before settlers came and took the water rights. They will get the river water free, that will be their reparations, everyone else will have to pay market price for river water. (In the east, the rivers will have excess water, so the price will be zero. and the price for cleaning the water will be paid by the consumer). In the American Southwest, water is the most valuable resource, so water should be priced in an open market.
But how does all of this affect climate change?
The American Southwest is becoming desertified. That means it is slowly made a desert. The aquifers are being depleted and rain is diminishing. This leads to less clouds and even less rain. The worst example is the disappearance of the Aral Sea. Central government (of CSSR) thought it was a good idea to grow cotton and irrigate the land. After a few years of great harvests the rivers dried up, the lake almost disappeared, the clouds disappeared and the rains stopped. This was done in the 70’s and a million people had to be resettled to where there still was water.
The solution is to change the land use to produce more clouds and more rain and snow. To collect the water in lakes, dams and rivers leads to more evaporation, but not more clouds and rain. Only well restored aquifers will solve the problem, together with replanting indigenous trees and other vegetation. For example Pine trees emit ideal aerosols for cloud generation when water vapor becomes oversaturated thanks to evapotranspiration from the same trees. The aquifers must be sufficiently refilled to sustain trees. The trees makes the soil cooler, so unwanted evaporation will be less. The same forests must be well maintained to avoid large wildfires.
It is expensive, but much cheaper than trying to solve climate change by mining up the whole world trying to find enough Lithium, Cobalt and rare earth metals for all the electric cars, trucks and batteries to store the energy needed when the sun doesn’t shine and the wind doesn’t blow. A hint: Use Thorium to replace coal for electricity production, It is already mined when mining rare earth metals. There are many reasons to produce Thorium Nuclear Power. Here are 30 of them
By far, the strongest greenhouse gas is water vapor, not because it is very strong of itself, but it absorbs nearly all outgoing energy in the infrared spectrum except in the so called atmospheric window, where it only partially absorbs. Yet water vapor is missing from the IPCC calculations. Instead is put in a forcing multiplier to account for the water vapor
IPCC has consistently treated the effect of greenhouse gasses as additive, but it is impossible to absorb more than 100% of all emitted energy for a given wavelength. This leads to an overestimation of absorption when 2 or more gases are present. For example, if CO2 absorbs 90% of available energy at 13 μm and water vapor another 50%, the sum is 90% + (1 -0.9} * 0.5 = 95%, not 140%. To see more how the calculations are made, see here.
We have valid satellite data from 1979, and they give very good global averages. so as a test I took a quick look at the temperature rise from 1980 to 2022 and compared what the rise would be, if all greenhouse and other factors would add up to, and to my surprise the result came within 4% of real data, see here.
Between 2022 and 2050 CO2 concentration is expected to increase from 415 ppm to 460 ppm and Methane from 1.9 ppm to 2.23 ppm. these are the most important greenhouse gases after water vapor. The calculations are here.
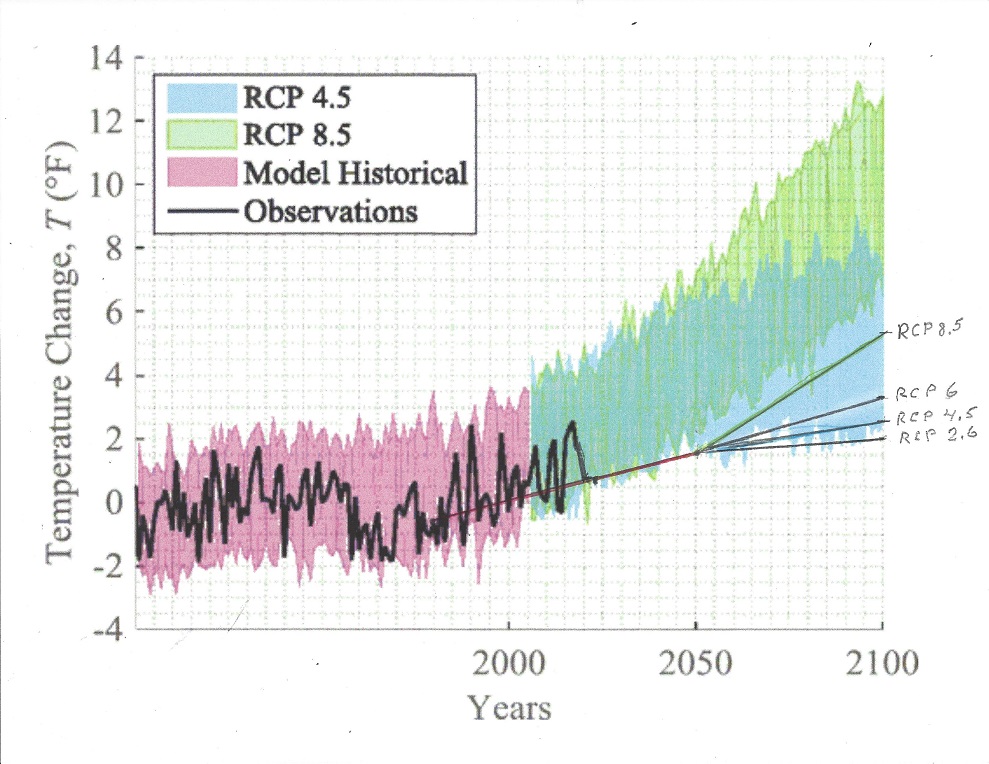
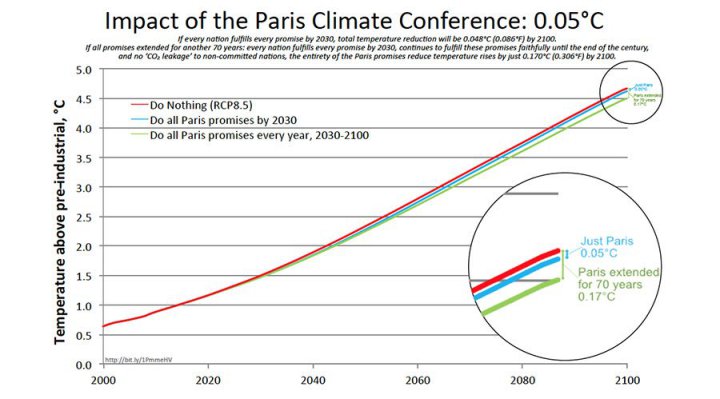
Extended to 2100 IPCC has given 4 scenarios for future temperature development. RCP 8.5 assumes that all future energy growth is provided by fossil fuel, and at least most nuclear energy is phased out. the 8.5 stands for W/m2 for CO2 increase as per IPCC calculation. See further here.
RPC 6 and RPC 4.5 are intermediate stages , while RPC 2.6 achieves net CO2 decline by 2100, but still rising temperature. Here is a figure for the different scenarios.
Calculations:
Scenario 1: RCP 8.5, CO2 1370 ppm, CH4 4 ppm, N2O+20%, HFC +20%, air pollutants -50%, population 12 billion, GDP 170 Trillion$ (2000)
Summary of all greenhouse effect causes for temperature rise from 2050 until 2100:
Effect from water vapor increase: 2.22 C or 10.54 W/m2;
Effect from rising CO2: 0.40C or 1.89 W/m2;
Effect from rising Methane: 0.09C or 0.43 W/m2,
Effect from rising N2O: 0.005C or 0.024 W/m2
Effect from rising Ozone: 0.0005C or 0.002 W/m2
Effect from rising HFCs : 0.006 C or 0.027 W/m2
TOTAL TEMPERATURE CHANGE 2050 to 2100: 2.72 C or 12.9 W/m2
Summary of all non-greenhouse effect causes for climate change from 2050 to 2100:
Long term warming of the sun: 0.0000005C
Temperature decrease from the Milankovitch cycle: – 0.02C or – 0.10 W/m2
Temperature increase from changing solar spot activity + 0.007 C or 0.033 W/m2
Temperature rise from decreasing cloud cover of 0.05 C or 0.24 W/m2.
Change from temperature rise of the Arctic 0.05 C or 0.24 W/m2
Pollution aerosols cause a temperature decrease of – 0.03 C or – 0.12 W/m2
Temperature increase from greening of the earth 0.004C or 0.020 W/m2
Temperature decrease from areas of desertification – 0.001C or 0.005 W/m2.
TOTAL TEMPERATURE RISE FROM OTHER THAN GREENHOUSE GASES FROM 2050 to 2100: 0.060 C or 0.308 W/m2
TEMPERATURE CHANGE FROM 2050 TO 2100 FROM ALL CAUSES: 2.78 C or 13.2 W/m2
Scenario 2: RCP 6.5, CO2 850 ppm, CH4 1.9 ppm, N2O-10%, HFC +20%, air pollutants -50%, population 9.5 billion, GDP 160 T$
Summary of all greenhouse effect causes for temperature rise from 2050 until 2100:
Effect from water vapor increase: 1.28C or 5.95 W/m2;
Effect from rising CO2: 0.20 C or 0.93 W/m2;
Effect from falling Methane: – 0.02C or 0.08 W/m2,
Effect from rising N2O: 0.001C or 0.005 W/m2
Effect from rising Ozone: 0.0005C or 0.002 W/m2
Effect from rising HFCs : 0.006 C or 0.027 W/m2
TOTAL TEMPERATURE CHANGE 2050 to 2100: 1.4665 C or 6.83 W/m2
Summary of all non-greenhouse effect causes for climate change from 2050 to 2100:
Long term warming of the sun: 0.0000005C
Temperature decrease from the Milankovitch cycle: – 0.02C or 0.10 W/m2
Temperature increase from changing solar spot activity + 0.007 C or 0.033 W/m2
Temperature rise from decreasing cloud cover of 0.05 C or 0.24 W/m2.
Change from temperature rise of the Arctic 0.05 C or 0.24 W/m2
Less pollution aerosols cause a temperature increase of 0.05 C or 0.24 W/m2
Temperature increase from greening of the earth 0.002C or 0.010 W/m2
Temperature decrease from areas of desertification – 0.001C or 0.005 W/m2.
TOTAL TEMPERATURE RISE FROM OTHER THAN GREENHOUSE GASES FROM 2050 to 2100: 0.138 C or 0.658 W/m2
TEMPERATURE CHANGE FROM 2050 TO 2100 FROM ALL CAUSES: 1.6 C or 7.5 W/m2
Scenario 3: RCP 4, CO2 650 ppm, CH4 2.0 ppm, N2O-10%, HFC 0%, air pollutants -50%, population 8.7 billion, GDP 280 T$
Summary of all greenhouse effect causes for temperature rise from 2050 until 2100:
Effect from water vapor increase: 0.88 C or 4.19 W/m2;
Effect from rising CO2: 0.08 C or 0.40 W/m2;
Effect from stable Methane: 0.0 C or 0.0 W/m2,
Effect from falling N2O: 0.004C or 0.02 W/m2
Effect from stable Ozone: 0.0 C or 0.0 W/m2
Effect from stable HFCs : 0.0 C or 0.0 W/m2
TOTAL TEMPERATURE CHANGE 2050 to 2100: 0.964C or 4.61 W/m2
Summary of all non-greenhouse effect causes for climate change from 2050 to 2100:
Long term warming of the sun: 0.0000005C
Temperature decrease from the Milankovitch cycle: – 0.02C or 0.10 W/m2
Temperature increase from changing solar spot activity + 0.007 C or 0.033 W/m2
Temperature rise from decreasing cloud cover of 0.05 C or 0.24 W/m2.
Change from temperature rise of the Arctic 0.05 C or 0.24 W/m2
Pollution aerosols cause a temperature increase of 0.05 C or 0.24 W/m2
Temperature increase from greening of the earth 0.002C or 0.010 W/m2
Temperature decrease from areas of desertification – 0.001C or 0.005 W/m2.
TOTAL TEMPERATURE RISE FROM OTHER THAN GREENHOUSE GASES FROM 2050 to 2100: 0.135 C or 0.658 W/m2
TEMPERATURE CHANGE FROM 2050 TO 2100 FROM ALL CAUSES: 1.1 C or 5.3 W/m2
Scenario 4: RCP 2.6, CO2 490 ppm, CH4 1.5 ppm, N2O-15%, HFC -10%, air pollutants -75%, population 9 billion, GDP 320 T$
Summary of all greenhouse effect causes for temperature rise from 2050 until 2100:
Effect from water vapor increase: 0.55 C or 2.55W/m2;
Effect from rising CO2: 0.02C or 0.07 W/m2;
Effect from declining Methane: – 0.01C or 0.06 W/m2,
Effect from stable N2O: 0.0 C or 0.0 W/m2
Effect from stable Ozone: 0.0 C or 0.0 W/m2
Effect from stable HFCs : 0.0 C or 0.0 W/m2
TOTAL TEMPERATURE CHANGE 2050 to 2100: 0.56 C or 2.56 W/m2
Summary of all non-greenhouse effect causes for climate change from 2050 to 2100:
Long term warming of the sun: 0.0000005C
Temperature decrease from the Milankovitch cycle: – 0.02C or 0.10 W/m2
Temperature increase from changing solar spot activity + 0.007 C or 0.033 W/m2
Temperature rise from decreasing cloud cover of 0.02 C or 0.10 W/m2.
Change from temperature rise of the Arctic 0.05 C or 0.24 W/m2
Pollution aerosols cause a temperature increase of 0.08 C or 0.36 W/m2
Temperature increase from greening of the earth 0.002C or 0.010 W/m2
Temperature decrease from areas of desertification – 0.001C or 0.005 W/m2.
TOTAL TEMPERATURE RISE FROM OTHER THAN GREENHOUSE GASES FROM 2050 to 2100: 0.138 C or 0.64 W/m2
TEMPERATURE CHANGE FROM 2050 TO 2100 FROM ALL CAUSES: 0.70 C or 3.2 W/m2
The temperature data from 1980 to 2022 is the control group, and is based on real data.It was then the basis for doing the 2022 to 2050 calculation assuming no mitigation efforts, the most likely result if none of the Paris accord is implemented. The climate target is to stay under + 1.5 C, and this model, that worked better than 95% accurate between 1980 and 2022, comes up with a temperature rise of 1.28C, well below the 1.5C maximum rise since the 1800s
By far, the strongest greenhouse gas is water vapor, not because it is very strong of itself, but it absorbs nearly all outgoing energy in the infrared spectrum except in the so called atmospheric window, where it only partially absorbs. Yet water vapor is missing from the IPCC AR6 chart seen here:
IPCC has consistently treated the effect of greenhouse gasses as additive, but it is impossible to absorb more than 100% of all emitted energy for a given wavelength. This leads to an overestimation of absorption when 2 or more gasses are present. For example, if CO2 absorbs 90% of available energy at 13 μm and water vapor another 50%, the sum is 90% + (1 -0.9} * 0.5 = 95%, not 140%
This will change the relative importance of greenhouse gasses drastically so it must be tested against reality. We now have a good global satellite temperature record from 1980 to 2022 or 43 years:
During this time the temperature rise was 0.5 C, which translates to 2.375 W/m2 ERF
Water vapor.
This is a good chart to see the relative importance of all major greenhouse gasses:
It is to be noted that water vapor also absorbs the incoming solar radiation in certain wavelengths, but solar influx is assumed to be constant.
When average temperature rises 0.5 C, the possible absorption rises by 2.375 W/m2 minus the energy that escapes through the atmospheric window.Water vapor through saturation: is responsible for all of this increase except where other gasses also absorb in the atmospheric window, and in the atmospheric window the absorption must be proportionally shared, subject to the 100% absorption limitation.The atmospheric window is about 26% of all the emitted radiation so net water absorption is 0.74 * 2.375 = 1.6 W.m2 or 0.34 C. However, the relative humidity is also decreasing, see picture:
Between 1980 and 2022 the net humidity increase is 3.6% minus 0.75% relative humidity for a net increase of 3.54%. This increase only matters in the atmospheric window which is on average 25% saturated, so the total increase from water vapor increase is 0.26 * 2.375 * 0.25 * 0.9925 = 0.15 W/m2 or 0.03 C., to be added to the total before increase in humidity.This means that for a 0.5C temperature increase between 1980 and 2022 the total sensitivity to water vapor is 1.75 W/m2 or 0.37 C
Carbon dioxide
CO2 is the strongest greenhouse gas after water vapor. The only wavelength band that is meaningful is 13 to 17.4 μm and absorption occurs from both CO2 and water vapor. Since they exist together, the effect of each of them must be proportionally allocated, or the sum of them added would exceed 100%
Between 1980 and 2022 the CO2 levels rose from 335 ppm to 415 ppm or 24% increase. The temperature increase 0.5 C. The net temperature increase or ERF in the 13 to 17.4 μm band is 0.035C or +0.17 W/m2 for the water vapor and 0.04C or +0.19 W/m2 for the CO2. To see how the calculation was made, go to Appendix 1.
Methane.
Methane gas is created from a variety of sources, both man made and natural. See pie chart
The good thing about methane is that its lifetime in the atmosphere is only 10 to 15 years, and the real contribution to climate change is only 1/5th of what is commonly advertised, since iits absorption bands occur together with partly saturated absorption from water vapor. See appendix 2.
In 1980 the CH4 concentration was 1.6 ppm and will be 2.0 ppm in 2022 which results in an increase of the greenhouse effect of 0.035 C or 0.17 W/m2 ERF from rising levels of Methane since 1980.
N2O.
Atmospheric N2Olevels averaged 336 ppb (parts per billion) during 2022, about and was 301 ppb in 1980. It is a 300 times stronger greenhouse gas than CO2 by itself, because its absorption is not saturated in the atmosphere. When water vapor is dominant it is diminished by over 70% since it is at the edges of the Atmospheric window. For calculations see Appendix 3.
In 1980 the N2O concentration was 0.3 ppm which results in an increase of the greenhouse effect of 0.0065 C or 0.031 W/m2 ERF from rising levels of N2O since 1980 .
Ozone.
Ozone occurs as stratospheric O3 which is good. It protects us from uv radiation. O3 in the troposphere is considered harmful if it is over 0.08% It is normally around 0,01% in the troposphere. For calculations and figures, see appendix 4.
When the earth’s temperature rises by 0.5C, from 1980 to 2022, the amount of tropospheric O3 probably rises by 2% (Lacking good data I am guessing wildly, in urban areas it may be much more, but this is global average). This comes to 0.0034C temperature increase or 0.016 W/m2 ERF from O3, from 1980 to 2022.
CFC gasses.
CFC’s are cheap and efficient gasses to use in refrigerators and air conditioners.Their use rose rapidly until it was discovered they destroyed the protective ozone layer in the stratosphere, so its use, got banned in 1994, later diminished including its use in inhalers. CFCs has since diminished slowly and is maybe already below the levels in 1980. See also Appendix 5.
HFC gasses.
HFCs replaced CFCs and are rapidly growing in use, and the compressor seals still leak. For pictures on why they are a growing concern for the future, see Appendix 6.
The temperature increase from 1980 to 2022 was 0.0015 C or 0.007 W/m2 ERF.
Summary of all greenhouse effect causes for temperature rise from 1980 until 2022:
Effect from water vapor increase: 0.37 C or 1.75 W/m2; 80.9% of total
Effect from rising CO2: 0.04C or 0.19 W/m2; 8.78% of total
Effect from rising Methane: 0.036 C or 0.17 W/m2, 7.86% of total
Effect from rising N2O: 0.0065 C or 0.031 W/m2 1.4% of total
Effect from rising Ozone: 0.0034C or 0.016 W/m2 0.7% of total
Effect from rising HFCs : 0.0015 C or 0.007 W/m2 0.3% of total
TOTAL TEMPERATURE CHANGE 1980 to 2022: 0.4544C or 2.164 W/m2
Conclusion
CO2 amounts to less than 10% if the temperature increase since 1980, and so does Methane. The green new deal is a pipe dream that does not solve the climate problem, but will make it worse.the price of lithium carbonate used in batteries has risen sixteen-fold between 2020 and late 2022. Since then, it has dropped to one third of its peak price. China has corned the market in Lithium for now. There is not enough Lithium to be economically and ecologically justifiable to mine to meet demand in the future. Since solar and wind power are intermittent supplier of electricity they can never be used as base supplier of energy. Other solutions must be offered
Actions to be taken
What congress is doing to solve the problem.
Congress has passed the anti-inflation bill that included over 300 billion to fight climate change, and it included more solar panels and wind turbine motors to be imported from China. The experience from Europe is that electricity from solar panels and windmills is 5.7 times as expensive as conventional power generation.
This analysis was done for 2019, before COVID. The situation is worse now, with electricity rares up to 80 c/kWh, topping $1 /kWh last winter in some countries before subsides.
Even at the current increased European Gas prices, the estimated excess expenditures on Weather-Dependent “Renewables” in Europe is still very large: $0.5 trillion in capital expenditures and $1.2 trillion excess expenditures in the long-term.
These simple calculations show that any claim that Wind and Solar power are now cost competitive with conventional fossil fuel (Gas-fired) generation are patently false. The figures give an outline of the financial achievements of Green activists in stopping fracking for gas in Europe, close on to $1.2 trillion of excess costs.
It would be better not to import any solar panels and wind power generators from China and let them pay for the extra cost rather than building more coal burning plants. After all they were planning to build over a thousand new plants between now and 2030, all legal under the Paris accord. This would benefit the world climate much more, since Chinese coal plants are far more polluting, since China has far less stringent environmental regulations than U.S.
U.S. uses 13.5% of the world’s coal, and eliminating U.S. CO2 emissions would in time reduce the world temperature by 0.023C, providing no other country, such as China and India would increase their use of Coal, which they are, to the total of 1300 new coal plants between now and 2030. This would raise global temperature by more than 0.06 C.
What congress should do instead.
a. What congress should do immediately.
Immediately stop downblending U 233 and pass The Thorium Energy security act SB 4242a. See more here.
2. Remove Thorium from the list of nuclear source material. The half-life of Thorium232 is 14 billion years, so its radioactivity is barely above background noise. More importantly, while Thorium is fertile, it is not fissile and should therefore not be included in the list. This would make it far easier to mine rare earth metals, as long as the ore consists of less than 0.05% Uranium, but any amount of Thorium is allowed without classifying the ore “Source material”.
3. Separate nuclear power into 3 categories. a. conventional nuclear power. b. Thorium breeder reactors that make more U233 than it consumes, and c. Thorium reactors that reduce nuclear waste.
4. Stop buying solar panels from China. Stop buying wind turbine generators from China. Let them install those in China and pay 5 times as much for their electricity.
5. Immediately form a commission led by competent people, not politicians; to decide how to best expand the electric grid and to best harden it against electro-magnetic pulses, whether solar or nuclear and to safeguard it against sabotage.
6. Remove all subsidies on electric cars, solar panels and wind generators, but continue to encourage energy conservation.
7. Encourage research and development of Thorium fueled reactors, especially liquid salt reactors by drastically simplifying and speeding up the approval process. President Trump issued an executive order in the last month of his presidency EO 13972 specifying that the United States must sustain its ability to meet the energy requirements for its national defense and space exploration initiatives. The ability to use small modular reactors will help maintain and advance United States dominance and strategic leadership across the space and terrestrial domains. This EO should be expanded to include civilian small modular reactors, including Liquid salt Thorium reactors less than 200 MW, which are the only valid reactors for space exploration.
Appendix 1, CO2
The following chart shows both CO2 and H2O are absorbing greenhouse gases, with H20 being the stronger greenhouse gas, absorbing over a much wider spectrum, and they overlap for the most part. But it also matters in what frequency ranges they absorb.
For this we will have to look at the frequency ranges of the incoming solar radiation and the outgoing black body radiation of the earth. It is the latter that causes the greenhouse effect. Take a look at this chart:
The red area represents the observed amount of solar radiation that reaches the earth’s surface. the white area under the red line represents radiation absorbed in the atmosphere. Likewise, the blue area represents the outgoing black body radiation that is not absorbed. The remaining white area under the magenta, blue or black line represents the retained absorbed energy that causes the greenhouse effect.
Let us now take a look at the Carbon Dioxide bands of absorption, at 2.7, 4.3 and 15 μm. Of them the 2.7 and 4.3 μm bands absorb where there is little black body radiation, the only band that counts is at 14.9 μm, and that is in a band where the black body radiation is near its maximum. Let us first consider the CO2 alone in a dry atmosphere, that is one with no water vapor at all. We will investigate the concentration of 335 ppm (in 1980) and 415 ppm (in 2022)
The very top line of the top black band represents total absorption at 415 ppm, the bottom of the black black band represents absorption at 335 ppm. Divide the frequency spectrum in 3 parts, below 14 μm, 14-16 μm, and above 16 μm, In the 13 to 14 μm band 66% of available energy is absorbed at 335 ppm, 70% at 415 ppm. in the 14 to 16 μm band 100% of available energy is absorbed at both 335 and 415 ppm. In the > 16 μm the numbers are also 66 and 70%. In addition, temperature is 0.5 C higher at 415 than at 335 ppm, so available energy is 0.7 % higher at 415 ppm.
The net result is greenhouse gas contribution for CO2 is 5.10 C at 335 ppm and 5.26 C at 415 ppm and 1.5C higher ambient temperature for a dry atmosphere.
The normal way to account for greenhouse gasses contribution is to simply add together the CO2 contribution and the contribution from water vapor. This leads to the wrong result for in doing so, the total result is more than 100% for some energy band, because it is impossible to add more than 100% of all available energy for a given wavelength. Again, the spectrum of interest is 13 to 17.4 μm.
The first thing to notice is that no absorption exceeds 100% , so at 14.9 μm wavelength CO2 absorbed 100%, and water vapor absorbed another 75%, the total sum is still 100%. It is impossible to absorb more than 100% of the total energy available for that wavelength. Therefore between the wavelengths 14 and 16 μm all energy was absorbed regardless of CO2 concentration and water vapor concentration. The only fair way to allocate the absorption is proportionally, 57% to CO2 and 43% to water vapor. Likewise, the 13 to 14 μm band is not fully saturated, so the total absorption is 62% of available energy for CO2 and 33% for water vapor. In the 16 to 17.4 μm range the total absorption is 44% for CO2 and 55 % for water vapor. For CO2 at 335 ppm and average temp 13.5 C the total temperature rise, when proportionally allocated comes to 2.73 C for the CO2 and 2.30 C for the water vapor. For CO2 at 415 ppm and an average temp 0.5 C higher, at 14 C average the net temperature increase or ERF in the 13 to 17.4 μm band is 0.035C or +0.17 W/m2 for the water vapor and 0.04C or +0.19 W/m2 for the CO2.
Appendix 2, Methane
Atmospheric methanelevels averaged 2.0 ppm (parts per million) during 2022, or around 25% greater than in 1980. It is a 28 times stronger greenhouse gas by itself unlike CO2, because its absorption is not saturated in the atmosphere. On the other hand the lifetime of Methane in the atmosphere is 10 to 15 years, some of the Methane eating bacteria will do its job. There is only one significant absorption band that absorbs in the atmospheric window at 7.7 μm, at the edge of the atmospheric window.
The picture shows a small peak at 7.7μm. This is because at lower wavelengths absorption from water vapor has nearly eliminated the CH4 contribution. Remember that total absorption can never exceed 100 %, so the maximum absorption from CH4 occurs at 7.7μm. At 1.6 ppm it amounts to a greenhouse effect of 0.68 C for a dry gas.
The only major absorption line at 7.7 μm has two side lobes, at 7.5 and 7.9 μm. In the 7.5 μm sideband water vapor already absorbs nearly all energy, so the NH4 is of little effect. In the 7.9 μm sideband water vapor is 50% saturated at that level and the NH4 net absorption is 20% the net greenhouse effect is one fifth of the effect for a dry gas, or 0.14 C. In 1980 the CH4 concentration was 1.6 ppm and will be 2.0 ppm in 2022 which results in an increase of the greenhouse effect of 0.035 C or 0.17 W/m2 ERF from rising levels of Methane since 1980
Appendix 3, N2O.
Atmospheric N2Olevels averaged 336 ppb (parts per billion) during 2022, about and was 301 ppb in 1980. It is a 300 times stronger greenhouse gas than CO2 by itself, because its absorption is not saturated in the atmosphere. When water vapor is dominant it is diminished by over 70% since it is at the edges of the Atmospheric window. On the other hand the lifetime of N20 in the atmosphere is short and is typically greatest at 5 p.m. One of the major reasons for the N2O increase is the increase of fertilization with nitrates, the other is from diesel fumes from trains, boats, ships, trucks and mining equipment
The picture shows a double N2O peak at 7.4 and 7.8 μm. . At 0.336 ppm in 2022it amounts to a greenhouse effect of 0.325 C for a dry gas. In the 7.4 μm band water vapor is saturated, in the 7.8 μm band 80% is saturated by water vapor.In 1980 the N2O concentration was 0.3 ppm which results in an increase of the greenhouse effect of 0.0065 C or 0.031 W/m2 ERF from rising levels of N2O since 1980 .
N2O is commonly called laughing gas, and is hazardous in high concentrations, and should be limited in confined places, but in concentrations of under 1 ppm nobody laughs because of that.
Appendix 4, Ozone.
Ozone or 03 is good if it is in the stratosphere. There it helps to absorb the ultraviolet and cosmic rays from the sun and other cosmic radiation. Ozone is bad if it is near the ground. The total proportion of O3 in the troposphere is about 0.01 ppm, yet it is a substantial greenhouse gas because it forms by uv radiation in the stratosphere and mesosphere, and thus protecting us from uv damage. See figure:
The O3 in the troposphere on the other hand is bad. It is normally around 0.01 ppm, but is considered damaging if people are exposed to more than 0.08 ppm in an 8 hour period. This can happen in urban environments in warm and stagnant weather, typically through car traffic. It is a great greenhouse gas because its main absorption band is at 9.5 μm, right in the atmospheric window where the outgoing black body radiation is the greatest. See fig:
The dotted blue line at 9.5 μm represents the tropospheric absorption, the total absorption is between the brown and the solid blue line. The total greenhouse effect from O3 is 0.88C, but the stratosphere does not interact very much with the troposphere, so the stratospheric O3 does not count as a greenhouse gas, only tropospheric O3. The total contribution to the greenhouse effect from tropospheric O3 is about 1/5 of the total, because atmospheric O2 absorbs in the same band limits the temperature rise to 0.17C When the earth’s temperature rises by 0.5C, from 1980 to 2022, the amount of tropospheric O3 probably rises by 2% (Lacking good data I am guessing wildly, in urban areas it may be much more, but this is global average). This comes to 0.0035C temperature increase or 0.016 W/m2 ERF from O3, from 1980 to 2022.
Appendix 5, CFC gasses.
ChloroFluoroCarbon (CFC) gasses started to be manufactured at the beginning of the refrigeration age, replacing ice as the refrigerant. It soon appeared in the atmosphere, mostly due to leaks in the air conditioner compressor seals. It didn’t amount to much as a greenhouse gas even though it was five thousand times more efficient than CO2 as a greenhouse gas. It was discovered that CFCs ate up the Ozone in the stratosphere, and if it continued to increase it could deplete the protective Ozone layer faster than it could be produced. In fact it created an Ozone hole over Antarctica. So it got forbidden Jan 17, 1994, In 2020 even China stopped production. Since 1994 CFC are decreasing by about 1% per year, but cheating persisted, especially among poorer nations and China. By 2022 it will probably have a greenhouse effect of 0.01C or 0,05 W/m2 ERF.
Appendix 6, HFC gases.
CFC started to be phased out and replaced by HydroFluoroCarbons (HFC), less efficient and more expensive, but at least they do not deplete the Ozone layer that protects us from cancer. Some of the HFCs are even bigger greenhouse effect generators than CFC, but well worth it to protect the Ozone layer. Their biggest absorption bands are in the middle of the atmospheric window.
If nothing is done to control them they will increase from nothing in 1980 until 2022 and beyond. See fig: NOAA Research News
The temperature increase from 1980 to 2022 was 0.0014 C or 0.007 W/m2 ERF..
By far, the strongest greenhouse gas is water vapor, not because it is very strong of itself, but it absorbs nearly all outgoing energy in the infrared spectrum except in the so called atmospheric window, where it only partially absorbs. Yet water vapor is missing from the IPCC AR6 chart seen here:
IPCC has consistently treated the effect of greenhouse gasses as additive, but it is impossible to absorb more than 100% of all emitted energy for a given wavelength. This leads to an overestimation of absorption when 2 or more gasses are present. For example, if CO2 absorbs 90% of available energy at 13 μm and water vapor another 50%, the sum is 90% + (1 -0.9} * 0.5 = 95%, not 140%
This will change the relative importance of greenhouse gasses drastically so it must be tested against reality. We now have a good global satellite temperature record from 1980 to 2022 or 43 years:
During this time the temperature rise was 0.5 C, which translates to 2.375 W/m2 ERF
Water vapor.
This is a good chart to see the relative importance of all major greenhouse gasses:
It is to be noted that water vapor also absorbs the incoming solar radiation in certain wavelengths, but solar influx is assumed to be constant.
When average temperature rises 0.5 C, the possible absorption rises by 2.375 W/m2 minus the energy that escapes through the atmospheric window.Water vapor through saturation: is responsible for all of this increase except where other gasses also absorb in the atmospheric window, and in the atmospheric window the absorption must be proportionally shared, subject to the 100% absorption limitation.The atmospheric window is about 26% of all the emitted radiation so net water absorption is 0.74 * 2.375 = 1.6 W.m2 or 0.34 C. However, the relative humidity is also decreasing, see picture:
Between 1980 and 2022 the net humidity increase is 3.6% minus 0.75% relative humidity for a net increase of 3.54%. This increase only matters in the atmospheric window which is on average 25% saturated, so the total increase from water vapor is 0.26 * 2.375 * 0.25 * 0.9925 = 0.15 W/m2 or 0.03 C. This means that for a 0.5C temperature increase between 1980 and 2022 the total sensitivity to water vapor is 1.75 W/m2 or 0.37 C
Carbon dioxide
CO2 is the strongest greenhouse gas after water vapor. The only wavelength band that is meaningful is 13 to 17.4 μm and absorption occurs from both CO2 and water vapor. Since they exist together, the effect of each of them must be proportionally allocated, or the sum of them added would exceed 100%
Between 1980 and 2022 the CO2 levels rose from 335 ppm to 415 ppm or 24% increase. The temperature increase 0.5 C. The net temperature increase or ERF in the 13 to 17.4 μm band is 0.035C or +0.17 W/m2 for the water vapor and 0.04C or +0.19 W/m2 for the CO2. To see how the calculation was made, go to Appendix 1.
Methane.
Methane gas is created from a variety of sources, both man made and natural. See pie chart
The good thing about methane is that its lifetime in the atmosphere is only 10 to 15 years, and the real contribution to climate change is only 1/5th of what is commonly advertised, since iits absorption bands occur together with partly saturated absorption from water vapor. See appendix 2.
In 1980 the CH4 concentration was 1.6 ppm and will be 2.0 ppm in 2022 which results in an increase of the greenhouse effect of 0.035 C or 0.17 W/m2 ERF from rising levels of Methane since 1980.
N2O.
Atmospheric N2Olevels averaged 336 ppb (parts per billion) during 2022, about and was 301 ppb in 1980. It is a 300 times stronger greenhouse gas than CO2 by itself, because its absorption is not saturated in the atmosphere. When water vapor is dominant it is diminished by over 70% since it is at the edges of the Atmospheric window. For calculations see Appendix 3.
In 1980 the N2O concentration was 0.3 ppm which results in an increase of the greenhouse effect of 0.0065 C or 0.031 W/m2 ERF from rising levels of N2O since 1980 .
Ozone.
Ozone occurs as stratospheric O3 which is good. It protects us from uv radiation. O3 in the troposphere is considered harmful if it is over 0.08% It is normally around 0,01% in the troposphere. For calculations and figures, see appendix 4.
When the earth’s temperature rises by 0.5C, from 1980 to 2022, the amount of tropospheric O3 probably rises by 2% (Lacking good data I am guessing wildly, in urban areas it may be much more, but this is global average). This comes to 0.0034C temperature increase or 0.016 W/m2 ERF from O3, from 1980 to 2022.
CFC gasses.
CFC’s are cheap and efficient gasses to use in refrigerators and air conditioners.Their use rose rapidly until it was discovered they destroyed the protective ozone layer in the stratosphere, so its use, got banned in 1994, later diminished including its use in inhalers. CFCs has since diminished slowly and is maybe already below the levels in 1980. See also Appendix 5.
HFC gasses.
HFCs replaced CFCs and are rapidly growing in use, and the compressor seals still leak. For pictures on why they are a growing concern for the future, see Appendix 6.
The temperature increase from 1980 to 2022 was 0.0015 C or 0.007 W/m2 ERF.
The following are non greenhouse effect causes for climate change.
Clouds.
The cloud cover of the earth has decreased by 3.15% from 1980 to 2022 The total reflection from clouds and atmospheric scattering is 77 W/m2, of which 60 is from cloud reflection. A 3.15% loss of area of reflection leads to a decreasing of incoming energy of 60 * 0.0315 = 1.89 W/m2. This results in a temperature increase 0.39 C. See more at Appendix 7.
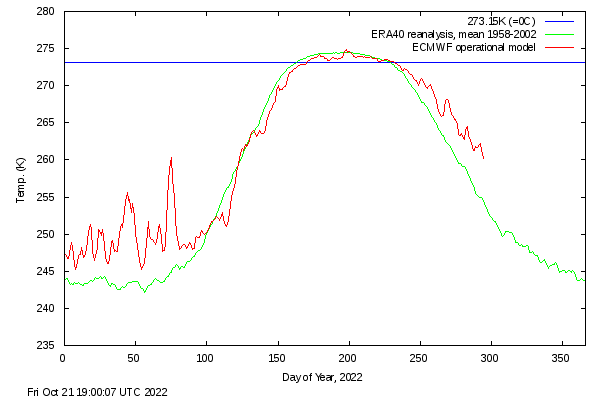
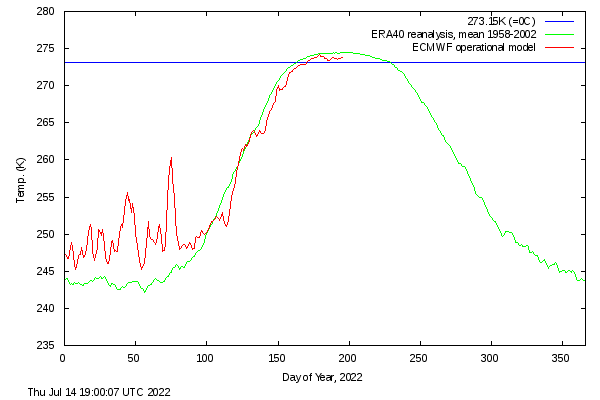
The warming of the Northern Arctic region.
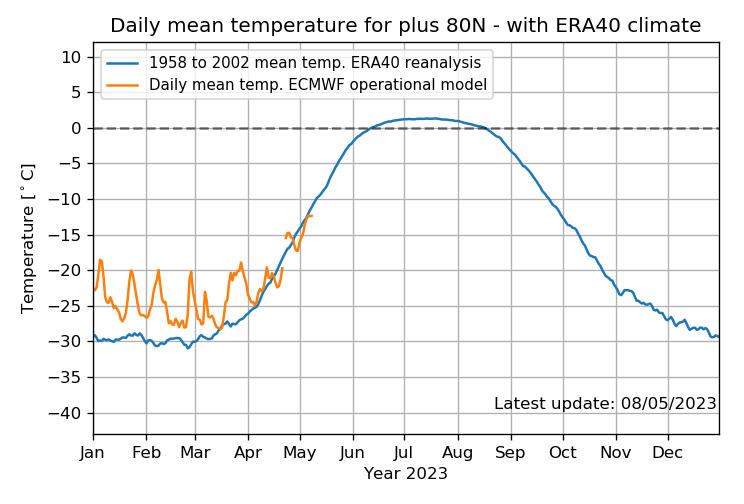
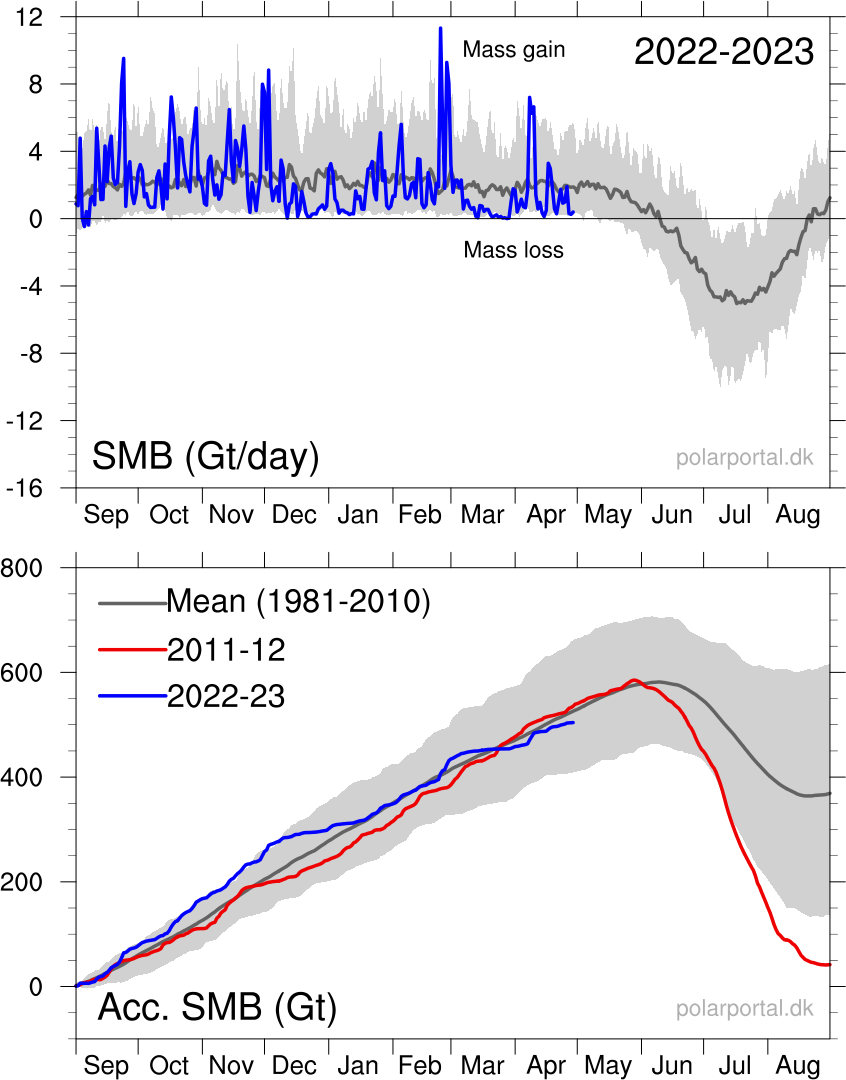
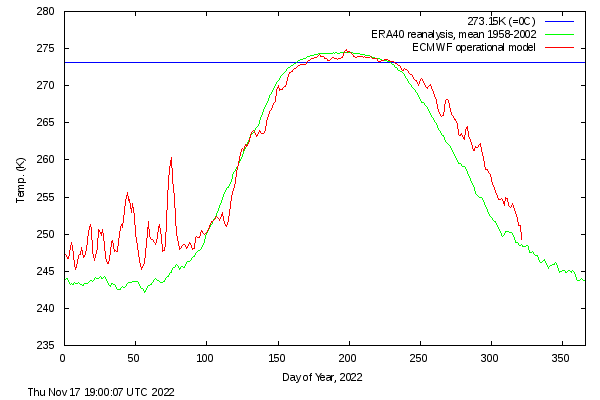
the Northern Arctic region is warming.This affects about 4% of the earth’s surface, so the total temperature increase from over-fertilizing the rivers is 0.04 * 2.5 = 0.1 C. or 0.475 W/m2. No such effect occurs in the Antarctic. To illustrate the current yearly temperature trend in the Arctic, see this current polar temperature chart: See more at Appendix 8a.
The effect of various air pollution.
If U.S is eliminating all remaining coal plants the CO2 will still be rising since China is planning to build another 1070 coal burning power plants by 2030. The effect of rising non cloud generating aerosols probably caused a temperature decrease of 0.1C or 0.5 W/m2 since 1980. The rapidly increasing air pollution led to the fear of the rapidly coming ice age in the 1970s. Discussion at Appendix 8b.
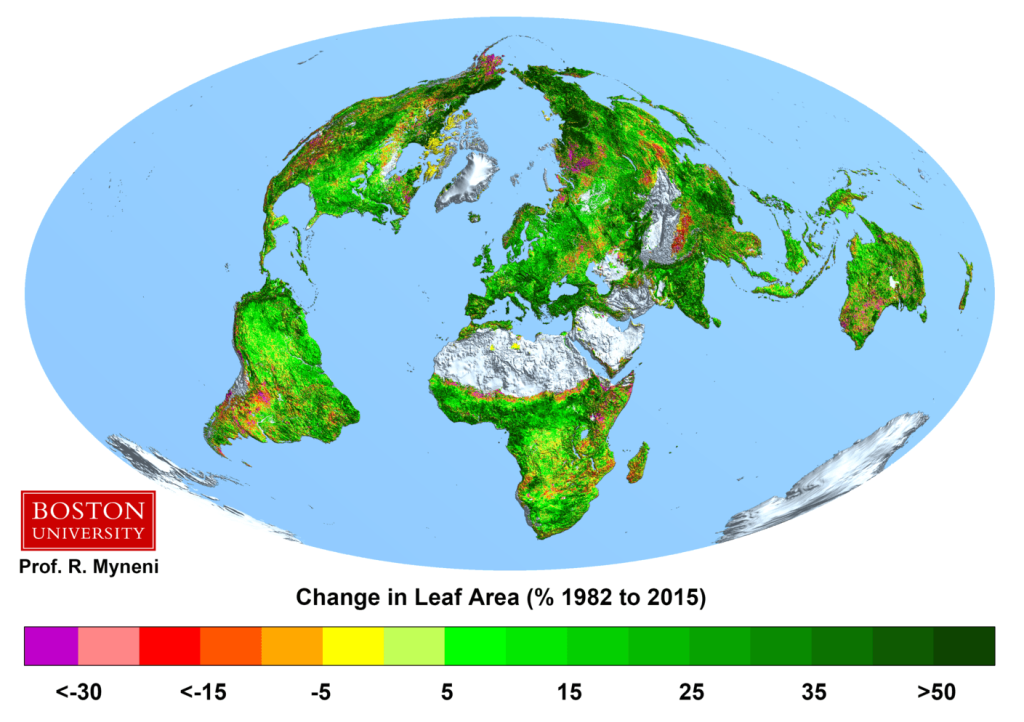
The effect of greening of most of the earth.
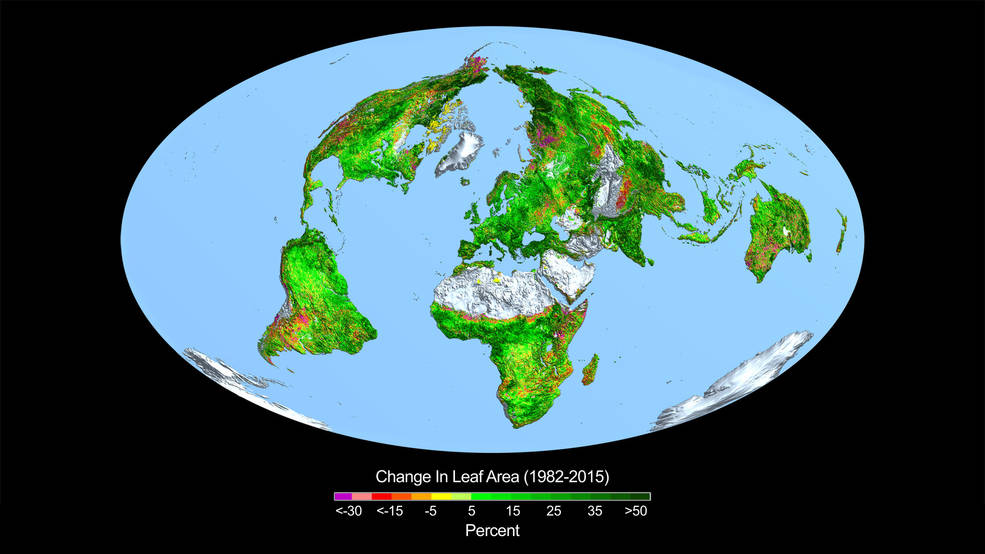
Thanks to this greening, about 15% more leaves and grass since 1982, done with only the fertilizer of CO2, the earth can now keep another 2 billion people from starvation, not to mention what good it does for plants and wildlife.
The total reflection of sunlight from the earth is 22.9 W/m2, so 0.13% of that is 0.030 W/m2,, or 0.0063 degree Celsius. See more at Appendix 8c.
The areas that are becoming more like a desert.
The area subject to desertification is about 0.6% of the world’s land area and rising the albedo by 0.05 leads to a cooling down. The average albedo of the earth is 30%, and before desertification the albedo was 25%, this rises the albedo of the earth by 0.03%. The total reflection of sunlight from the earth is 22.9 W/m2, so 0.03% of that is 0.007 W/m2, or a cool down of 0.0015 degree Celsius. See more at Appendix 8d.
Summary of all causes for climate change from 1980 until 2022:
Effect from rising CO2: 0.04C or 0.19 W/m2; 4,66% of total
Effect from increasing water vapor:0.37 Cor 1.75 W/m2; 42.9% of total
Effect from rising Methane: 0.036 C or 0.17 W/m2, 4.17% of total
Effect from rising N2O: 0.0065 C or 0.031 W/m2 0.8% of total
Effect from rising Ozone: 0.0034C or 0.016 W/m2 0.4% of total
Effect from rising HFCs : 0.0015 C or 0.007 W/m2 0.2% of total
Effect from decreasing cloud cover: 0.39 C or 1.89 W/m2. 46.4 % of total
Warming of the Northern Arctic: 0.1 C. or 0.475 W/m2;11.6% of total
Cooling from pollution aerosols: 0.1 C or 0.475W/m2; – 11.6% of total
Temperature increase from greening of the earth 0.0063C or 0.030 W/m2; 0.7% of total
Temperature decrease from areas of desertification 0.0015C 0.007 W/m2; 0.2% of total
TOTAL TEMPERATURE CHANGE 1980 to 2022: 0.8522 C or 4.077 W/m2
Appendix 1, CO2
The following chart shows both CO2 and H2O are absorbing greenhouse gases, with H20 being the stronger greenhouse gas, absorbing over a much wider spectrum, and they overlap for the most part. But it also matters in what frequency ranges they absorb.
For this we will have to look at the frequency ranges of the incoming solar radiation and the outgoing black body radiation of the earth. It is the latter that causes the greenhouse effect. Take a look at this chart:
The red area represents the observed amount of solar radiation that reaches the earth’s surface. the white area under the red line represents radiation absorbed in the atmosphere. Likewise, the blue area represents the outgoing black body radiation that is not absorbed. The remaining white area under the magenta, blue or black line represents the retained absorbed energy that causes the greenhouse effect.
Let us now take a look at the Carbon Dioxide bands of absorption, at 2.7, 4.3 and 15 μm. Of them the 2.7 and 4.3 μm bands absorb where there is little black body radiation, the only band that counts is at 14.9 μm, and that is in a band where the black body radiation is near its maximum. Let us first consider the CO2 alone in a dry atmosphere, that is one with no water vapor at all. We will investigate the concentration of 335 ppm (in 1980) and 415 ppm (in 2022)
The very top line of the top black band represents total absorption at 415 ppm, the bottom of the black black band represents absorption at 335 ppm. Divide the frequency spectrum in 3 parts, below 14 μm, 14-16 μm, and above 16 μm, In the 13 to 14 μm band 66% of available energy is absorbed at 335 ppm, 70% at 415 ppm. in the 14 to 16 μm band 100% of available energy is absorbed at both 335 and 415 ppm. In the > 16 μm the numbers are also 66 and 70%. In addition, temperature is 0.5 C higher at 415 than at 335 ppm, so available energy is 0.7 % higher at 415 ppm.
The net result is greenhouse gas contribution for CO2 is 5.10 C at 335 ppm and 5.26 C at 415 ppm and 1.5C higher ambient temperature for a dry atmosphere.
The normal way to account for greenhouse gasses contribution is to simply add together the CO2 contribution and the contribution from water vapor. This leads to the wrong result for in doing so, the total result is more than 100% for some energy band, because it is impossible to add more than 100% of all available energy for a given wavelength. Again, the spectrum of interest is 13 to 17.4 μm.
The first thing to notice is that no absorption exceeds 100% , so at 14.9 μm wavelength CO2 absorbed 100%, and water vapor absorbed another 75%, the total sum is still 100%. It is impossible to absorb more than 100% of the total energy available for that wavelength. Therefore between the wavelengths 14 and 16 μm all energy was absorbed regardless of CO2 concentration and water vapor concentration. The only fair way to allocate the absorption is proportionally, 57% to CO2 and 43% to water vapor. Likewise, the 13 to 14 μm band is not fully saturated, so the total absorption is 62% of available energy for CO2 and 33% for water vapor. In the 16 to 17.4 μm range the total absorption is 44% for CO2 and 55 % for water vapor. For CO2 at 335 ppm and average temp 13.5 C the total temperature rise, when proportionally allocated comes to 2.73 C for the CO2 and 2.30 C for the water vapor. For CO2 at 415 ppm and an average temp 0.5 C higher, at 14 C average the net temperature increase or ERF in the 13 to 17.4 μm band is 0.035C or +0.17 W/m2 for the water vapor and 0.04C or +0.19 W/m2 for the CO2.
Appendix 2, Methane
Atmospheric methanelevels averaged 2.0 ppm (parts per million) during 2022, or around 25% greater than in 1980. It is a 28 times stronger greenhouse gas by itself unlike CO2, because its absorption is not saturated in the atmosphere. On the other hand the lifetime of Methane in the atmosphere is 10 to 15 years, some of the Methane eating bacteria will do its job. There is only one significant absorption band that absorbs in the atmospheric window at 7.7 μm, at the edge of the atmospheric window.
The picture shows a small peak at 7.7μm. This is because at lower wavelengths absorption from water vapor has nearly eliminated the CH4 contribution. Remember that total absorption can never exceed 100 %, so the maximum absorption from CH4 occurs at 7.7μm. At 1.6 ppm it amounts to a greenhouse effect of 0.68 C for a dry gas.
The only major absorption line at 7.7 μm has two side lobes, at 7.5 and 7.9 μm. In the 7.5 μm sideband water vapor already absorbs nearly all energy, so the NH4 is of little effect. In the 7.9 μm sideband water vapor is 50% saturated at that level and the NH4 net absorption is 20% the net greenhouse effect is one fifth of the effect for a dry gas, or 0.14 C. In 1980 the CH4 concentration was 1.6 ppm and will be 2.0 ppm in 2022 which results in an increase of the greenhouse effect of 0.035 C or 0.17 W/m2 ERF from rising levels of Methane since 1980
Appendix 3, N2O.
Atmospheric N2Olevels averaged 336 ppb (parts per billion) during 2022, about and was 301 ppb in 1980. It is a 300 times stronger greenhouse gas than CO2 by itself, because its absorption is not saturated in the atmosphere. When water vapor is dominant it is diminished by over 70% since it is at the edges of the Atmospheric window. On the other hand the lifetime of N20 in the atmosphere is short and is typically greatest at 5 p.m. One of the major reasons for the N2O increase is the increase of fertilization with nitrates, the other is from diesel fumes from trains, boats, ships, trucks and mining equipment
The picture shows a double N2O peak at 7.4 and 7.8 μm. . At 0.336 ppm in 2022it amounts to a greenhouse effect of 0.325 C for a dry gas. In the 7.4 μm band water vapor is saturated, in the 7.8 μm band 80% is saturated by water vapor.In 1980 the N2O concentration was 0.3 ppm which results in an increase of the greenhouse effect of 0.0065 C or 0.031 W/m2 ERF from rising levels of N2O since 1980 .
N2O is commonly called laughing gas, and is hazardous in high concentrations, and should be limited in confined places, but in concentrations of under 1 ppm nobody laughs because of that.
Appendix 4, Ozone.
Ozone or 03 is good if it is in the stratosphere. There it helps to absorb the ultraviolet and cosmic rays from the sun and other cosmic radiation. Ozone is bad if it is near the ground. The total proportion of O3 in the troposphere is about 0.01 ppm, yet it is a substantial greenhouse gas because it forms by uv radiation in the stratosphere and mesosphere, and thus protecting us from uv damage. See figure:
The O3 in the troposphere on the other hand is bad. It is normally around 0.01 ppm, but is considered damaging if people are exposed to more than 0.08 ppm in an 8 hour period. This can happen in urban environments in warm and stagnant weather, typically through car traffic. It is a great greenhouse gas because its main absorption band is at 9.5 μm, right in the atmospheric window where the outgoing black body radiation is the greatest. See fig:
The dotted blue line at 9.5 μm represents the tropospheric absorption, the total absorption is between the brown and the solid blue line. The total greenhouse effect from O3 is 0.88C, but the stratosphere does not interact very much with the troposphere, so the stratospheric O3 does not count as a greenhouse gas, only tropospheric O3. The total contribution to the greenhouse effect from tropospheric O3 is about 1/5 of the total, because atmospheric O2 absorbs in the same band limits the temperature rise to 0.17C When the earth’s temperature rises by 0.5C, from 1980 to 2022, the amount of tropospheric O3 probably rises by 2% (Lacking good data I am guessing wildly, in urban areas it may be much more, but this is global average). This comes to 0.0035C temperature increase or 0.016 W/m2 ERF from O3, from 1980 to 2022.
Appendix 5, CFC gasses.
ChloroFluoroCarbon (CFC) gasses started to be manufactured at the beginning of the refrigeration age, replacing ice as the refrigerant. It soon appeared in the atmosphere, mostly due to leaks in the air conditioner compressor seals. It didn’t amount to much as a greenhouse gas even though it was five thousand times more efficient than CO2 as a greenhouse gas. It was discovered that CFCs ate up the Ozone in the stratosphere, and if it continued to increase it could deplete the protective Ozone layer faster than it could be produced. In fact it created an Ozone hole over Antarctica. So it got forbidden Jan 17, 1994, In 2020 even China stopped production. Since 1994 CFC are decreasing by about 1% per year, but cheating persisted, especially among poorer nations and China. By 2022 it will probably have a greenhouse effect of 0.01C or 0,05 W/m2 ERF.
Appendix 6, HFC gases.
CFC started to be phased out and replaced by HydroFluoroCarbons (HFC), less efficient and more expensive, but at least they do not deplete the Ozone layer that protects us from cancer. Some of the HFCs are even bigger greenhouse effect generators than CFC, but well worth it to protect the Ozone layer. Their biggest absorption bands are in the middle of the atmospheric window.
If nothing is done to control them they will increase from nothing in 1980 until 2022 and beyond. See fig: NOAA Research News
The temperature increase from 1980 to 2022 was 0.0014 C or 0.007 W/m2 ERF..
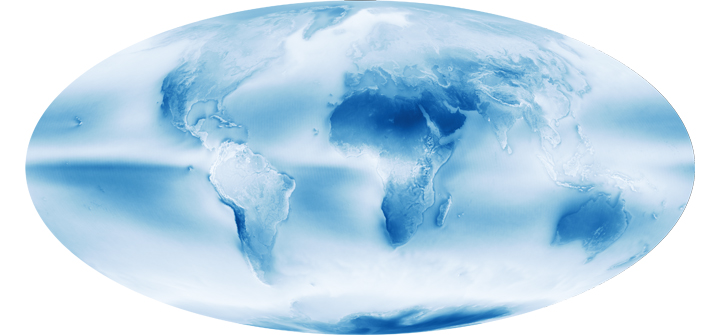
Appendix 7. The effect from decreasing cloud cover.
White = 100% cloud cover, Dark blue = o% cloud cover
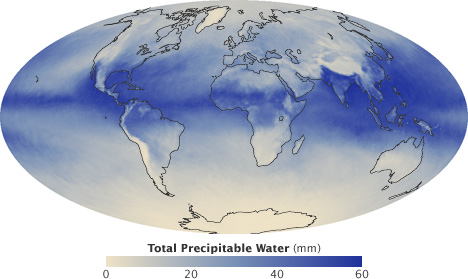
This is a world map showing the average cloud cover in August 2009. It shows the cloud free areas of the earth in blue. Another way to look at it is to see how much total water vapor there is in the atmosphere:
Nowhere on earth can it rain out more than two inches without more humidity being transported in from another place. Over the ocean humidity gets replenished by evaporation, over land only areas that has vegetation or swamps or lakes will replenish humidity by evaporation. Keep these charts in mind for later. For now concentrate on the decreasing average cloud cover. It has only been measured for the last 40 years, but here are the results:
There are many different clouds, low, mid-level and high clouds, and they have changed differently over the same time span:
Of these clouds, the low level clouds are reflecting the most, so the 2.4% loss in average cloud cover is an assumption on the low side on the loss of reflection.
In 1984 the average cloud cover was 63.7%, in 2019, 35 years later it was 61.1%, a loss of 2.6%. over 35 years or 0.075% /year. This amounts to a loss of 3.15% from 1980 to 2022 if the trend held for the extra years. The total reflection from clouds and atmospheric scattering is 77 W/m2, of which 60 is from cloud reflection. A 3.15% loss of area of reflection leads to a decreasing of incoming energy of 60 * 0.0315 = 1.89 W/m2. This results in a temperature increase 0.39 C.
Appendix 8. The effects from air and water pollution. a. The warming of the Northern Arctic region.
North America has great rivers, none greater than the mighty Mississippi. It used to be a meandering river with frequent floods that resulted in depositing its silt over large areas and thus fertilizing the land. The American Indians living by the river moved to its new location after the water receded, and they could use the newly fertilized land. After the Louisiana purchase river traffic grew rapidly, but shifting sandbars and the excessively winding river became a problem, so the Mississippi river was converted to be the main transportation artery of the middle USA, the river banks were reinforced and the course of the river straightened. This meant that more of the silt was transported out into the Mexican Gulf, some of the silt that used to fertilize the soil instead fertilized the Mexican gulf. In addition, the Mississippi river used to be very polluted, but is now clean enough that it can be used for drinking water after treatment all the way down to Louisiana. There remains elevated concentration of nitrogen compounds so the Mexican Gulf suffers from excessive algae blooms and even red tide from time to time. This leads to more cloud formation and more rain in the United States east of the 98th meridian. This also occurs in Northern Europe, especially in the North Sea; the rivers flowing into the North Sea are rich in nutrients. The Baltic Sea was near oxygen death, but after the Baltic countries and Poland joined the EU, their rivers got partially cleaned up. In the far East the Yellow Sea and the South China sea are suffering major pollution. All these regions produce more clouds, and through prevailing winds some end up in the Arctic, where they snow out, except in the Summer when they rain out except on Greenland where it snows 12 months of the year. This leads to increasing winter temperatures of about 5.5 C above the 80th latitude, 2.5 C in spring and fall and a decrease of about 0.5 C in the summer (it takes a long time to melt that extra snow). This affects about 4% of the earth’s surface, so the total temperature increase from over-fertilizing the rivers is 0.04 * 2.5 = 0.1 C. or 0.475 W/m2. No such effect occurs in the Antarctic. To illustrate the current yearly temperature trend in the Arctic, see this current polar temperature chart:
Even more illustrative is the development of ice on Greenland. In 2012 it looked like all of Greenland was going to melt in less than 1000 years, and the polar ice cap would be gone altogether in late summer of 2020. The ice over Greenland is now growing ever so slightly again:
Appendix 8b. The effect of various air pollution.
This is a picture from IPCC AR6
This are three interesting charts, trying to explain warming from anthropogenic greenhouse gasses and other pollutants such as aerosols. It is expressed as W/m2 and a 1W/m2 energy absorption results in. a 0.21C temperature rise. But the most important greenhouse gas of all, water vapor is missing from the calculations. IPCC has from the beginning omitted the influence of water vapor. it affects CO2 calculations the most, since CO2 is fully saturated in the most important range, water vapor also participates, and it is impossible to absorb more than all energy available in any given band. Methane and N2O also must be adjusted for water vapor presence. To compensate for the lack of water vapor calculations they assign a temperature runaway factor to the net result, but it depends how much each greenhouse gas is influenced by water vapors, so the net result will not be right.
The greenhouse effect rise for CO2 between 1750 and 2019 is according to IPCC AR6 is 2.16 W/m2 or 0.45C. From 1980 t0 2022 the corresponding result 1s half that, or 1.08 W/m2 or 0.23C According to my calculations the greenhouse effect from 0.035C or +0.17 W/m2 for the water vapor and 0.04C or +0.19 W/m2 for the CO2. For CH4 the same calculations yield 0.5 W/m2 or 0.105 C from IPCC6, and 0.26 W/m2 or 0.055 C plus 0.22 W/m2 or 0.05C from water vapor. This means the real climate sensitivity for CO2 is only 33% of what is given in IPCC AR6. For CH4 the real climate sensitivity is 20% of what is given in IPCC AR6
The major effect from air pollution is that it generates aerosols that act as condensation points for cloud formation if the air is oversaturated with moisture. In the last 40 years the air has gotten cleaner in the industrial west, not so in China, India and Africa. The net result was a 3.15 % drop in cloud cover and the resulting temperature rise is already accounted for. There are no good worldwide analyses of ancient cloud cover, but air pollution was rising rapidly until the clean air act, enacted in 1963 was beginning to show results in the 70’s. However, ancient method of heating with coal, wood, peat and dried cowdung was far more polluting and harmful to your lungs. If U.S is eliminating all remaining coal plants the CO2 will still be rising since China is planning to build another 1070 coal burning power. The effect of rising non cloud generating aerosols probably caused a temperature decrease of 0.1C or 0.5 W/m2 since 1980. The rapidly increasing air pollution led to the fear of the rapidly coming ice age in the 1970s.
Appendix 8c. The effect of greening of most of the earth.
There is one great benefit of increased CO2, the greening of the earth.
Thanks to this greening, about 15% more leaves and grass since 1982, done with only the fertilizer of CO2, the earth can now keep another 2 billion people from starvation, not to mention what good it does for plants and wildlife.
The greening of the earth will cause a temperature to increase, thanks to the lowering of the albedo of green leaves and grass rather than desert sand. In addition, with rising CO2 levels the leaves need less water to perform the photosynthesis, so the net result from lowering the albedo by 15% of 0.05 over 17% of the world leads to a warming of the earth. The average albedo on land is 30%, and 17% of the earth lowers the albedo by 15% of 0.05 this lowers the total albedo of the earth by 0.13%.
The total reflection of sunlight from the earth is 22.9 W/m2, so 0.13% of that is 0.030 W/m2,, or 0.0063 degree Celsius.
Appendix 8d. The areas that are becoming more like a desert.
Most of the earth displays an increase of leaf area, but there are areas in red that are becoming less green. The areas are: The American Southwest, The Pampas area of South America, a 100 mile band in Southern Sahara, part of East Africa, Madagascar, South East Africa, Western Australia, Part of the Volga region, Kazakhstan east of Lake Aral and various parts of China, and the Mekong river. These areas have this in common, the aquifers ate being depleted, the rivers are diminishing and some of them no longer reach the ocean, lakes are almost disappearing, but people still move to those areas “for the good climate”.
The areas so affected are about 900,000 sq miles of the American Southwest and about 3 million square miles total to suffer from becoming more like a desert. The common theme of all these areas is depletion of the aquifers, rivers diminishing, lakes drying up and soil erosion.
The only part of the world US can control directly is The American Southwest. It can expect more frequent and longer droughts, since there is no amplification of clouds from the relatively cool and clean Pacific ocean, and the long term temperature trend is cooling. The Colorado River no longer feeds the Gulf of California with nourishment. The Colorado river used to all the water allocation for all the participating states, but around 2000 the water use had caught up with supply, and since then it has become much worse with demand far outstripping supply.
In addition the Great Salt Lake is now less than a third of the size it was in the 1970’s. A second level water shortage has been issued and for example Arizona will get a million Acre-feet lass per year from the river. The aquifers will be further depleted leading to less rainfall and the few remaining springs will dry out. If nothing is done, the American southwest will become desertified.
Ironically, deserts have a higher albedo than green soil, so letting the American Southwest become a desert would have a cooling effect by the increasing albedo, but the effect from the disappearing clouds would have a far greater heating effect, so letting the American Southwest become a desert is not a solution to the problem.
However, the area subject to desertification is about 0.6% of the world’s land area and rising the albedo by 0.05 leads to a cooling down. The average albedo of the earth is 30%, and before desertification the albedo was 25%, this rises the albedo of the earth by 0.03%. The total reflection of sunlight from the earth is 22.9 W/m2, so 0.03% of that is 0.007 W/m2, or a cool down of 0.00015 degree Celsius.
The 6th IPCC assessment report still suffers from the same fatal flaw that was in the first assessment report regarding greenhouse gases. It assumes greenhouse gases are additive, when in fact it is impossible to absorb more than all energy emitted for any given energy band! With that obvious fact in mind I will present the real greenhouse effect and its rise from 1775 to 2050. Nitrogen concentration staying constant, Oxygen concentration staying constant, Water vapor increasing 10% assuming relative humidity staying constant and average temperature increasing 1.5 C, CO2 rising from 280 ppm to 460 ppm, Methane from 0.725 ppm to 1.9 ppm, N2O from 0.27 ppm to 0.32 ppm, Ozone holding steady, since I do not have any worldwide concentration trends for it, and finally the man-made greenhouse gasses CFCs and HFCs.
The real temperature increase from 1776 to 2050 from greenhouse gases increase.
The greenhouse effect of Nitrogen.
Nitrogen is the most abundant gas in the atmosphere, consisting of 75 to 77% of all the air dependent on humidity. It has a small absorption band at 4.29 micrometer and another way out in the far infrared region where earth emission is negligible In the 4.29 range water vapor absorption is about 90% of available energy, and we only include the 2.2% increase coming from the 1.5 C temperature increase, so the net greenhouse effect is 0.11 * 0,1 * 0,022 w/m2, or about 0.0002 W/m2, not enough to care about.
The greenhouse effect of Oxygen.
Oxygen is the second most abundant gas with a concentration of about 21% in the atmosphere, but unlike Nitrogen it has a strong absorption band right in the middle of the atmospheric window. see picture:
The greenhouse effect of the Oxygen band at 9.4 micrometer is 1.2 C and the increase in greenhouse effect when temperature rises 1.5 C is 0.026 C in the tropics and 0.003 C at the poles due to their lower water content.
The greenhouse effect of Argon.
Argon is nearly 1% of the atmosphere, bur since it is a noble gas and absorbs in lines rather than bands, and there are no strong absorption lines in the infrared region it is not a factor.
The greenhouse effect of water vapor.
During the little ice age the earth was significantly colder than today, but there was special factors that led to this: The Maunder solar minimum and two super novas, one discovered in 1572 by Tycho Brave and the other in 1604 by Kepler.
I will begin the time of industrialization with the invention of the steam engine 1775 by James Watt. While not the original inventor he improved it so much that it became in common use for power generation. Up to that time people had depended on water and wind power and in a few cases tidal power. This increased the use of coal, which up to that point had been used exclusively for heating.
Since 1775 the global temperature of the earth has increased by about 1.2 C and is expected to increase another 0.3C by 2050.
When global temperature increases 1.5 degrees and relative humidity stays the same there will be 10% more water vapor in the air. How much of the temperature rise is attributable to a 10% increase in water vapor?
To answer that we must take a look at the greenhouse effect. Without it the earth would be an ice ball with an average temperature about 33C cooler than today. The earth can be considered a black body that obeys laws for black body radiation, the Stefan–Boltzmann law that states that the total energy radiation is proportional to the fourth power of the absolute temperature (Kelvin), so an increase in global temp from 13C t0 14.5C results in an increase of 2.11% in the total greenhouse effect.
To sum it up: Since water vapor is fundamental I will count it first, and the effect of all the other greenhouse gases will be included later, remembering that the total absorption in any frequency band can never exceed 100% of available energy. The increase of absorption occurs in the atmospheric window, Together, they make up 90% of the greenhouse gas temperature rise, or 29.7 degree C. When global temperatures increase by 1,5 C there will be 10% more water water vapor assuming relative humidity will stay constant, there will be an additional 0.65 C temperature rise.
The greenhouse effect of CO2.
The following chart shows both CO2 and H2O are absorbing greenhouse gases, with H20 being the stronger greenhouse gas, absorbing over a much wider spectrum, and they overlap for the most part. But it also matters in what frequency ranges they absorb.
For this we will have to look at the frequency ranges of the incoming solar radiation and the outgoing black body radiation of the earth. It is the latter that causes the greenhouse effect. Take a look at this chart:
The red area represents the observed amount of solar radiation that reaches the earth’s surface. the white area under the red line represents radiation absorbed in the atmosphere. Likewise, the blue area represents the outgoing black body radiation that is not absorbed. The remaining white area under the magenta, blue or black line represents the retained absorbed energy that causes the greenhouse effect.
Let us now take a look at the Carbon Dioxide bands of absorption, at 2.7, 4.3 and 15 μm. Of them the 2.7 and 4.3 μm bands absorb where there is little black body radiation, the only band that counts is at 14.9 μm, and that is in a band where the black body radiation is near its maximum. Let us first consider the CO2 alone in a dry atmosphere, that is one with no water vapor at all. We will investigate the concentration of 280 ppm (in 1775) and 460 ppm (in 2050)
The very top line of the top black band represents total absorption at 460 ppm, the bottom of the black black band represents absorption at 280 ppm. Divide the frequency spectrum in 3 parts, below 14 μm, 14-16 μm, and above 16 μm, In the 13 to 14 μm band 65% of available energy is absorbed at 280 ppm, 71% at 460 ppm. in the 14 to 16 μm band 100% of available energy is absorbed at both 280 and 460 ppm. In the > 16 μm the numbers are also 65 and 71%. In addition, temperature is 1.5 C higher at 460 than at 280 ppm, so available energy is 2.2 % higher at 460 ppm.
The net result is greenhouse gas contribution for CO2 is 5.0 C at 280 ppm and 5.34 C at 460 ppm and 1.5C higher ambient temperature for a dry atmosphere.
The normal way to account for greenhouse gasses contribution is to simply add together the CO2 contribution and the contribution from water vapor. This leads to the wrong result for in doing so, the total result is more than 100% for some energy band, because it is impossible to add more than 100% of all available energy for a given wavelength. Again, the spectrum of interest is 13 to 17.4 μm.
The first thing to notice is that no absorption exceeds 100% , so at 14.9 μm wavelength CO2 absorbed 100%, and water vapor absorbed another 75%, the total sum is still 100%. It is impossible to absorb more than 100% of the total energy available for that wavelength. Therefore between the wavelengths 14 and 16 μm all energy was absorbed regardless of CO2 concentration and water vapor concentration. The only fair way to allocate the absorption is proportionally, 57% to CO2 and 43% to water vapor. Likewise, the 13 to 14 μm band is not fully saturated, so the total absorption is 62% of available energy for CO2 and 33% for water vapor. In the 16 to 17.4 μm range the total absorption is 44% for CO2 and 55 % for water vapor. For CO2 at 280 ppm and average temp 13C the total temperature rise, when proportionally allocated comes to 2.73 C for the CO2 and 2.30 C for the water vapor. For CO2 ar 460 ppm and an average temp 1.5 C higher, at 14.5 C average the net temperature increase in the 13 to 17.4 μm band is 0.11C for the water vapor and also 0.11C for the CO2.
The greenhouse effect of Methane.
Atmospheric methanelevels averaged 1,895.7 ppb (parts per billion) during 2021, or around 162% greater than at pre-industrial levels. It is a 28 times stronger greenhouse gas by itself unlike CO2, because its absorption is not saturated in the atmosphere. On the other hand the lifetime of Methane in the atmosphere is 10 to 15 years, some of the Methane eating bacteria will do its job. There is only one significant absorption band that absorbs in the black body emission spectrum, at 7.7 μm.
The picture shows a small peak at 7.7μm. This is because at lower wavelengths absorption from water vapor has nearly eliminated the CH4 contribution. Remember that total absorption can never exceed 100 %, so the maximum absorption from CH4 occurs at 7.7μm. At 1.8 ppm it amounts to a greenhouse effect of 0.80 C for a dry gas.
The only major absorption line at 7.7 μm has two side lobes, at 7.5 and 7.9 μm. In the 7.5 μm sideband water vapor already absorbs nearly all energy, so the NH4 is of little effect. In the 7.9 μm sideband water vapor is 60% saturated at that level and the NH4 net absorption is 20% the net greenhouse effect is one sixth of the effect for a dry gas, or 0.13 C. Before industrialization the CH4 concentration was 0.725 ppm and will be 2.13 ppm in 2050 which results in an increase of the greenhouse effect of 0.1C from rising levels of Methane since 1775.
The greenhouse effect of N2O.
Atmospheric N2Olevels averaged 310 ppb (parts per billion) during 2021, about 19 % greater than at pre-industrial levels. It is a 300 times stronger greenhouse gas than CO2 by itself, because its absorption is not saturated in the atmosphere. When water vapor is dominant it is diminished by over 70% since it is at the edges of the Atmospheric window. On the other hand the lifetime of N20 in the atmosphere is short and is typically greatest at 5 p.m. One of the major reasons for the N2O increase is the increase of fertilization with nitrates, the other is from diesel fumes from trains, boats, ships, trucks and mining equipment
The picture shows a double N2O peak at 7.4 and 7.8 μm. . At 0.32 ppm in 2050 it amounts to a greenhouse effect of 0.31 C for a dry gas. In the 7.4 μm band water vapor is saturated, in the 7.8 μm band 80% is saturated by water vapor.Before industrialization the N2O concentration was 0.27 ppm which results in an increase of the greenhouse effect of 0.005 C from rising levels of N2O since before industrialization .
N2O is commonly called laughing gas, and is hazardous in high concentrations, and should be limited in confined places, but in concentrations of under 1 ppm nobody laughs because of that.
The greenhouse effect of Ozone.
Ozone or 03 is good if it is in the stratosphere. There it helps to absorb the ultraviolet and cosmic rays from the sun and other cosmic radiation. Ozone is bad if it is near the ground. The total proportion of O3 in the troposphere is about 0.01 ppm, yet it is a substantial greenhouse gas because it forms by uv radiation in the stratosphere and mesosphere, and thus protecting us from uv damage. See figure:
The O3 in the troposphere on the other hand is bad. It is normally around 0.01 ppm, but is considered damaging if people are exposed to more than 0.08 ppm in an 8 hour period. This can happen in urban environments in warm and stagnant weather, typically through car traffic. It is a great greenhouse gas because its main absorption band is at 9.5 μm, right in the atmospheric window where the outgoing black body radiation is the greatest. See fig:
The dotted blue line at 9.5 microns represents the tropospheric absorption, the total absorption is between the brown and the solid blue line. The total greenhouse effect from O3 is 0.88C, but the stratosphere does not interact very much with the troposphere, so the stratospheric O3 does not count as a greenhouse gas, only tropospheric O3. The total contribution to the greenhouse effect from tropospheric O3 is about 1/6 of the total, or 0.15C. When the earth’s temperature rises by 1.5C, from pre-industrial times to 2050, the amount of tropospheric O3 probably rises by 3% (Lacking good data I am guessing wildly, in urban areas it may be much more, but this is global average). This comes to 0.005C temperature increase from O3, from pre-industrial times until 2050.
The greenhouse effect of CFC gasses.
ChloroFluoroCarbon (CFC) gasses started to be manufactured at the beginning of the refrigeration age, replacing ice as the refrigerant. It soon appeared in the atmosphere, mostly due to leaks in the air conditioner compressor seals. It didn’t amount to much as a greenhouse gas even though it was five thousand times more efficient than CO2 as a greenhouse gas. It was discovered that CFCs ate up the Ozone in the stratosphere, and if it continued to increase it could deplete the protective Ozone layer faster than it could be produced. In fact it created an Ozone hole over Antarctica. So it got forbidden. Since then CFC are decreasing by about 1% per year, but there is still cheating, especially among poorer nations and China. By 2050 it will probably have a greenhouse effect of 0.01C
The greenhouse effect of HFC gasses.
CFC started to be phased out and replaced by HydroFluoroCarbons (HFC), less efficient and more expensive, but at least they do not deplete the Ozone layer that protects us from cancer. Some of the HFCs are even bigger greenhouse effect generators than CFC, but well worth it to protect the Ozone layer. If e dont do anything they will increase drastically from now until 2050. See fig: NOAA Research News
If we assume worst case scenario; no control measures, the temperature increase will be 0.06 C by 2050.
Summary of greenhouse gases, their size in 1775 and increase until 2050.
Gas,………………temperature……Increase 1775 – 2950. ………………………..contribution C
N2…………………0………………………………….0
O2………………….0.026………………………….0.003
Argon……………0…………………………………0
Water vapor..29.4………………………………0.65
CO2………………2.73……………………………..0.11
CH4……………..0.16………………………………0.10
N2O……………..0.03……………………………….0.005
O3……………….0.15……………………………….0.005
CFC………………..0……………………………………….0.01
HFC……………….0……………………………………….0.06
Total ……..….32.496……………………………..0.916
The CO2 contribution to the greenhouse effect increase is less than 12% of the greenhouse effect. Even if the multiplier effect from water vapor is included it is less than 24%.
The 6th IPCC assessment report still suffers from the same fatal flaw that was in the first assessment report regarding greenhouse gases. It assumes greenhouse gases are additive, when in fact it is impossible to absorb more than all energy emitted for any given energy band! With that obvious fact in mind I will present the real greenhouse effect and its rise from 1775 to 2050. Nitrogen concentration staying constant, Oxygen concentration staying constant, Water vapor increasing 10% assuming relative humidity staying constant and average temperature increasing 1.5 C, CO2 rising from 280 ppm to 460 ppm, Methane from 0.725 ppm to 1.9 ppm, N2O from 0.27 ppm to 0.32 ppm, and finally Ozone holding steady, since I do not have any worldwide concentration trends for it.
The real temperature increase from 1776 to 2050 from greenhouse gases increase.
The greenhouse effect of Nitrogen.
Nitrogen is the most abundant gas in the atmosphere, consisting of 75 to 77% of all the air dependent on humidity. It has a small absorption band at 4.29 micrometer and another way out in the far infrared region where earth emission is negligible In the 4.29 range water vapor absorption is about 90% of available energy, and we only include the 2.2% increase coming from the 1.5 C temperature increase, so the net greenhouse effect is 0.11 * 0,1 * 0,022 w/m2, or about 0.0002 W/m2, not enough to care about.
The greenhouse effect of Oxygen.
Oxygen is the second most abundant gas with a concentration of about 21% in the atmosphere, but unlike Nitrogen it has a strong absorption band right in the middle of the atmospheric window. see picture:
The greenhouse effect of the Oxygen band at 9.4 micrometer is 1.2 C and the increase in greenhouse effect when temperature rises 1.5 C is 0.026 C in the tropics and 0.003 C at the poles due to their lower water content.
The greenhouse effect of Argon.
Argon is nearly 1% of the atmosphere, bur since it is a noble gas and absorbs in lines rather than bands, and there are no strong absorption lines in the infrared region it is not a factor.
The greenhouse effect of water vapor.
During the little ice age the earth was significantly colder than today, but there was special factors that led to this: The Maunder solar minimum and two super novas, one discovered in 1572 by Tycho Brave and the other in 1604 by Kepler.
I will begin the time of industrialization with the invention of the steam engine 1775 by James Watt. While not the original inventor he improved it so much that it became in common use for power generation. Up to that time people had depended on water and wind power and in a few cases tidal power. This increased the use of coal, which up to that point had been used exclusively for heating.
Since 1775 the global temperature of the earth has increased by about 1.2 C and is expected to increase another 0.3C by 2050.
When global temperature increases 1.5 degrees and relative humidity stays the same there will be 10% more water vapor in the air. How much of the temperature rise is attributable to a 10% increase in water vapor?
To answer that we must take a look at the greenhouse effect. Without it the earth would be an ice ball with an average temperature about 33C cooler than today. The earth can be considered a black body that obeys laws for black body radiation, the Stefan–Boltzmann law that states that the total energy radiation is proportional to the fourth power of the absolute temperature (Kelvin), so an increase in global temp from 13C t0 14.5C results in an increase of 2.11% in the total greenhouse effect.
To sum it up: Since water vapor is fundamental I will count it first, and the effect of all the other greenhouse gases will be included later, remembering that the total absorption in any frequency band can never exceed 100% of available energy. The increase of absorption occurs in the atmospheric window, Together, they make up 90% of the greenhouse gas temperature rise, or 29.7 degree C. When global temperatures increase by 1,5 C there will be 10% more water water vapor assuming relative humidity will stay constant, there will be an additional 0.65 C temperature rise.
The greenhouse effect of CO2.
The following chart shows both CO2 and H2O are absorbing greenhouse gases, with H20 being the stronger greenhouse gas, absorbing over a much wider spectrum, and they overlap for the most part. But it also matters in what frequency ranges they absorb.
For this we will have to look at the frequency ranges of the incoming solar radiation and the outgoing black body radiation of the earth. It is the latter that causes the greenhouse effect. Take a look at this chart:
The red area represents the observed amount of solar radiation that reaches the earth’s surface. the white area under the red line represents radiation absorbed in the atmosphere. Likewise, the blue area represents the outgoing black body radiation that is not absorbed. The remaining white area under the magenta, blue or black line represents the retained absorbed energy that causes the greenhouse effect.
Let us now take a look at the Carbon Dioxide bands of absorption, at 2.7, 4.3 and 15 μm. Of them the 2.7 and 4.3 μm bands absorb where there is little black body radiation, the only band that counts is at 14.9 μm, and that is in a band where the black body radiation is near its maximum. Let us first consider the CO2 alone in a dry atmosphere, that is one with no water vapor at all. We will investigate the concentration of 280 ppm (in 1775) and 460 ppm (in 2050)
The very top line of the top black band represents total absorption at 460 ppm, the bottom of the black black band represents absorption at 280 ppm. Divide the frequency spectrum in 3 parts, below 14 μm, 14-16 μm, and above 16 μm, In the 13 to 14 μm band 65% of available energy is absorbed at 280 ppm, 71% at 460 ppm. in the 14 to 16 μm band 100% of available energy is absorbed at both 280 and 460 ppm. In the > 16 μm the numbers are also 65 and 71%. In addition, temperature is 1.5 C higher at 460 than at 280 ppm, so available energy is 2.2 % higher at 460 ppm.
The net result is greenhouse gas contribution for CO2 is 5.0 C at 280 ppm and 5.34 C at 460 ppm and 1.5C higher ambient temperature for a dry atmosphere.
The normal way to account for greenhouse gasses contribution is to simply add together the CO2 contribution and the contribution from water vapor. This leads to the wrong result for in doing so, the total result is more than 100% for some energy band, because it is impossible to add more than 100% of all available energy for a given wavelength. Again, the spectrum of interest is 13 to 17.4 μm.
The first thing to notice is that no absorption exceeds 100% , so at 14.9 μm wavelength CO2 absorbed 100%, and water vapor absorbed another 75%, the total sum is still 100%. It is impossible to absorb more than 100% of the total energy available for that wavelength. Therefore between the wavelengths 14 and 16 μm all energy was absorbed regardless of CO2 concentration and water vapor concentration. The only fair way to allocate the absorption is proportionally, 57% to CO2 and 43% to water vapor. Likewise, the 13 to 14 μm band is not fully saturated, so the total absorption is 62% of available energy for CO2 and 33% for water vapor. In the 16 to 17.4 μm range the total absorption is 44% for CO2 and 55 % for water vapor. For CO2 at 280 ppm and average temp 13C the total temperature rise, when proportionally allocated comes to 2.73 C for the CO2 and 2.30 C for the water vapor. For CO2 ar 460 ppm and an average temp 1.5 C higher, at 14.5 C average the net temperature increase in the 13 to 17.4 μm band is 0.11C for the water vapor and also 0.11C for the CO2.
The greenhouse effect of Methane.
Atmospheric methanelevels averaged 1,895.7 ppb (parts per billion) during 2021, or around 162% greater than at pre-industrial levels. It is a 28 times stronger greenhouse gas by itself unlike CO2, because its absorption is not saturated in the atmosphere. On the other hand the lifetime of Methane in the atmosphere is 10 to 15 years, some of the Methane eating bacteria will do its job. There is only one significant absorption band that absorbs in the black body emission spectrum, at 7.7 μm.
The picture shows a small peak at 7.7μm. This is because at lower wavelengths absorption from water vapor has nearly eliminated the CH4 contribution. Remember that total absorption can never exceed 100 %, so the maximum absorption from CH4 occurs at 7.7μm. At 1.8 ppm it amounts to a greenhouse effect of 0.97 C for a dry gas. Becausewater vapor is 40% saturated at that level the net greenhouse effect is 058 C. Before industrialization the CH4 concentration was 0.725 ppm which results in an increase of the greenhouse effect of 0.35 C from rising levels of Methane since 1775.
The greenhouse effect of N2O.
Atmospheric N2Olevels averaged 310 ppb (parts per billion) during 2021, about 19 % greater than at pre-industrial levels. It is a 300 times stronger greenhouse gas than CO2 by itself, because its absorption is not saturated in the atmosphere. When water vapor is dominant it is diminished by over 70% since it is at the edges of the Atmospheric window. On the other hand the lifetime of N20 in the atmosphere is short and is typically greatest at 5 p.m. One of the major reasons for the N2O increase is the increase of fertilization with nitrates, the other is from diesel fumes from trains, boats, ships, trucks and mining equipment
The picture shows a double N2O peak at 7.4 and 7.8 μm. . At 0.32 ppm in 2050 it amounts to a greenhouse effect of 0.31 C. Before industrialization the N2O concentration was 0.27 ppm which results in an increase of the greenhouse effect of 0.05 C from rising levels of N2O since before industrialization .
N2O is commonly called laughing gas, and is hazardous in high concentrations, and should be limited in confined places, but in concentrations of under 1 ppm nobody laughs because of that.
The greenhouse effect of Ozone.
Ozone or 03 is good if it is in the stratosphere. There it helps to absorb the ultraviolet and cosmic rays from the sun and other cosmic radiation. Ozone is bad if it is near the ground. The total proportion of O3 in the troposphere is about 0.01 ppm, yet it is a substantial greenhouse gas because it forms by uv radiation in the stratosphere and mesosphere, and thus protecting us from uv damage. See figure:
The O3 in the troposphere on the other hand is bad. It is normally around 0.01 ppm, but is considered damaging if people are exposed to more than 0.08 ppm in an 8 hour period. This can happen in urban environments in warm and stagnant weather, typically through car traffic. It is a great greenhouse gas because its main absorption band is at 9.5 μm, right in the atmospheric window where the outgoing black body radiation is the greatest. See fig:
The dotted blue line at 9.5 microns represents the tropospheric absorption, the total absorption is between the brown and the solid blue line. The total greenhouse effect from O3 is 0.88C, but the stratosphere does not interact very much with the troposphere, so the stratospheric O3 does not count as a greenhouse gas, only tropospheric O3. The total contribution to the greenhouse effect from tropospheric O3 is about 1/6 of the total, or 0.15C. When the earth’s temperature rises by 1.5C, from pre-industrial times to 2050, the amount of tropospheric O3 probably rises by 3% (Lacking good data I am guessing wildly, in urban areas it may be much more, but this is global average). This comes to 0.005C temperature increase from O3, from pre-industrial times until 2050.
Summary of greenhouse gases, their size in 1775 and increase until 2050.
Gas,……………….temp contribution C Increase 1775 – 2950.
N2…………………0………………………………….0
O2………………….0.026………………………….0.003
Argon……………0…………………………………0
Water vapor.29.7………………………………0.65
CO2………………2.73……………………………..0.11
CH4……………..0.57………………………………0.35
N20……………..0.31……………………………….0.05
O3……………….0.15……………………………….0.005
Total ……….32.973……………………………..1.168
The CO2 contribution to the greenhouse effect increase is less than 10% of the greenhouse effect. Even if the multiplier effect from water vapor is included it is less than 20%.
6 – 18 November 2022, the Government of the Arab Republic of Egypt was hosting the 27th Conference of the Parties of the UNFCCC (COP 27), with a view to building on previous successes and paving the way for future ambition to effectively tackle the global challenge of climate change.
According to alarmists’ climate change models, joining the Paris accord will decrease global temperatures by 0.05 to 0.17 degrees Celsius by the year 2100, or a catastrophe too big to fathom will occur. See the official chart below!
I want to reply to what climate alarmists say: My conclusions on climate change are not in line with political science logic. Being a climate realist, I never said that increasing CO2 is unimportant, only that the negative effects are vastly exaggerated, and the positive effects are ignored. Let me explain:
Climate alarmists and IPCC AR5 believe that the thermal response to increasing CO2 has a feedback gain from increasing water vapor that results from higher temperatures, leading to much higher temperatures. Current climate model averages indicate a temperature rise of 4.7 C by 2100 if nothing is done, 4.65 C if U.S keeps all its Paris commitments and 4.53 C if all countries keep their part of the agreement. In all cases, with or without Paris agreement we are headed for a disaster of biblical proportions.
As the chart indicates, implementing all of the Paris agreement will delay the end of mankind as we know it by at most 4 years.
Myself and quite a few scientists, meteorologists, but mostly engineers believe the feedback loop in nature is far more complicated than that, in fact, there is a large negative feedback in the system, preventing a temperature runaway, and we have the observations to prove it. The negative feedback manifests itself in 2 ways:
Inorganic feedback, represented by greenhouse gases and clouds. If there were no clouds, the tropics would average a temperature of 140 F thanks to the greenhouse effect. The clouds reflect back up to 300 W/m2 into space rather than the same energy being absorbed into water, air or soil. Clouds are highly temperature dependent, especially cumulus and cumulonimbus clouds. Cumulus clouds are formed in the morning, earlier the warmer and more humid it is, and not formed at all if it is cold and dry, thunderstorms appear when it is warm enough. The feedback, which is positive at low temperatures becomes negative at warmer temperatures, and in the equatorial doldrums, surface temperature has found its equilibrium. No amount of CO2 will change that. Equatorial temperature follows the temperature of the ocean, warmer when there is an el niño, cooler when there is a la niña. Here is a chart of temperature increases since satellite measurements began as a function of latitude.
The tropics follow the ocean temperature closely, no long term rising trend, the extratropics are also stable.
In the Arctic there is a rising temperature trend, up to 5C in the winter, less so in spring and fall, but a slightly cooling trend in the summer.
If this trend continues, all Arctic ocean ice may melt in 300 to 400 years, faster if there is further warming and nothing else is changing. Let’s take a look at the Arctic above the 80th latitude, an area of about 3,85 million square kilometers, less than 1% of the earth’s surface, but it is there where global warming is most pronounced. This chart from Nov 17, 2022 shows this trend.
Take a look at ice accumulation on Greenland.
What happened? Last year it snowed more than normal. In the Arctic, it gets warmer under clouds, warmer still when it snows. Take a look at Greenland and what has happened this freezing season. It has snowed and snowed and Greenland has so far, nearly three months into the accumulation season accumulated 60 Gigatons more ice than normal. So, at this point in the season we are a total of 80 Gt ahead of last year, and this is with Arctic temperatures this fall being five degrees warmer than normal. The counterintuitive conclusion is that it may very well be that warmer temperatures produces more accumulation of snow and ice, colder temperatures with less snow accumulate less. What happens during the short Arctic summer? With more snow and ice accumulated it takes longer to melt last years snow and ice, so the temperature stays colder longer. If this melting period ends without melting all snow and ice, multi year ice will accumulate, and if it continues unabated, the next ice age will start.
The second feedback loop is organic. More CO2 means more plant growth. According to NASA (2015) there has been a significant greening of the earth, more than 15% since satellite measurements begun. This results in a warming effect everywhere, except in areas that are drying out, where there is a cooling trend. The net effect is that we can now feed 2 billion more people than before without using more fertilizer. Check this picture from NASA, showing the increased leaf area extends over 90 % of the land area.
There are two major ways of trying to predict future temperature trends. UN IPCC uses models to predict. They look like this:
This model refers to the atmosphere between 30,000 and 38,000 feet altitude, a height where water vapor is low, so CO2 is the dominant greenhouse factor. As we can see, the models are off by a factor of 4 in average temperature rise. This is because all IPCC models suffer from a fatal flaw: they assume that the factors are additive, but it is impossible to absorb more than 100% of all the energy available in one particular wavelength, for instance, if CO2 absorbs 100% of all energy available in the 14 to 16 micrometer band, and water vapor absorbs 60% in the same band, the sum is not 160%. It is still 100%.
Abetter way to estimate temperature trends is to treat the earth as a black body with sunlight warming the earth and the same amount of energy escaping through black body radiation. If there were no greenhouse gases the equilibrium temperature would be 255 K (-18 C or 0F) according to Stefan-Boltzmann law, which states that the total radiant heat power emitted from a surface is proportional to the fourth power of its absolute temperature. But thanks to water vapor and CO2 and some other minor gases we can now enjoy a comfortable average temperature of 13.9C, up from 12.7C average temperature around 1700, just as the little ice age ended and industrialization started in earnest.
Using the black box approach and assuming equilibrium temperature at all times this method fits much better with measurements, for details, see here. The total changes in temperature when CO2 rose from 280 ppm to 400 ppm, lower cloud cover decreased 2% and leaf area on earth rose 15%.
Direct effect from rising CO2: 0.17C
Secondary effect from increasing water vapor from rising CO2: 0.05C
Effect from rising Methane: less than 0.01C
Effect from N20 and Ozone: less than 0.01C
Temperature rise from decreasing cloud cover by2%, from 64% to 62%: 0.67C
Secondary effect from increasing water vapor from temperature rise from decreasing clouds: 0.17C
Temperature increase from greening of the earth 0.12C
Temperature decrease from areas of desertification 0.0005C
TOTAL TEMPERATURE RISE: 1.2C which is equal to the measured rise from 12.7C to 13.9C.
The big question is: What will the equilibrium temperature be in 2050 if we do nothing to limit CO2 and other greenhouse gases?
Direct effect from rising CO2 levels from 400 ppm to 490 ppm: 0.10C
Secondary effect from increasing water vapor from increasing CO2: 0.03 C
Temperature rise from decreasing cloud cover another 1/2% 0.16C
Secondary effect from increasing water vapor from temperature rise from decreasing clouds: 0.04C
Temperature increase from greening of the earth another 10%: 0.07C
Temperature decrease from areas of desertification 0.0005C
TOTAL TEMPERATURE RISE: 1.6C, 0.13C of which is when CO2 rises from 400 to 490 ppm, 0.20 C from when cloud coverage decreases by 1/2% and 0.07 C from 10% more leaf area from the greening of the earth.
According to COP27 the carbon reduction pledges by 2050 looks like this:
The sum of all pledges means a 15% reduction in the RISE of C02 between now and 2050, leading to a reduction in temperature rise from rising CO2 of 0.02C. In addition it will reduce the amount of temperature rise from the greening of the world by 0.006 C. the total temperature rise will be 1.574C or thereabout, still over the 1.5C target.
There is a better way.
The temperature rise since per-industrial times is caused by basically 3 factors: Greenhouse gases and water vapor increase: 23%, decreased reflection from decreased cloud cover: 65%, and decreased albedo due to the greening of the earth: 12%.
There are some disturbing trends in rain patterns around the world. This fall the four largest rivers for barge traffic all have severe limitations in their barge traffic volume due to low water, the Mississippi river in North America, the Rhine River in Europe, the Yang Tse Kiang River in Asia and the Parana River in South America. It seems to be world-wide. At the same time snowfall is increasing in the Arctic, leading to warmer winters and a little cooling in the summer since there is more snow to melt. Areas of the world is being desertified, lakes are drying up, aquifers are being depleted, and so some areas are drying up. These are the same areas where people love to live and use its water. The Great Salt Lake in Utah is down to a third of the size it had in the 1970’s, Lake Aral is nearly all gone, The Caspian Sea is again shrinking and Lake Chad in Africa is down to 20% of its size in the 1970’s.
Most of the earth displays an increase of leaf area, but there are areas in red that are becoming less green. The areas are: The American Southwest, The Pampas area of South America, a 100 mile band in Southern Sahara, part of East Africa, Madagascar, South East Africa, Western Australia, Part of the Volga region, Kazakhstan east of Lake Aral and various parts of China, and the Mekong river. These areas have this in common, the aquifers ate being depleted, the rivers are diminishing and some of them no longer reach the ocean, lakes are almost disappearing, but people still move to those areas “for the good climate”.
The areas so affected are about 900,000 sq miles of the American Southwest and about 3 million square miles in total to suffer from becoming more like a desert. The common theme of all these areas is depletion of the aquifers, rivers diminishing, lakes drying up and soil erosion.
The only part of the world US can control directly is The American Southwest. It can expect more frequent and longer droughts, since there is no amplification of clouds from the relatively cool and clean Pacific ocean, and the long term temperature trend is cooling. The Colorado River no longer feeds the Gulf of California with nourishment. The Colorado river used to supply all the water allocation for all the participating states, but around 2000 the water use had caught up with supply, and since then it has become much worse with demand far outstripping supply.
In addition the Great Salt Lake is now less than a third of the size it was in the 1970’s. A second level water shortage has been issued and for example Arizona will get a million Acre-feet lass per year than promised from the Colorado river. The aquifers will be further depleted leading to less rainfall and the few remaining springs will dry out. If nothing is done, the American southwest will become desertified.
Ironically, deserts have a higher albedo than green soil, so letting the American Southwest become a desert would have a cooling effect by the increasing albedo, but the effect from the disappearing clouds would have a far greater heating effect, so letting the American Southwest become a desert is not a solution to the problem.
However, the area subject to desertification is about 0.6% of the world’s land area and rising the albedo by 0.05 leads to a cooling down. The average albedo of the earth is 30%, and before desertification the albedo was 25%, this rises the albedo of the earth by 0.03%. The total reflection of sunlight from the earth is 22.9 W/m2, so 0.03% of that is 0.007 W/m2, which translates to a net temperature decrease of the world by 0.002C.
What congress is doing to solve the problem.
Congress has passed the anti-inflation bill that included over 300 billion to fight climate change, and it included more solar panels and wind turbine motors to be imported from China. The experience from Europe is that electricity from solar panels and windmills is 5.7 times as expensive as conventional power generation.
This analysis was done for 2019, before COVID. The situation is now much worse, with electricity rares up to 40 c/kWh, and that is with subsidies.
Even at the current increased European Gas prices, the estimated excess expenditures on Weather-Dependent “Renewables” in Europe is still very large: $~0.5 trillion in capital expenditures and $~1.2 trillion excess expenditures in the long-term.
These simple calculations show that any claim that Wind and Solar power are now cost competitive with conventional fossil fuel (Gas-fired) generation are patently false. The figures give an outline of the financial achievements of Green activists in stopping fracking for gas in Europe, close on to $1.2 trillion of excess costs.
It would be better not to import any solar panels and wind power generators from China and let them pay for the extra cost rather than building more coal burning plants. After all they were planning to build over a thousand new plants between now and 2030, all legal under the Paris accord. This would benefit the world climate much more, since Chinese coal plants are far more polluting, since China has far less stringent environmental regulations than U.S.
U.S. uses 13.5% of the world’s coal, and eliminating U.S. CO2 emissions would in time reduce the world temperature by 0.026C, providing no other country, such as China and India would increase their use of Coal, which they are; to the total of 1300 new coal plants between now and 2030. This would raise global temperature by more than 0.06 C.
What congress should do instead.
a. What congress should do immediately.
Immediately stop downblending U 233 and pass The Thorium Energy security act SB 4242a. See more here.
2. Remove Thorium from the list of nuclear source material. The half-life of Thorium232 is 14 billion years, so its radioactivity is barely above background noise. More importantly, while Thorium is fertile, it is not fissile and should therefore not be included in the list. This would make it far easier to mine rare earth metals, as long as the ore consists of less than 0.05% Uranium, but any amount of Thorium is allowed without classifying the ore “Source material”.
3. Separate nuclear power into 3 categories. a. conventional nuclear power. b. Thorium breeder reactors that make more U233 than it consumes, and c. Thorium reactors that reduce nuclear waste.
4. Stop buying solar panels from China. Stop buying wind turbine generators from China. Let them install those in China and pay 5 times as much for their electricity.
5. Immediately form a commission led by competent people, not politicians; to decide how to best expand the electric grid and to best harden it against electro-magnetic pulses, whether solar or nuclear and to safeguard it against sabotage.
6. Remove all subsidies on electric cars, solar panels and wind generators, but continue to encourage energy conservation.
7. Encourage research and development of Thorium fueled reactors, especially liquid salt reactors by drastically simplifying and speeding up the approval process. President Trump issued an executive order in the last month of his presidency EO 13972 specifying that the United States must sustain its ability to meet the energy requirements for its national defense and space exploration initiatives. The ability to use small modular reactors will help maintain and advance United States dominance and strategic leadership across the space and terrestrial domains. This EO should be expanded to include civilian small modular reactors, including Liquid salt Thorium reactors less than 200 MW, which are the only valid reactors for space exploration.
b. Longer term developments, but extremely urgent.
Of the long term warming of the globe of 1.2 C since the beginning of industrialization only 0.17 C is attributable to rising CO2, NH4 and NO2 levels, of which United states is currently responsible for 13.5% and decreasing, or 0.023C. The disappearance of clouds is responsible for twice as much globally or 0.33 C of which probably 1/6 is occurring in the American Southwest, causing an increase in temperature of 0.055C. However, the temperature rise in say the Grand Canyon has been in excess of 2 C,, and in the urban areas it has been even more. These are my long term suggestions:
Build a TransContinental Aqueduct. A realistic way to save Lake Mead and reverse the desertification of the American SouthWest.
The problem:
Lake Mead will be emptied in less than 10 years with the current usage pattern. Then what?
The hydroelectric power from Lake Mead (and Lake Powell) is diminishing as the lakes are emptied. The so called winter pool level is nearing, after which no further power can be generated.
The aquifers in Arizona, especially in the Phoenix and Tucson area, and to some extent New Mexico and the dry part of Texas are being drawn down and are at risk of being exhausted.
The Salton Sea in the Imperial Valley of California is maybe the most polluted lake in all of U.S.A. It is even dangerous to breathe the air around it sometimes. The area contains maybe the largest Lithium deposit in the world.
The Colorado River water is too salty for good irrigation .
The Colorado river no longer reaches the Gulf of California. Fishing and shrimp harvesting around the Colorado River Delta is no more.in less than 10 years with the current usage pattern. Then what?
The hydroelectric power from Lake Mead (and Lake Powell) is diminishing as the lakes are emptied.
40 million people depend on the Colorado River for drinking water. The population is still rising rapidly in the West. Will they have water in the future.
Except for California there is not much pumped Hydro-power storage in the American Southwest.
Texas has plenty of wind power, but no pumped hydro-power storage. This makes it difficult to provide peak power when the sun doesn’t shine and the wind doesn’t blow. Nuclear power is of no help, it provides base power only. Peak power has to come from coal and natural gas plants.
New Mexico has some ideal spots for solar panels, but no water is available for pumped storage.
Arizona has a surging population, wind and solar power locations are abundant, but no pumped hydro-power storage.
Arkansas and Oklahoma have a good barge traffic system. This proposal will increase flood control and improve barge traffic by increasing the maximum barge draft from 9 feet to 12 feet and during dry periods reverse the flow of the Arkansas River. The Arkansas river yearly water flow is nearly double that of the Colorado River.
The solution:
Build a transcontinental aqueduct from the Mississippi River to the Colorado River capable of transporting 12 million acre-ft of water yearly through Arkansas, Oklahoma, Texas, New Mexico and Arizona. It will be built similar to the Central Arizona Project aqueduct, supplying water from the Colorado river to the Phoenix and Tucson area, but this aqueduct will be carrying four times more water over four times the distance and raise the water nearly twice as high before returning to near sea level. The original Central Arizona Project cost $4.7 billion in 1980’s money, the Transcontinental Aqueduct will in Phase 1 cost around $200 Billion in 2022 money applying simple scaling up principles.
The Mississippi River has a bad reputation for having polluted water, but since the clean water act the water quality has improved drastically. Fecal coli-form bacteria is down by a factor of more than 100, the water is now used all the way down to New Orleans for drinking water after treatment. The lead levels are down by a factor of 1000 or more since 1979. Plastic pollution and pharmaceutical pollution is still a problem, as is the case with most rivers. The Ph is back to around 8 and salt content is negligible. Mississippi water is good for irrigation, and usable for drinking water after treatment. The Arkansas River is used as a drinking water source.
But the aqueduct will do more than provide sweet Mississippi water to the thirsty South-west, it will make possible to provide peak power to Texas, New Mexico and Arizona. In fact, it is so big it will nearly triple the pumped Hydro-power storage for the nation, from 23 GW for 5 hours a day to up to 66 GW when fully built out.
The extra pumped hydro-power storage will come from a number of dams built as part of the aqueduct or adjacent to it. The water will be pumped from surplus wind and solar power generators when available. This will provide up to 50 GW of power for 5 hours a day. If not enough extra power has been generated during the 19 pumping hours, sometimes power will be purchased from the regular grid. The other source of pumped hydro-power storage is virtual. There will be up to 23 GW of LFTR (Liquid Fluoride salt Thorium Rector) power stations strategically stationed along the waterway providing pumping of water for 19 hours and providing virtual hydro-power output for the remaining 5, when the aqueduct is fully built.
These 43 GW of hydro-power capacity will be as follows: Oklahoma, 0.2 GW; Texas, 18,5 GW (right now, Texas has no hydro-power storage, but plenty of wind power); New Mexico, 10.5 GW; Arizona 13.6 GW. In Addition, when the Transcontinental Aqueduct is fully built out, the Hoover dam can provide a true 2.2 GW hydro-power storage by pumping water back from Lake Mojave; a 3 billion dollar existing proposal is waiting to be realized once Lake Mead is saved.
The amount of installed hydroelectric power storage is:
Most hydroelectric pumped storage was installed in the 70’s. Now natural gas plants provide most of the peak power. This aqueduct will more than double, triple the U.S. pumped peak storage if virtual peak storage is included. By being pumped from surplus wind and solar energy as well as nuclear energy it is true “Green power”. Some people like that.
What follows is a description of each leg of the aqueduct. Each leg except legs 9 and 10 ends in a dam, which holds enough water to make each leg free to operate to best use of available electricity and provide peak power on demand.
The Transcontinental Aqueduct will serve the Lower Colorado River Basin, Southern New Mexico and Western Texas. It will pump up to 12 million acre-ft of water annually from the Arkansas river and Mississippi river all the way to southern Colorado River.
The total electricity needed to accomplish this giant endeavor is about 60 billion kWh annually. or about one and a half percent of the current US electricity demand. In 2020 the US produced 1,586 billion kWh from natural gas, 956 from coal, 337.5 from wind and 90.9 from solar.
For this giant project to have any chance of success there has to be something in it to be gained from every state that will be participating. Here are some of the benefits:
Arizona: Arizona needs more water. The water from Mississippi is less saline and better suited for agriculture and the people growth makes it necessary to provide more water sources. Right now the aquifers are being depleted. Then what? One example: The San Carlos lake is nearly dry half the time and almost never filled to capacity. With the aqueduct supplying water it can be filled to 80 +- 20% of full capacity all the time. In the event of a very large snow melt the lake level can be reduced in advance to accommodate the extra flow. Likewise during Monsoon season the aqueduct flow can be reduced in anticipation of large rain events. Arizona together with New Mexico has the best locations for solar power, but is lacking the water necessary for hydro-power storage. This proposal will give 600 cfs of water to Tucson, 3,100 cfs to the Phoenix area and 3,900 cfs to the lower Colorado River in Phase 1. I phase 2 it will add 3,100 cfs to Lake Havasu and an extra 4,700 cfs to the lower Colorado River. It will also also add 28 GW of hydro-power storage capable of adding 140 GWh of electric peak power daily when it is fully built out in Phase 3.
Arkansas: The main benefit for Arkansas is better flood control and river control of the Arkansas River and allowing it to deepen the draft for canal barges from 9,5 feet to 12 feet, which is standard on the Mississippi river.
California: The water aqueduct serving Los Angeles will be allowed to use maximum capacity at all times. Additional water resources will be given the greater San Diego area. The Imperial valley will be given sweet Mississippi and Arkansas River water, which will improve agriculture yield. The polluted New River will be cut off at the Mexico border. There will be water allocated to the Salton Sea. There is a proposal to mine the world’s largest Lithium ore, mining the deep brine, rich in Lithium. (about a third of the world supply according to one estimate). This requires water, and as a minimum requirement to allow mining in the Salton Sea the water needs to be cleaned. This requires further investigation, but the area around the Salton Sea is maybe the most unhealthy in the United States. It used to be a great vacation spot.
Mexico: During the negotiations about who was going to get the water in Lake Mead Mexico did not get enough water, so they have been using all remaining water for irrigation, and no water is reaching the ocean anymore. In addition the water is too salty for ideal irrigation. This proposal will provide sweet Mississippi and Arkansas River water to Mexico, ensure that some water reaches the Colorado river delta. This will restore the important ecology and restore aquatic life in the delta and the gulf. The town of Mexicali will get some water in exchange for shutting off New River completely.
Nevada: Las Vegas is a catastrophe waiting to happen unless Lake Mead is saved. With this proposal there will be ample opportunity to make the desert bloom.
New Mexico: The state is ideally suited for solar panels. In addition to give much needed water to communities along the length of the aqueduct, it will provide 13.5 GW of pumped storage power to be made available at peak power usage for up to 5 hours a day.
Oklahoma: The main advantage for Oklahoma is a much improved flood control. It will provide the same advantage for river barge traffic as benefits Arkansas.
Texas: The state has a big problem. It has already built up too much wind power and can not give up their coal burning power plants until the electricity is better balanced. They have no hydro-electric power storage at all, and we saw the result of that in a previous year’s cold snap. This proposal will give the Texas electric grid 8.8 GW of hydro-electric power for up to 5 hours a day.
Utah: The state will no longer be bound to provide water to Lake Mead, but can use all of its water rights for Utah, especially the Salt Lake City region, and to reverse the decline of the Great Salt Lake that is now shrunk to less than a third of the size it had in the 1970’s.
Wyoming: The state will be free to use the water in the Green River and all the yearly allocated 1.05 million acre-feet of water can be used by the state of Wyoming.
The cost to do all these aqueducts will be substantial, but it can be done for less than 350 billion dollars in 2022 money, and that includes the cost of providing power generation. Considering it involves 40 million people dependent on the Colorado River now and another 10 million east of the Rocky Mountains, it is well worth doing, much more important to do than other “green” projects, since it will save the American Southwest from becoming an uninhabitable desert.
This proposed solution cannot be made possible without changing our approach to power generation. The mantra now is to solve all our power needs through renewables. Texas has shown us that too much wind power without any hydroelectric power storage can lead to disaster. In addition, windmills kill birds, even threatening some species, such as the Golden Eagle and other large raptors that like to build their aeries on top of the generators. Solar panels work best in arid, sunny climate, such as Arizona and New Mexico, but the panels need cooling and cleaning to work best, and that takes water. They are even more dependent on hydro-power storage than wind. The transcontinental aqueduct will triple the hydro-electric power storage for the nation. Without pumped power storage we still need all the conventional power generation capacity for when the sun doesn’t shine and the wind doesn’t blow.
Conventional Nuclear power plants doesn’t work in most places since they depend on water for their cooling, and most of these aqueducts pump water in near deserts, and there would be too much evaporation losses to use water from the aqueducts for cooling.
The only realistic approach would be to use LFTR power plants. (Liquid Fluoride Thorium Reactors). There are many advantages for using LFTR. Here are 30 reasons why LFTRs is by far the best choice.
For this project to succeed there must be developed a better way to build SMRs (Small Modular Reactors, less than 250 MW) more effectively. The price to build a LFTR plant should be less than $2.50 per watt. While the LFTR science is well understood, the LFTR engineering is not fully developed yet, but will be ready in less than 5 years if we get to it. In the mean time there should be built one or more assembly plants that can mass produce LFTR reactor vessels small enough so they can be shipped on a normal flatbed trailer through the normal highway system. My contention is that a 100 MW reactor vessel can be built this way and the total cost per plant will be less than 250 Million dollars. To save the American Southwest we will need about 350 of them, or 87,5 billion dollars total. This cost is included in the total calculation. There will be many more of these plants produced to produce all the electric power to power all the electric vehicles that are going to be built. This is the way to reduce fossil fuel consumption. Just switching to electric vehicles will not do the trick. The electric energy must come from somewhere. To convert all cars and trucks and with unchanging driving habits will require another 600 GW of generating capacity by 2050, our present “net zero emissions” goal.
To do this project we need cooperation from all states in providing eminent domain access. The Federal government will need to approve LFTR as the preferred Nuclear process and streamline approval process from many years to less than one year.
Some of the power will come from solar panels and wind turbines, which will reduce the need for LFTR’s. One tantalizing idea is to cover the aqueduct with solar panels. This will do many things, it will not take up additional acreage, water needed to keep the panels clean is readily available, and can even be used to cool the solar panels if economically beneficial. The area available is 152 feet times 1100 miles = 1.6 billion square feet, and one square foot of solar panel produces around 1 W, which means covering the aqueduct with solar panels would produce 882 MW of power. It would also reduce evaporation. The second source of energy will be 165,000 5kW vertical wind turbines producing 825 MW when the wind is blowing. The rest of the power will cme from LFTRs. This idea requires further analysis. Here is one possible implementation of the idea:
C. Further developments to save the American Southwest.
When the Transcontinental aqueduct is well under way it is time to start the Trans-Rocky-Mountain Aqueduct. in a few years the population growth will require again to save Lake Powell and Lake Mead, and rejuvenate the American South-west.
The problem:
Lake Powell and Lake Mead will be emptied in less than 10 years with the current usage pattern. Then what?
The hydroelectric power from Lake Mead (and Lake Powell) is diminishing as the lakes are emptied.
the aquifers are drawn down everywhere in the Southwest, but also the Ogallala Aquifer in Colorado and Kansas, and are at risk of being exhausted.
The Colorado River water is too salty for good irrigation .
The Colorado river no longer reaches the Gulf of California. Fishing and shrimp harvesting around the Colorado River Delta is no more.
40 million people depend on the Colorado River for drinking water. The population is still rising rapidly in the West. Will they have water in the future? Think 20 million future population growth in the next 40 years, people want to move there even with the current water problems.
The solution:
Build a Trans-Rocky-Mountain aqueduct from the Mississippi River to the San Juan River. In the first 391 miles the aqueduct joins the McClellan–Kerr Arkansas River Navigation System by adding the capability of pumping 7,500 cfs of water through 16 dams that service the locks. This will lead to reversing the flow of water during low flow. This also facilitates the navigation channel to be deepened from 9 feet to 12 feet to service fully loaded barges, a step authorized but not funded by Congress. The Arkansas river will then be capable of transporting 8 million acre-ft of water yearly through Arkansas, Oklahoma, Kansas, Colorado and New Mexico, supplying water from the Colorado river to Lake Powell. All that is needed to do in this stage is provide the dams and locks with a number of pumps and pump/generators to accommodate this, at a cost of less than 2 billion dollars. The next phase is pumping up water in the Arkansas river for 185 miles. To accommodate this there will be 17 small control dams built that are closed when normal pumping occurs and open during flood conditions. The cost for this segment, including pumps will be less than 3 billion dollars. The third segment is a 465 mile aqueduct to cross the Rocky Mountains much like the Central Arizona project but this aqueduct will carry three times more water 1.27 times the distance and raise the water four times higher. The original Central Arizona Project cost $4.7 billion in 1980’s money, the aqueduct part of the Trans-Rocky-Mountain aqueduct will cost around $50 Billion in 2021 money applying simple scaling up principles.
Power requirements for the 3 stages are 310 MW for the canal stage, 600MW for the river stage and 6.2 GW for the aqueduct stage. The aqueduct stage can be controlled by the power companies to shut off the pumps and provide 6.4 GW of virtual peak power for up to 5 hours a day on average, and each leg can be controlled individually since they are separated by large dams. There will be 64 one hundred MegaWatt LFTR (Liquid Fluoride salt Thorium Rector) power stations strategically stationed along the waterway providing pumping of water for 19 hours and providing virtual hydro-power output for on average 5 hours. There will also be 910 MW of power needed that is controlled by the river authorities.
The building cost of providing LFTR power should be around $2.50 per Watt of installed energy if a plant is built to manufacture via an assembly line a standardized version of 100 MW LFTR reactor core vessels assemblies capable of being transported on truck to the installation point. The total power cost should then be 16 billion dollars to build, and 5 cents per kWh or about 2.5 billion dollars a year to provide power.
The Mississippi River has a bad reputation for having polluted water, but since the clean water act the water quality has improved drastically. Fecal coli-form bacteria is down by a factor of more than 100, the water is now used all the way down to New Orleans for drinking water after treatment. The lead levels are down by a factor of 1000 or more since 1979. Plastic pollution and pharmaceutical pollution is still a problem, as is the case with most rivers. The Ph is back to around 8 and salt content is negligible. Mississippi water is good for irrigation, and usable for drinking water after treatment. The Arkansas River water quality is pretty good, good enough in Kaw Lake to be used for municipal water supply. Nitrates and phosphates are lower than in most Eastern rivers, Ph is around 8 and coli-bacteria low.
Most hydroelectric pumped storage was installed in the 70’s. Now natural gas plants provide most of the peak power. This aqueduct will add 6.4 GW to the U.S. pumped peak storage if virtual peak storage is included. By being pumped from surplus wind and solar energy as well as nuclear energy it is true “Green power”. Some people like that.
What follows is a description of each leg of the aqueduct. Legs 3, 4, 5 and 6 ends in a dam, which holds enough water to make each leg free to operate to best use of available electricity and provide peak power on demand.
Leg 1 of The Trans-Rocky-Mountain aqueduct. From the Mississippi river to Webbers Falls lock and dam. Total length 15miles of aqueduct and 335 miles of river. Cost of water 333 kWh per acre-ft.
Leg 2 of The Trans-Rocky-Mountain aqueduct. From Webbers Falls to Keystone Dam, a distance of about 75 miles that is river and 25 miles, which is canal. Cost of water 593 kWh per acre-ft.
Leg 3 of the Trans-Rocky-Mountain aqueduct. From Keystone Dam to Kaw Dam.The Keystone Lake is 38 miles long and the river part is about 110 miles. Cost of water 901 kWh per acre-ft.
Leg 4 of the Trans-Rocky-Mountain aqueduct. From Kaw Lake to John Martin Reservoir, a distance of about 200 miles. Cost of water 4,446 kWh per acre-ft.
Leg 5 of the Trans-Rocky-Mountain aqueduct. From John Martin Reservoir to Trinidad Lake, a distance of about 120 miles. Cost of water 7,300 kWh per acre-ft.
Leg 6 of the Trans-Rocky-Mountain aqueduct. From Trinidad Lake to Abiquiu Reservoir, a distance of 90 miles. Cost of water 7,910 kWh per acre-ft.
Leg 7 of the Trans-Rocky-Mountain aqueduct. From the Abiquiu Reservoir to the San Juan River, a distance of 55 miles. Cost of water 7,395 kWh per acre-ft.
Once these two aquifers are completed and running successfully filling the rivers again it is time to refill the aquifers. This requires a change in the water rights laws. The rain water is a property of the land and can be locally retained via small catch basins and ditches. This will restore the aquifers, reduce soil erosion and rejuvenate vegetation as has been successfully done in the dry parts of India. They needed to capture the monsoon rains, and so does Arizona and New Mexico.
One more thing:
Build aSouth Platte River aqueduct. This will solve the water needs for the greater Denver ares and help preserve the northern Ogallala aquifer.
The rise in CO2 is on balance positive, it has already helped to keep 2 billion people from starvation. With food famine coming the very worst thing we can do is declare a climate emergency and unilaterally reduce our electric supply eliminating much of our fossil fuel source to produce electricity and at the same time push electric cars.
This cannot be solved unless there will be a deep commitment to Nuclear power, streamline government permit processes and let private industry find the best solutions without government playing favorites and slowing down the process. Regular U235 power is not sufficient for this, Only Thorium power will do, and there are many reasons for it. Here are 30 of them:
My favorite Thorium power plant would be a 100 MW Liquid Fluoride Thorium Reactor (LFTR). It is also called a Small Modular Reactor (SMR). It is small enough that all core elements will fit in three standard truck containers and be made on an assembly line. It can be constructed many ways, one is a normal fast breeder reactor, another is adapted to burn nuclear waste. The cost for these reactors, when built on an assembly line will be less than $2 per Watt. They can be placed anywhere, since they are inherently safe, no need for an evacuation zone. Since they are operating at 500C temperature with either gas or liquid lead as heat transfer media there is no need for water as a cooling medium. When mass produced it will be able to produce electricity at 5 c per kWh and the mining to produce the materials is a fraction of what is needed for solar, and wind power, especially when taking into account the intermittent nature of these power sources.The only thing better would be fusion power, but that is at least 20 years away as a power producing source, but it is coming. These are exciting times!
The Earth has warmed 1.1 to 1.2 degree Celsius since the little ice age, coinciding with the beginning of the industrial age and the rate of increase increase is increasing. To better understand how much of this warming is due to greenhouse gases look at this chart:
From this chart we can see that water vapor is by far the most important greenhouse gas, followed by CO2 with Methane and Nitrous oxide far behind. Oxygen is part of the atmosphere, and so is Nitrogen and their concentrations are assumed to be constant. Ozone concentration is too small to have any effect. Raleigh scattering is why the sky is blue and it is constant regardless of other factors.
Before we go any further let’s examine one absorption band for CO2, the 14,9 μm band. at a concentration of 400 ppm it is fully saturated from 14 to 16 μm and tapers off from there, see picture:
The black band shows the difference in total absorption from CO2 concentration of 280 ppm to 400 ppm.
The white area under the shaded area is the absorption at 280 ppm. The shaded area is the additional absorption at 400 ppm, an increase of 6%. The reason it is not more is that it is impossible to absorb more than 100% of the total energy available for that wavelength. Therefore between the wavelengths 14 and 16 microns all energy was absorbed regardless of CO2 concentration.
. But the top chart is deceiving, for it does not fully explain the net effect on radiation, from the sun or from the earth. The chart below is much better:
The incoming solar radiation includes ultraviolet radiation, visible light and near infrared radiation. This is all the heat incoming to the earth, except the heat that is radiating from the earth’s core. All area under the curves of the right halves represent greenhouse gases absorption, except the blue area which represents energy radiated into space under a cloud-free sky. The all dominant geenhouse gas is water vapor but CO2 contributes with 2 absorption bands, at 4.3 microns and 14.9 microns. The 4.3 micron absorption is of almost no importance since it occurs at a wavelength where very little radiation is available, neither from the sun, nor from the earth’s blackbody radiation, but water vapor absorbs nearly all radiation anyhow. The only wavelength that counts for CO2 absorption is at 14.9 microns, because it occurs in the so called atmospheric window and the blackbody radiation is near its maximum.
Let us take a closer look at the outgoing blackbody radiation and the atmospheric window:
The first thing to notice is that no absorption exceeds 100% , so at 14.9 micron wavelength CO2 absorbed 100%, and water vapor absorbed another 80%, the total sum is still 100%. It is impossible to absorb more than 100% of the total energy available for that wavelength. Therefore between the wavelengths 14 and 16 microns all energy was absorbed regardless of CO2 concentration and water vapor concentration. The olive area represents the extra absorption of CO2 at 280 ppm when the water vapor is taken out (you cannot absorb more than 100%). The small yellow slivers represent the extra CO2 absorption at 400 ppm. The white area between the brown total absorption area and the red earth emission line is the total emitted energy through the atmospheric window. Methane and N2O gas greenhouse absorption occur at wavelengths where water vapor already absorbs nearly 100%, so their contribution to greenhouse gases is negligible. Likewise Ozone absorption occurs where O2 also absorbs. From the picture below (thanks, NASA) we can see that the total amount of energy escaping through the atmospheric window from clouds and from the ground is on average (29.9 + 40.1) = 70 W/m2. In pre-industrial times the value would have been around 70.7 w/m2.
NASA update 9 August 2019
NASA has made a good estimate of the earth’s energy budget. Total incoming energy is 340.4 W/m2 and escaping through the atmospheric window is 70 W/m2, or 20.56%. Before the industrial age the value was about 70.7 W/m2 or 20.77%, an increase of 0.24%. A black body radiation is proportional to the fourth power of absolute temperature (Kelvin). The current average temp on earth is 287 degree Kelvin, so the temperature rise since pre-industrial times from the sum of increasing CO2, Methane, Nitrous oxide and ozone is 287 * fourth root of (1-0.0024) = 286.83 K, or 0.17 degree Celsius less.
This is but a small portion of the temperature rise experienced, and it so happens that there exists a good measuring point, where the all dominant greenhouse gases are CO2, Methane, NO2 and O3. At the South Pole in the winter the air is clean, there is almost no water vapor and the winter temperature at the Amundsen–Scott South Pole Station between April and September 2021, a frigid minus-78 degrees (minus-61 Celsius), was the coldest on record, dating back to 1957, and the trend is 1 C colder per century. In the summer the trend is increasing temperatures.
In the rest of the world the dominant greenhouse gas is water vapor, H20 and is responsible for most of of the greenhouse effect, and some of it can be attributed to the warming caused by increasing CO2 levels that warmed the world 0,17C, and if the relative humidity stays the same this leads to an increase in water vapor of about 1 % on average. The increase of absorption occurs in the atmospheric window, and in some bands of the incoming sunlight in the near infrared region. The bands are 0.7, 0.8, 0.9, 1.1, 1.4 and 1.9 μm. Together, when water vapor increases by 1% on average the total absorption of water vapor increases by 0.2 W/m2, mostly by shrinking the atmospheric window. This amounts to 0.06% 0f the total incoming solar radiation. The current average temp on earth is 287 degree Kelvin, so the temperature rise since pre-industrial times from increasing H2O levels is 287 * fourth root of (1-0.0006) = 286.95 K, or 0.05 degree Celsius less.
The temperature increase from increased greenhouse gases total only 20% of the temperature increase since pre-industrial times, so something else must have caused the increase, and the answer lies in looking to the skies. Water vapor is a condensing gas, and when water vapor is saturated and there are enough aerosols (air pollution) in the air clouds will appear. How much can be attributed to changing cloud patterns?
2. The effect from decreasing cloud cover.
White = 100% cloud cover, Dark blue = o% cloud cover
This is a world map showing the average cloud cover in August 2009. It shows the cloud free areas of the earth in blue. Another way to look at it is to see how much total water vapor there is in the atmosphere:
Nowhere on earth can it rain out more than two inches without more humidity being transported in from another place. Over the ocean humidity gets replenished by evaporation, over land only areas that has vegetation or swamps or lakes will replenish humidity by evaporation. keep these charts in mind for later. For now concentrate on the decreasing average cloud cover. It has only been measured for the last 40 years, but here are the results:
There are many different clouds, low, mid-level and high clouds, and they have changed differently over the same time span:
Of these clouds, the low level clouds are reflecting the most, so the 2.4% loss in average cloud cover is an assumption on the low side on the loss of reflection.
In 1984 the average cloud cover was 63.7%, in 2019 it was 61.1%, a loss of 2.6%. The total reflection from clouds and atmospheric scattering is 77 W/m2, of which 60 is from cloud reflection. A 2.6% loss of area of reflection leads to a decreasing of incoming energy of 60 * 0.026 = 1.56 W/m2. This results in a temperature increase to 287 * fourth root of (1- (1.56 / 340)) = 287.33 K, or 0.67 degree Celsius.
When temperature increases by 0.67C water vapor increases by 4% on average; the total absorption of water vapor increases by 0.8 W/m2, mostly by shrinking the atmospheric window. This amounts to 0.24% 0f the total incoming solar radiation. The current average temp on earth is 287 degree Kelvin, so the temperature rise since pre-industrial times from increasing H2O levels is 287 * fourth root of (1-0.0024) = 286.83 K, or 0.17 degree Celsius less.
3. The effects from air and water pollution. . a. The warming of the Northern Arctic region.
North America has great rivers, none greater than the mighty Mississippi. It used to be a meandering river with frequent floods that resulted in depositing its silt over large areas and thus fertilizing the land. The Indians living by the river moved to its new location after the water receded, and they could use the newly fertilized land. After the Louisiana purchase river traffic grew rapidly, but shifting sandbars and the excessively winding river became a problem, so the Mississippi river was converted to be the main transportation artery of the middle USA, the river banks were reinforced and the course of the river straightened. This meant that more of the silt was transported out into the Mexican Gulf, some of the silt that used to fertilize the soil instead fertilized the Mexican gulf. In addition, the Mississippi river used to be very polluted, but is now clean enough that it can be used for drinking water after treatment all the way down into Louisiana. There remains elevated concentration of nitrogen compounds so the Mexican Gulf suffers from excessive algae blooms and even red tide from time to time. This leads to more cloud formation and more rain in the United States east of the 98th meridian. This also occurs in Northern Europe, especially in the North Sea; the rivers flowing into the North Sea are rich in nutrients. The Baltic Sea was near oxygen death, but after the Baltic countries and Poland joined the EU, their rivers got partially cleaned up. In the far East the Yellow Sea and the South China sea are suffering major pollution. All these regions produce more clouds, and through prevailing winds some end up in the Arctic, where they snow out, except in the Summer when they rain out except on Greenland where it snows 12 months of the year. This leads to increasing winter temperatures of about 5.5 C above the 80th latitude, 2.5 C in spring and fall and a decrease of about 0.5 C in the summer (it takes a long time to melt that extra snow). This affects about 4% of the earth’s surface, so the total temperature increase from over-fertilizing the rivers is 0.04 * 2.5 = 0.1 C. No such effect occurs in the Antarctic. To illustrate the current yearly temperature trend in the Arctic, see this current polar temperature chart:
Even more illustrative is the development of ice on Greenland. In 2012 it looked like all of Greenland was going to melt in less than 1000 years, and the polar ice cap would be gone altogether in late summer of 2020. The ice over Greenlnd is now growing ever so slightly again:
b. The effect of various air pollution.
The major effect from air pollution is that it generates aerosols that act as condensation points for cloud formation if the air is oversaturated with moisture. In the last 40 years the air has gotten cleaner in the industrial west, not so much in China, India and Africa. The net result was a 2 % drop in cloud cover and the resulting temperature rise is already accounted for. There are no good worldwide analyses of ancient cloud cover, but air pollution was rising rapidly until the clean air act, enacted in 1963 was beginning to show results in the 70’s. However, ancient method of heating with coal, wood, peat and dried cowdung was far more polluting and harmful to your lungs. If U.S is eliminating all remaining coal plants the CO2 will still be rising since China is planning to build another 1070 coalburning power plants, ane their coal is inferior to ours and their pollution control is far less strict than ours resulting in more aerosols over China and some of the soot to be transmitted all the way to the Arctic, resulting in a black layer of soot on old snow and old ice.
This is the official IPCC AR5 assessment of forcing factors, and we can see that CO2 is over-estimated by a factor of 2.5 and Methane by a factor of 10. When this is taken into account the net forcing from all other factors is neutral within the margin of uncertainty.
c. The effect of greening of most of the earth.
There is one great benefit of increased CO2, the greening of the earth.
Thanks to this greening, done with only the fertilizer of CO2, the earth can now keep another 2 billion people from starvation, not to mention what good it does for plants and wildlife.
The greening of the earth should cause temperature to increase, but if there is enough moisture in the earth the evapotranspiration from the leaves have a cooling effect and more than offsets the lower albedo from green leaves versus dry earth. In addition, with rising CO2 levels the leaves need less water to perform the photosynthesis, so the net result from lowering the albedo by 0.05 % over 17% of the world leads to a cooling down. The average albedo of the earth is 30%, and 17% of the earth lowers the albedo by 5% this lowers the total albedo of the earth by 0.25%.
The total reflection of sunlight from the earth is 22.9 W/m2, so 0.25% of that is 0.057 W/m2, which translates to a net temperature increase of 287 * fourth root of (1- (0.057/ 340)) = 287.33 K, or 0.012 degree Celsius.
d. The areas that are becoming more like a desert.
Most of the earth displays an increase of leaf area, but there are areas in red that are becoming less green. The areas are: The American Southwest, The Pampas area of South America, a 100 mile band in Southern Sahara, part of East Africa, Madagascar, South East Africa, Western Australia, Part of the Volga region, Kazakhstan east of Lake Aral and various parts of China, and the Mekong river. These areas have this in common, the aquifers ate being depleted, the rivers are diminishing and some of them no longer reach the ocean, lakes are almost disappearing, but people still move to those areas “for the good climate”.
The areas so affected are about 900,000 sq miles of the American Southwest and about 3 million square miles total to suffer from becoming more like a desert. The common theme of all these areas is depletion of the aquifers, rivers diminishing, lakes drying up and soil erosion.
The only part of the world US can control directly is The American Southwest. It can expect more frequent and longer droughts, since there is no amplification of clouds from the relatively cool and clean Pacific ocean, and the long term temperature trend is cooling. The Colorado River no longer feeds the Gulf of California with nourishment. The Colorado river used to all the water allocation for all the participating states, but around 2000 the water use had caught up with supply, and since then it has become much worse with demand far outstripping supply.
In addition the Great Salt Lake is now less than a third of the size it was in the 1970’s. A second level water shortage has been issued and for example Arizona will get a million Acre-feet lass per year from the river. The aquifers will be further depleted leading to less rainfall and the few remaining springs will dry out. If nothing is done, the American southwest will become desertified.
Ironically, deserts have a higher albedo than green soil, so letting the American Southwest become a desert would have a cooling effect by the increasing albedo, but the effect from the disappearing clouds would have a far greater heating effect, so letting the American Southwest become a desert is not a solution to the problem.
However, the area subject to desertification is about 0.6% of the world’s land area and rising the albedo by 0.05 leads to a cooling down. The average albedo of the earth is 30%, and before desertification the albedo was 25%, this rises the albedo of the earth by 0.03%. The total reflection of sunlight from the earth is 22.9 W/m2, so 0.03% of that is 0.007 W/m2, which translates to a net temperature decreasee of 287 * fourth root of (1- (0.007/ 340)) = 286.9995 K, or a cool down of 0.0005 degree Celsius.
Summary of all causes for climate change:
Direct effect from rising CO2: 0.17C
Secondary effect from increasing water vapor from rising CO2: 0.05C
Effect from rising Methane: less than 0.01C
Effect from N20 and Ozone: less than 0.01C
Temperature rise from decreasing cloud cover 0.67C
Secondary effect from increasing water vapor from temperature rise from decreasing clouds: 0.17C
Temperature increase from greening of the earth 0.12C
Temperature decrease from areas of desertification 0.0005C
TOTAL TEMPERATURE RISE: 1.2C and that is about where we are today.
What congress is doing to solve the problem.
Congress has passed the anti-inflation bill that included over 300 billion to fight climate change, and it included more solar panels and wind turbine motors to be imported from China. The experience from Europe is that electricity from solar panels and windmills is 5.7 times as expensive as conventional power generation.
This analysis was done for 2019, before COVID. The situation is much worse now, with electricity rares up to 80 c/kWh, topping $1 /kWh this winter in some countries.
Even at the current increased European Gas prices, the estimated excess expenditures on Weather-Dependent “Renewables” in Europe is still very large: $~0.5 trillion in capital expenditures and $~1.2 trillion excess expenditures in the long-term.
These simple calculations show that any claim that Wind and Solar power are now cost competitive with conventional fossil fuel (Gas-fired) generation are patently false. The figures give an outline of the financial achievements of Green activists in stopping fracking for gas in Europe, close on to $1.2 trillion of excess costs.
It would be better not to import any solar panels and wind power generators from China and let them pay for the extra cost rather than building more coal burning plants. After all they were planning to build over a thousand new plants between now and 2030, all legal under the Paris accord. This would benefit the world climate much more, since Chinese coal plants are far more polluting, since China has far less stringent environmental regulations than U.S.
U.S. uses 13.5% of the world’s coal, and eliminating U.S. CO2 emissions would in time reduce the world temperature by 0.023C, providing no other country, such as China and India would increase their use of Coal, which they are, to the total of 1300 new coal plants between now and 2030. This would raise global temperature by more than 0.06 C.
What congress should do instead.
a. What congress should do immediately.
Immediately stop downblending U 233 and pass The Thorium Energy security act SB 4242a. See more here.
2. Remove Thorium from the list of nuclear source material. The half-life of Thorium232 is 14 billion years, so its radioactivity is barely above background noise. More importantly, while Thorium is fertile, it is not fissile and should therefore not be included in the list. This would make it far easier to mine rare earth metals, as long as the ore consists of less than 0.05% Uranium, but any amount of Thorium is allowed without classifying the ore “Source material”.
3. Separate nuclear power into 3 categories. a. conventional nuclear power. b. Thorium breeder reactors that make more U233 than it consumes, and c. Thorium reactors that reduce nuclear waste.
4. Stop buying solar panels from China. Stop buying wind turbine generators from China. Let them install those in China and pay 5 times as much for their electricity.
5. Immediately form a commission led by competent people, not politicians; to decide how to best expand the electric grid and to best harden it against electro-magnetic pulses, whether solar or nuclear and to safeguard it against sabotage.
6. Remove all subsidies on electric cars, solar panels and wind generators, but continue to encourage energy conservation.
7. Encourage research and development of Thorium fueled reactors, especially liquid salt reactors by drastically simplifying and speeding up the approval process. President Trump issued an executive order in the last month of his presidency EO 13972 specifying that the United States must sustain its ability to meet the energy requirements for its national defense and space exploration initiatives. The ability to use small modular reactors will help maintain and advance United States dominance and strategic leadership across the space and terrestrial domains. This EO should be expanded to include civilian small modular reactors, including Liquid salt Thorium reactors less than 200 MW, which are the only valid reactors for space exploration.
b. Longer term developments, but extremely urgent.
Of the long term warming of the globe of 1.1 C since the beginning of industrialization only 0.17 C is attributable to rising CO2, NH4 and NO2 levels, of which United states is currently responsible for 13.5% and decreasing, or 0.023C. The disappearance of clouds is responsible for twice as much globally or 0.33 C of which probably 1/6 is occurring in the American Southwest, causing an increase in temperature of 0.055C. However, the temperature rise in say the Grand Canyon has been in excess of 2 C,, and in the urban areas it has been even more. These are my long term suggestions:
Build a TransContinental Aqueduct. A realistic way to save Lake Mead and reverse the desertification of the American SouthWest.Build a TransContinental Aqueduct. A realistic way to save Lake Mead and reverse the desertification of the American SouthWest.
The problem:
Lake Mead will be emptied in less than 10 years with the current usage pattern. Then what?
The hydroelectric power from Lake Mead (and Lake Powell) is diminishing as the lakes are emptied.
The aquifers in Arizona, especially in the Phoenix and Tucson area, and to some extent New Mexico and the dry part of Texas are being drawn down and are at risk of being exhausted.
The Salton Sea in the Imperial Valley of California is maybe the most polluted lake in all of U.S.A. It is even dangerous to breathe the air around it sometimes. The area contains maybe the largest Lithium deposit in the world.
The Colorado River water is too salty for good irrigation .
The Colorado river no longer reaches the Gulf of California. Fishing and shrimp harvesting around the Colorado River Delta is no more.in less than 10 years with the current usage pattern. Then what?
The hydroelectric power from Lake Mead (and Lake Powell) is diminishing as the lakes are emptied.
40 million people depend on the Colorado River for drinking water. The population is still rising rapidly in the West. Will they have water in the future.
Except for California there is not much pumped Hydro-power storage in the American Southwest.
Texas has plenty of wind power, but no pumped hydro-power storage. This makes it difficult to provide peak power when the sun doesn’t shine and the wind doesn’t blow. Nuclear power is of no help, it provides base power only. Peak power has to come from coal and natural gas plants.
New Mexico has some ideal spots for solar panels, but no water is available for pumped storage.
Arizona has a surging population, wind and solar power locations are abundant, but no pumped hydro-power storage.
Arkansas and Oklahoma have a good barge traffic system. This proposal will increase flood control and improve barge traffic by increasing the maximum barge draft from 9 feet to 12 feet and during dry periods reverse the flow of the Arkansas River. The Arkansas river yearly water flow is nearly double that of the Colorado River.
The solution:
Build a transcontinental aqueduct from the Mississippi River to the Colorado River capable of transporting 12 million acre-ft of water yearly through Arkansas, Oklahoma, Texas, New Mexico and Arizona. It will be built similar to the Central Arizona Project aqueduct, supplying water from the Colorado river to the Phoenix and Tucson area, but this aqueduct will be carrying four times more water over four times the distance and raise the water nearly twice as high before returning to near sea level. The original Central Arizona Project cost $4.7 billion in 1980’s money, the Transcontinental Aqueduct will in Phase 1 cost around $200 Billion in 2022 money applying simple scaling up principles.
The Mississippi River has a bad reputation for having polluted water, but since the clean water act the water quality has improved drastically. Fecal coli-form bacteria is down by a factor of more than 100, the water is now used all the way down to New Orleans for drinking water after treatment. The lead levels are down by a factor of 1000 or more since 1979. Plastic pollution and pharmaceutical pollution is still a problem, as is the case with most rivers. The Ph is back to around 8 and salt content is negligible. Mississippi water is good for irrigation, and usable for drinking water after treatment. The Arkansas River is used as a drinking water source.
But the aqueduct will do more than provide sweet Mississippi water to the thirsty South-west, it will make possible to provide peak power to Texas, New Mexico and Arizona. In fact, it is so big it will nearly triple the pumped Hydro-power storage for the nation, from 23 GW for 5 hours a day to up to 66 GW when fully built out.
The extra pumped hydro-power storage will come from a number of dams built as part of the aqueduct or adjacent to it. The water will be pumped from surplus wind and solar power generators when available. This will provide up to 50 GW of power for 5 hours a day. If not enough extra power has been generated during the 19 pumping hours, sometimes power will be purchased from the regular grid. The other source of pumped hydro-power storage is virtual. There will be up to 23 GW of LFTR (Liquid Fluoride salt Thorium Rector) power stations strategically stationed along the waterway providing pumping of water for 19 hours and providing virtual hydro-power output for the remaining 5, when the aqueduct is fully built.
These 43 GW of hydro-power capacity will be as follows: Oklahoma, 0.2 GW; Texas, 18,5 GW (right now, Texas has no hydro-power storage, but plenty of wind power); New Mexico, 10.5 GW; Arizona 13.6 GW. In Addition, when the Transcontinental Aqueduct is fully built out, the Hoover dam can provide a true 2.2 GW hydro-power storage by pumping water back from Lake Mojave; a 3 billion dollar existing proposal is waiting to be realized once Lake Mead is saved.
The amount of installed hydroelectric power storage is:
Most hydroelectric pumped storage was installed in the 70’s. Now natural gas plants provide most of the peak power. This aqueduct will more than double, triple the U.S. pumped peak storage if virtual peak storage is included. By being pumped from surplus wind and solar energy as well as nuclear energy it is true “Green power”. Some people like that.
What follows is a description of each leg of the aqueduct. Each leg except legs 9 and 10 ends in a dam, which holds enough water to make each leg free to operate to best use of available electricity and provide peak power on demand.
The Transcontinental Aqueduct will serve the Lower Colorado River Basin, Southern New Mexico and Western Texas. It will pump up to 12 million acre-ft of water annually from the Arkansas river and Mississippi river all the way to southern Colorado River.
The total electricity needed to accomplish this giant endeavor is about 60 billion kWh annually. or about one and a half percent of the current US electricity demand. In 2020 the US produced 1,586 billion kWh from natural gas, 956 from coal, 337.5 from wind and 90.9 from solar.
For this giant project to have any chance of success there has to be something in it to be gained from every state that will be participating. Here are some of the benefits:
Arizona: Arizona needs more water. The water from Mississippi is less saline and better suited for agriculture and the people growth makes it necessary to provide more water sources. Right now the aquifers are being depleted. Then what? One example: The San Carlos lake is nearly dry half the time and almost never filled to capacity. With the aqueduct supplying water it can be filled to 80 +- 20% of full capacity all the time. In the event of a very large snow melt the lake level can be reduced in advance to accommodate the extra flow. Likewise during Monsoon season the aqueduct flow can be reduced in anticipation of large rain events. Arizona together with New Mexico has the best locations for solar power, but is lacking the water necessary for hydro-power storage. This proposal will give 600 cfs of water to Tucson, 3,100 cfs to the Phoenix area and 3,900 cfs to the lower Colorado River in Phase 1. I phase 2 it will add 3,100 cfs to Lake Havasu and an extra 4,700 cfs to the lower Colorado River. It will also also add 28 GW of hydro-power storage capable of adding 140 GWh of electric peak power daily when it is fully built out in Phase 3.
Arkansas: The main benefit for Arkansas is better flood control and river control of the Arkansas River and allowing it to deepen the draft for canal barges from 9,5 feet to 12 feet, which is standard on the Mississippi river.
California: The water aqueduct serving Los Angeles will be allowed to use maximum capacity at all times. Additional water resources will be given the greater San Diego area. The Imperial valley will be given sweet Mississippi and Arkansas River water, which will improve agriculture yield. The polluted New River will be cut off at the Mexico border. There will be water allocated to the Salton Sea. There is a proposal to mine the world’s largest Lithium ore, mining the deep brine, rich in Lithium. (about a third of the world supply according to one estimate). This requires water, and as a minimum requirement to allow mining in the Salton Sea the water needs to be cleaned. This requires further investigation, but the area around the Salton Sea is maybe the most unhealthy in the United States. It used to be a great vacation spot.
Mexico: During the negotiations about who was going to get the water in Lake Mead Mexico did not get enough water, so they have been using all remaining water for irrigation, and no water is reaching the ocean anymore. In addition the water is too salty for ideal irrigation. This proposal will provide sweet Mississippi and Arkansas River water to Mexico, ensure that some water reaches the Colorado river delta. This will restore the important ecology and restore aquatic life in the delta and the gulf. The town of Mexicali will get some water in exchange for shutting off New River completely.
Nevada: Las Vegas is a catastrophe waiting to happen unless Lake Mead is saved. With this proposal there will be ample opportunity to make the desert bloom.
New Mexico: The state is ideally suited for solar panels. In addition to give much needed water to communities along the length of the aqueduct, it will provide 13.5 GW of pumped storage power to be made available at peak power usage for up to 5 hours a day.
Oklahoma: The main advantage for Oklahoma is a much improved flood control. It will provide the same advantage for river barge traffic as benefits Arkansas.
Texas: The state has a big problem. It has already built up too much wind power and can not give up their coal burning power plants until the electricity is better balanced. They have no hydro-electric power storage at all, and we saw the result of that in a previous year’s cold snap. This proposal will give the Texas electric grid 8.8 GW of hydro-electric power for up to 5 hours a day.
Utah: The state will no longer be bound to provide water to Lake Mead, but can use all of its water rights for Utah, especially the Salt Lake City region, and to reverse the decline of the Great Salt Lake that is now shrunk to less than a third of the size it had in the 1970’s.
Wyoming: The state will be free to use the water in the Green River and all the yearly allocated 1.05 million acre-feet of water can be used by the state of Wyoming.
The cost to do all these aqueducts will be substantial, but it can be done for less than 350 billion dollars in 2022 money, and that includes the cost of providing power generation. Considering it involves 40 million people dependent on the Colorado River now and another 10 million east of the Rocky Mountains, it is well worth doing, much more important to do than other “green” projects, since it will save the American Southwest from becoming an uninhabitable desert.
This proposed solution cannot be made possible without changing our approach to power generation. The mantra now is to solve all our power needs through renewables. Texas has shown us that too much wind power without any hydroelectric power storage can lead to disaster. In addition, windmills kill birds, even threatening some species, such as the Golden Eagle and other large raptors that like to build their aeries on top of the generators. Solar panels work best in arid, sunny climate, such as Arizona and New Mexico, but the panels need cooling and cleaning to work best, and that takes water. They are even more dependent on hydro-power storage than wind. The transcontinental aqueduct will triple the hydro-electric power storage for the nation. Without pumped power storage we still need all the conventional power generation capacity for when the sun doesn’t shine and the wind doesn’t blow.
Conventional Nuclear power plants doesn’t work in most places since they depend on water for their cooling, and most of these aqueducts pump water in near deserts, and there would be too much evaporation losses to use water from the aqueducts for cooling.
The only realistic approach would be to use LFTR power plants. (Liquid Fluoride Thorium Reactors). There are many advantages for using LFTR. Here are 30 reasons why LFTRs is by far the best choice.
For this project to succeed there must be developed a better way to build SMRs (Small Modular Reactors, less than 250 MW) more effectively. The price to build a LFTR plant should be less than $2.50 per watt. While the LFTR science is well understood, the LFTR engineering is not fully developed yet, but will be ready in less than 5 years if we get to it. In the mean time there should be built one or more assembly plants that can mass produce LFTR reactor vessels small enough so they can be shipped on a normal flatbed trailer through the normal highway system. My contention is that a 100 MW reactor vessel can be built this way and the total cost per plant will be less than 250 Million dollars. To save the American Southwest we will need about 350 of them, or 87,5 billion dollars total. This cost is included in the total calculation. There will be many more of these plants produced to produce all the electric power to power all the electric vehicles that are going to be built. This is the way to reduce fossil fuel consumption. Just switching to electric vehicles will not do the trick. The electric energy must come from somewhere. To convert all cars and trucks and with unchanging driving habits will require another 600 GW of generating capacity by 2050, our present “net zero emissions” goal.
To do this project we need cooperation from all states in providing eminent domain access. The Federal government will need to approve LFTR as the preferred Nuclear process and streamline approval process from many years to less than one year.
Some of the power will come from solar panels and wind turbines, which will reduce the need for LFTR’s. One tantalizing idea is to cover the aqueduct with solar panels. This will do many things, it will not take up additional acreage, water needed to keep the panels clean is readily available, and can even be used to cool the solar panels if economically beneficial. The area available is 152 feet times 1100 miles = 1.6 billion square feet, and one square foot of solar panel produces around 1 W, which means covering the aqueduct with solar panels would produce 882 MW of power. It would also reduce evaporation. The second source of energy will be 165,000 5kW vertical wind turbines producing 825 MW when the wind is blowing. The rest of the power will cme from LFTRs. This idea requires further analysis. Here is one possible implementation of the idea:
C. Further developments to save the American Southwest.
When the Transcontinental aqueduct is well under way it is time to start the Trans-Rocky-Mountain Aqueduct. in a few years the population growth will require again to save Lake Powell and Lake Mead, and rejuvenate the American South-west.
The problem:
Lake Powell and Lake Mead will be emptied in less than 10 years with the current usage pattern. Then what?
The hydroelectric power from Lake Mead (and Lake Powell) is diminishing as the lakes are emptied.
the aquifers are drawn down everywhere in the Southwest, but also the Ogallala Aquifer in Colorado and Kansas, and are at risk of being exhausted.
The Colorado River water is too salty for good irrigation .
The Colorado river no longer reaches the Gulf of California. Fishing and shrimp harvesting around the Colorado River Delta is no more.
40 million people depend on the Colorado River for drinking water. The population is still rising rapidly in the West. Will they have water in the future? Think 20 million future population growth in the next 40 years, people want to move there even with the current water problems.
The solution:
Build a Trans-Rocky-Mountain aqueduct from the Mississippi River to the San Juan River. In the first 391 miles the aqueduct joins the McClellan–Kerr Arkansas River Navigation System by adding the capability of pumping 7,500 cfs of water through 16 dams that service the locks. This will lead to reversing the flow of water during low flow. This also facilitates the navigation channel to be deepened from 9 feet to 12 feet to service fully loaded barges, a step authorized but not funded by Congress. The Arkansas river will then be capable of transporting 8 million acre-ft of water yearly through Arkansas, Oklahoma, Kansas, Colorado and New Mexico, supplying water from the Colorado river to Lake Powell. All that is needed to do in this stage is provide the dams and locks with a number of pumps and pump/generators to accommodate this, at a cost of less than 2 billion dollars. The next phase is pumping up water in the Arkansas river for 185 miles. To accommodate this there will be 17 small control dams built that are closed when normal pumping occurs and open during flood conditions. The cost for this segment, including pumps will be less than 3 billion dollars. The third segment is a 465 mile aqueduct to cross the Rocky Mountains much like the Central Arizona project but this aqueduct will carry three times more water 1.27 times the distance and raise the water four times higher. The original Central Arizona Project cost $4.7 billion in 1980’s money, the aqueduct part of the Trans-Rocky-Mountain aqueduct will cost around $50 Billion in 2021 money applying simple scaling up principles.
Power requirements for the 3 stages are 310 MW for the canal stage, 600MW for the river stage and 6.2 GW for the aqueduct stage. The aqueduct stage can be controlled by the power companies to shut off the pumps and provide 6.4 GW of virtual peak power for up to 5 hours a day on average, and each leg can be controlled individually since they are separated by large dams. There will be 64 one hundred MegaWatt LFTR (Liquid Fluoride salt Thorium Rector) power stations strategically stationed along the waterway providing pumping of water for 19 hours and providing virtual hydro-power output for on average 5 hours. There will also be 910 MW of power needed that is controlled by the river authorities.
The building cost of providing LFTR power should be around $2.50 per Watt of installed energy if a plant is built to manufacture via an assembly line a standardized version of 100 MW LFTR reactor core vessels assemblies capable of being transported on truck to the installation point. The total power cost should then be 16 billion dollars to build, and 5 cents per kWh or about 2.5 billion dollars a year to provide power.
The Mississippi River has a bad reputation for having polluted water, but since the clean water act the water quality has improved drastically. Fecal coli-form bacteria is down by a factor of more than 100, the water is now used all the way down to New Orleans for drinking water after treatment. The lead levels are down by a factor of 1000 or more since 1979. Plastic pollution and pharmaceutical pollution is still a problem, as is the case with most rivers. The Ph is back to around 8 and salt content is negligible. Mississippi water is good for irrigation, and usable for drinking water after treatment. The Arkansas River water quality is pretty good, good enough in Kaw Lake to be used for municipal water supply. Nitrates and phosphates are lower than in most Eastern rivers, Ph is around 8 and coli-bacteria low.
Most hydroelectric pumped storage was installed in the 70’s. Now natural gas plants provide most of the peak power. This aqueduct will add 6.4 GW to the U.S. pumped peak storage if virtual peak storage is included. By being pumped from surplus wind and solar energy as well as nuclear energy it is true “Green power”. Some people like that.
What follows is a description of each leg of the aqueduct. Legs 3, 4, 5 and 6 ends in a dam, which holds enough water to make each leg free to operate to best use of available electricity and provide peak power on demand.
Leg 1 of The Trans-Rocky-Mountain aqueduct. From the Mississippi river to Webbers Falls lock and dam. Total length 15miles of aqueduct and 335 miles of river. Cost of water 333 kWh per acre-ft.
Leg 2 of The Trans-Rocky-Mountain aqueduct. From Webbers Falls to Keystone Dam, a distance of about 75 miles that is river and 25 miles, which is canal. Cost of water 593 kWh per acre-ft.
Leg 3 of the Trans-Rocky-Mountain aqueduct. From Keystone Dam to Kaw Dam.The Keystone Lake is 38 miles long and the river part is about 110 miles. Cost of water 901 kWh per acre-ft.
Leg 4 of the Trans-Rocky-Mountain aqueduct. From Kaw Lake to John Martin Reservoir, a distance of about 200 miles. Cost of water 4,446 kWh per acre-ft.
Leg 5 of the Trans-Rocky-Mountain aqueduct. From John Martin Reservoir to Trinidad Lake, a distance of about 120 miles. Cost of water 7,300 kWh per acre-ft.
Leg 6 of the Trans-Rocky-Mountain aqueduct. From Trinidad Lake to Abiquiu Reservoir, a distance of 90 miles. Cost of water 7,910 kWh per acre-ft.
Leg 7 of the Trans-Rocky-Mountain aqueduct. From the Abiquiu Reservoir to the San Juan River, a distance of 55 miles. Cost of water 7,395 kWh per acre-ft.
Once these two aquifers are completed and running successfully filling the rivers again it is time to refill the aquifers. This requires a change in the water rights laws. The rain water is a property of the land and can be locally retained via small catch basins and ditches. This will restore the aquifers, reduce soil erosion and rejuvenate vegetation as has been successfully done in the dry parts of India. They needed to capture the monsoon rains, and so does Arizona and New Mexico.
One more thing:
Build aSouth Platte River aqueduct. This will solve the water needs for the greater Denver ares and help preserve the northern Ogallala aquifer.
The rise in CO2 is on balance positive, it has already helped to keep 2 billion people from starvation. With food famine coming the very worst thing we can do is declare a climate emergency and unilaterally reduce our electric supply eliminating much of our fossil fuel source to produce electricity and at the same time push electric cars.
This cannot be solved unless there will be a deep commitment to Nuclear power, streamline government permit processes and let private industry find the best solutions without government playing favorites and slowing down the process. Regular U235 power is not sufficient for this, Only Thorium power will do, and there are many reasons for it. Here are 30 of them:
My favorite Thorium power plant would be a 100 MW Liquid Fluoride Thorium Reactor (LFTR). It is also called a Small Modular Reactor (SMR). It is small enough that all core elements will fit in three standard truck containers and be made on an assembly line. It can be constructed many ways, one is a normal fast breeder reactor, another is adapted to burn nuclear waste. The cost for these reactors, when built on an assembly line will be less than $2 per Watt. They can be placed anywhere, since they are inherently safe, no need for an evacuation zone. Since they are operating at 500C temperature with either gas or liquid lead as heat transfer media there is no need for water as a cooling medium. When mass produced it will be able to produce electricity at 5 c per kWh and the mining to produce the materials is a fraction of what is needed for solar, and wind power, especially when taking into account the intermittent nature of these power sources.The only thing better would be fusion power, but that is at least 20 years away as a power producing source, but it is coming. These are exciting times!
When the Supreme Court ruled that an agency such as the EPA does not have the authority to regulate CO2 emissions by fiat. Only Congress can enact a law to do this. I pointed out that CO2 is not the culprit gas that causes climate change, and as an example I used the South Pole weather station, having a 60+ year of good statistics, and it showed that the temperature trend is -2C per century. One would have expected a rise, since at the average winter temperature of -61C water vapor is nearly non-existent, and CO2 is the dominant greenhouse gas. One would have expected a one degree or more warming instead. This is one data point we are in a cooling trend,and indeed we are. The Greenland ice data shows it to be true:
Yet the current worldwide trend is a temperature increase. Note that the temperature models have increased the temperature increase with time from CIMP5 to CIMP6, and so diverging more and more from the HADCRUT4 data.
The overall worldwide temperature is increasing, but not at the rate the climate models suggest. The important thing is, where are the temperature increases? The South Pole winter temperatures are decreasing 2C per century, but summer temperatures are increasing ever so slightly. In the Arctic the situation is reversed. The winter temperatures have risen between 3C and 7C and vary widely from year to year, but the summer temperatures are slowly decreasing. The current temperature chart for the Arctic above 80 degrees latitude tells the story:
Notice the wild temperature swings in the winter, and the temperature stability below average in spring and summer.
There must be something with Climate change far more important than rising CO2 levels, and indeed there is. A couple of weeks ago I told a story of Dr Lovelock and his Gaya theory, and how he found out the air had much more DiMethylSulfide (DMS) than expected, and the molecules acted as condensation points for clouds. The DMS was generated by Phytoplankton, dinoflagellates and diatoms that contain chlorophyll and require sunlight in order to live and grow. Most phytoplankton are buoyant and float in the upper part of the ocean, where sunlight penetrates the water. Phytoplankton also require inorganic nutrients such as nitrates, phosphates, and sulfur which they convert into proteins, fats, and carbohydrates. If nutrients are too abundant it can lead to algae blooms, such as red tide. In that case all oxygen are consumed and the algae dies and leave a toxic mess. The areas where this occurs are near river outlets that contain too many nourishments. This is the case in the Mexican Gulf, the Eastern seaboard, the North Sea and the Baltic, as well as South Asia and East Asia. The inland areas will see more clouds and more rains, but not necessarily more severe storms. Flooding may increase though.
Far more troublesome is what happens to areas that do not experience an increase in clouds. The trouble starts a few hundred miles west of the Mississippi River in the Ogallala aquifer. This map shows changes in Ogallala water levels from the period before the aquifer was tapped to 2015.
Image credit: Nation Climate Assessment 2018
Going west to New Mexico things get worse. New Mexico depends on the monsoon rains starting in July and continues into the fall. They have a tendency to fail from time to time and sometimes many years in a row, they cannot be relied upon to water the thirsty earth. The grass and other vegetation dies, and when the rains come, they often cause flash floods that are very destructive to the soil, and leaves large areas barren. To illustrate what is happening take the Gila River. It starts in the Gila National Forest in New Mexico and flow through near Phoenix and ends i the Colorado River near the Mexico border. It used to have a flow of 1.3 million Acre-feet annually flowing seasonally through the Phoenix area. The Coolidge dam was built in 1930, all the land was taken by eminent domain, the Indians protested that some ancient burial grounds would be flooded, but at no avail. The dam was built, and a big disappointment it was. The evaporation from the San Carlos Lake was higher than the inflow for much of the year, co the total flow of the Gila river was greatly reduced. These are the numbers for the last ten years:
Only once in the last ten years has the lake been filled to even 25% of full capacity, and the last two years the lake has dried out during the most important growing season.All fish has died. The lake is totally useless even for recreational purposes, and nearly worthless for the Phoenix area as water supply. The Central Arizona Project has a capacity of providing 1.4 million Acre-feet a year, but has only been awarded a fraction of its capacity from the Colorado River, and since Lake Mead is drying up, the supply will be reduced to almost nothing.
Hoe dire is the situation? Arizona has a rising population, This chart shows it well:
Arizona has had a water problem since before the creation of the Arizona department of water resources. The farmers that had water rights took their allotment and expected a low price, say $100 per acre-ft, the cost of pumping it out of the ground. The municipal users don’t mind to pay $1,500 per acre-ft, after all, that is only 2 cents per gallon, so when the supply fails, the farmer is the loser.
So, where do the water supplies come from? These are official numbers from 2019
Since then the situation has gotten much worse. The Colorado River contribution is down by at least 30%, and will be cut down further when Lake Mead drops some more. It is already precariously close to dead pool. The Gila River water flow is zero during growing season, but the Salt River still delivers 300,000 A-f per year, all during growing season. So the in-state river flow is down by a half. This means that over half of Arizona’s water supply will come from drawing down the aquifers. This will reduce the river flows some more, the land will be dried up, and eventually the wells will dry up and Arizona will act more like a desert, with no cooling capacity left in the soil, the summer temperatures will be even hotter and dust storms will be common. The trees will die from drought and wildfires will increase. When the monsoon rains come, heavy flash floods will remove what little top soil is left. This is real climate change in the American Southwest.
If we concentrate on limiting CO2 emissions but ignore the real causes of climate change this is the future the American South-west can look forward to. If we took a fraction of the money earmarked to eliminate fossil fuel and use it instead to save the planet, in this case the American Southwest, then we’ll again make the American Southwest livable with enough water for 40 million people, and with a still functioning agriculture in the west, supplying food for many more people, plants and wildlife.
One of the problems leading to climate change is polluting rivers. Of the ten most polluting rivers in the world none are in Europe or the Americas, see map:
The main pollutant in these rivers is particle pollution such as plastic, but unprocessed sewage is prevalent.
Nitrogen pollution from agriculture is another problem, even in Europe and America. The Dutch farmers are up in arms over the draconian measures imposed by the Dutch government, praised on by Klaus Schwab and he New world Order leaders that want “The great reset”. This involves reducing the nitrogen content on the agricultural lands by 50, 75 and even 95% in certain areas, reduce cattle by 50% and a similar reduction in the pig population. The protest is joined by Germany, Poland, Italy and Spain (and maybe Australia). The protest is immense:
Government mandates cannot solve the nitrogen crisis. The best way to reduce the nitrogen pollution is to lower the nitrogen fertilizer from slightly above optimum to slightly below optimum. With fertilizer cost more than tripling this adjustment was going to be made anyhow. Plants have a remarkable ability to absorb the nitrogen, and with the rising CO2 levels they do so more efficiently. The optimum amount is different for every plot, and any farmer knows much better than any desk-bound bureaucrat how and when to sow, fertilize and reap.
In the eastern half of the U.S. water rights comes with the land, and since rainfall can lead to floods, water rights are water responsibilities. When a land owner disturbs the soil he must first put up a retaining sausage to stop erosion. Then he has to build a retainment basin to compensate for roofs and hardened surfaces, so the water will be retained on the property as much as possible. This will lessen floods. The farmers have to build shallow ditches adjacent to creeks and rivers to prevent agricultural runoffs. And fertilizing is only allowed when no thunderstorms or rains are expected
In the dry American southwest it is all about water rights. Land without water rights is nearly worthless. If a homeowner without water rights get caught putting a bucket under his downspout and uses the rain to water a newly planted thee, he can be fined. All water must be purchased. This is wrong. The water that rains on a piece of land belongs to the land and should return to the aquifer. The springs, forming creeks belong to the river and cannot be dammed. This will help restore the aquifiers, but the river flows will be diminished until the aquifers are restored, which may take a century. So before the water rights question can be righted and the aquifers restored we must
Build a TransContinental Aqueduct. This will solve the water needs for the upper Western Texas, New Mexico, Arizona, lower California, Mexico and the Lower Colorado River basin, and then
Build a Trans-Rocky Mountain aqueduct. This will solve some of the water needs for Oklahoma, Kansas, Colorado, upper New Mexico and the Upper Colorado river basin. To complete the trying to save the aquifers we also need to
Build aSouth Platte River aqueduct. This will solve the water needs for the greater Denver ares and help preserve the northern Ogallala aquifer.
The rise in CO2 is on balance positive, it has already helped to keep 2 billion people from starvation. With food famine coming the very worst thing we can do is declare a climate emergency and unilaterally reduce our electric supply eliminating much of our fossil fuel source to produce electricity and at the same time push electric cars.