We have experienced a 50% increase in CO2 levels since the beginning of industrialization. In the last 30 years the level has risen 17%, from about 350 ppm to nearly 410 ppm. Is this good or bad for the climate?
The traditional way to approach the problem of guessing what effect of rising CO2 levels has on the climate is by creating climate models. Thy have recently been adjusted, and they suddenly show a much higher rate of future temperature increase, in this case what is supposed to happen to global temperatures for a doubling of CO2 from pre-industrial times, from 270ppm to 540ppm.
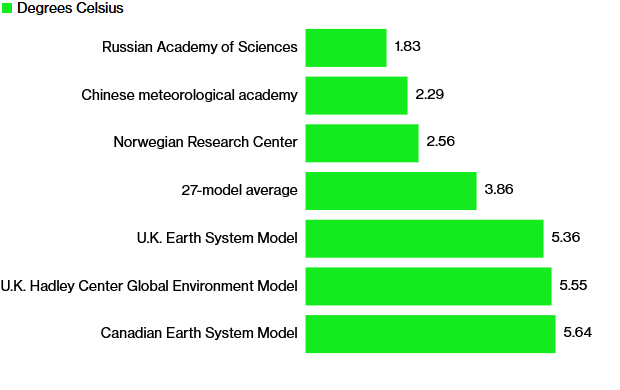

The first thing that strikes you is the great discrepancies between the models. The Russian, Chinese and Norwegian models show a much slower temperature rise than rest of the models. Why is that?
There are two ways to approach this problem. The climate models make certain assumptions about the behavior of the changing atmosphere, and based on these assumptions model future temperature changes. This is the approach from IPCC for the last 32 years. These models are failing miserably when compared to actual temperature changes. This is the traditional way.
The other way i to observe what is actually happening to our temperature over time as the CO2 increases. We have over 50 years of excellent global temperature data, so with these we can see where, when and by how much the earth has warmed.
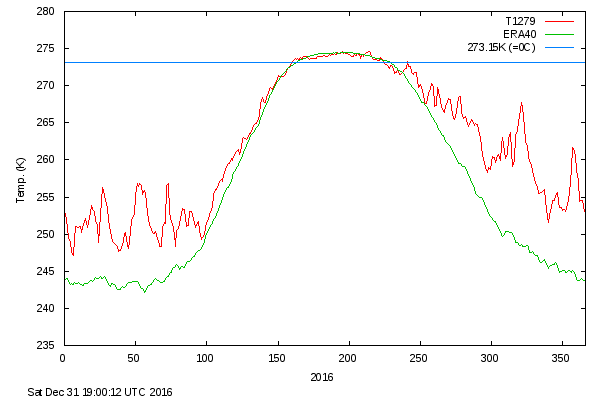
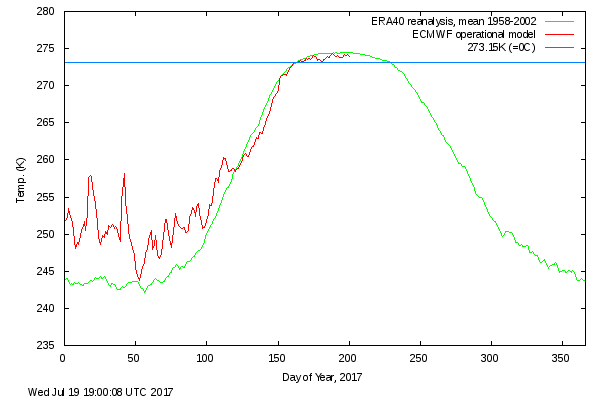
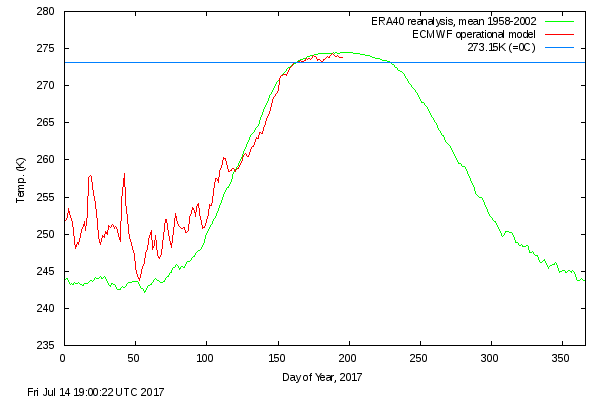
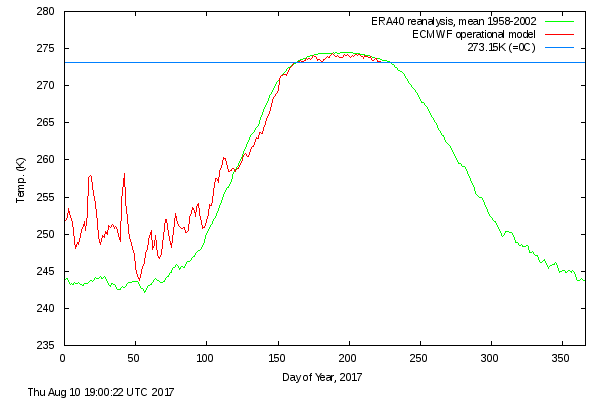
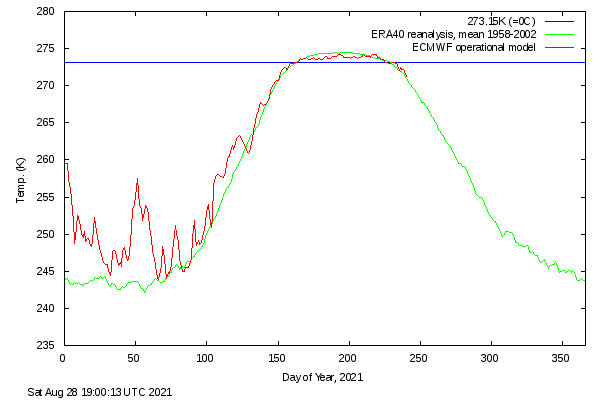
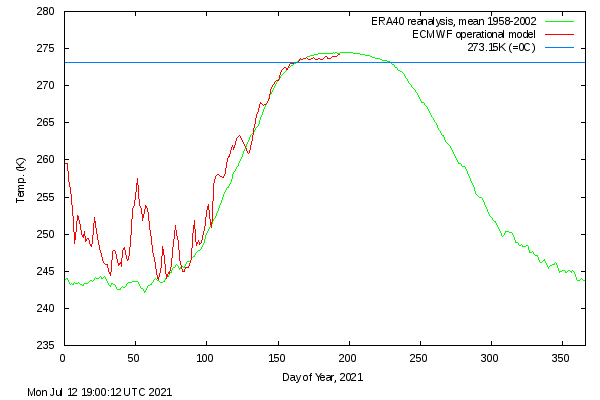
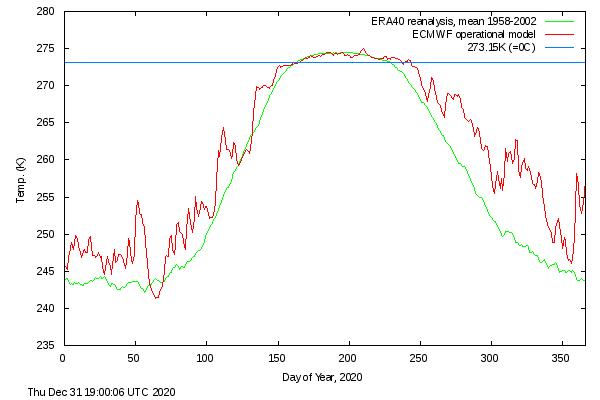
The most drastic temperature rise on earth has been in the Arctic above the 80th latitude. In the winter of 2018 it was 8C above the 50 year average. See charts from the Danish Meteorological Institute:
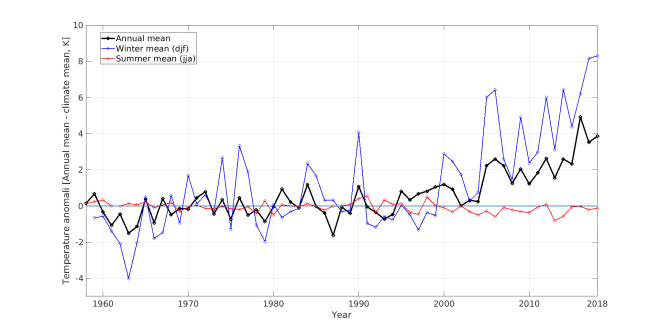 Note, there is no increase at all in the summer temperatures!

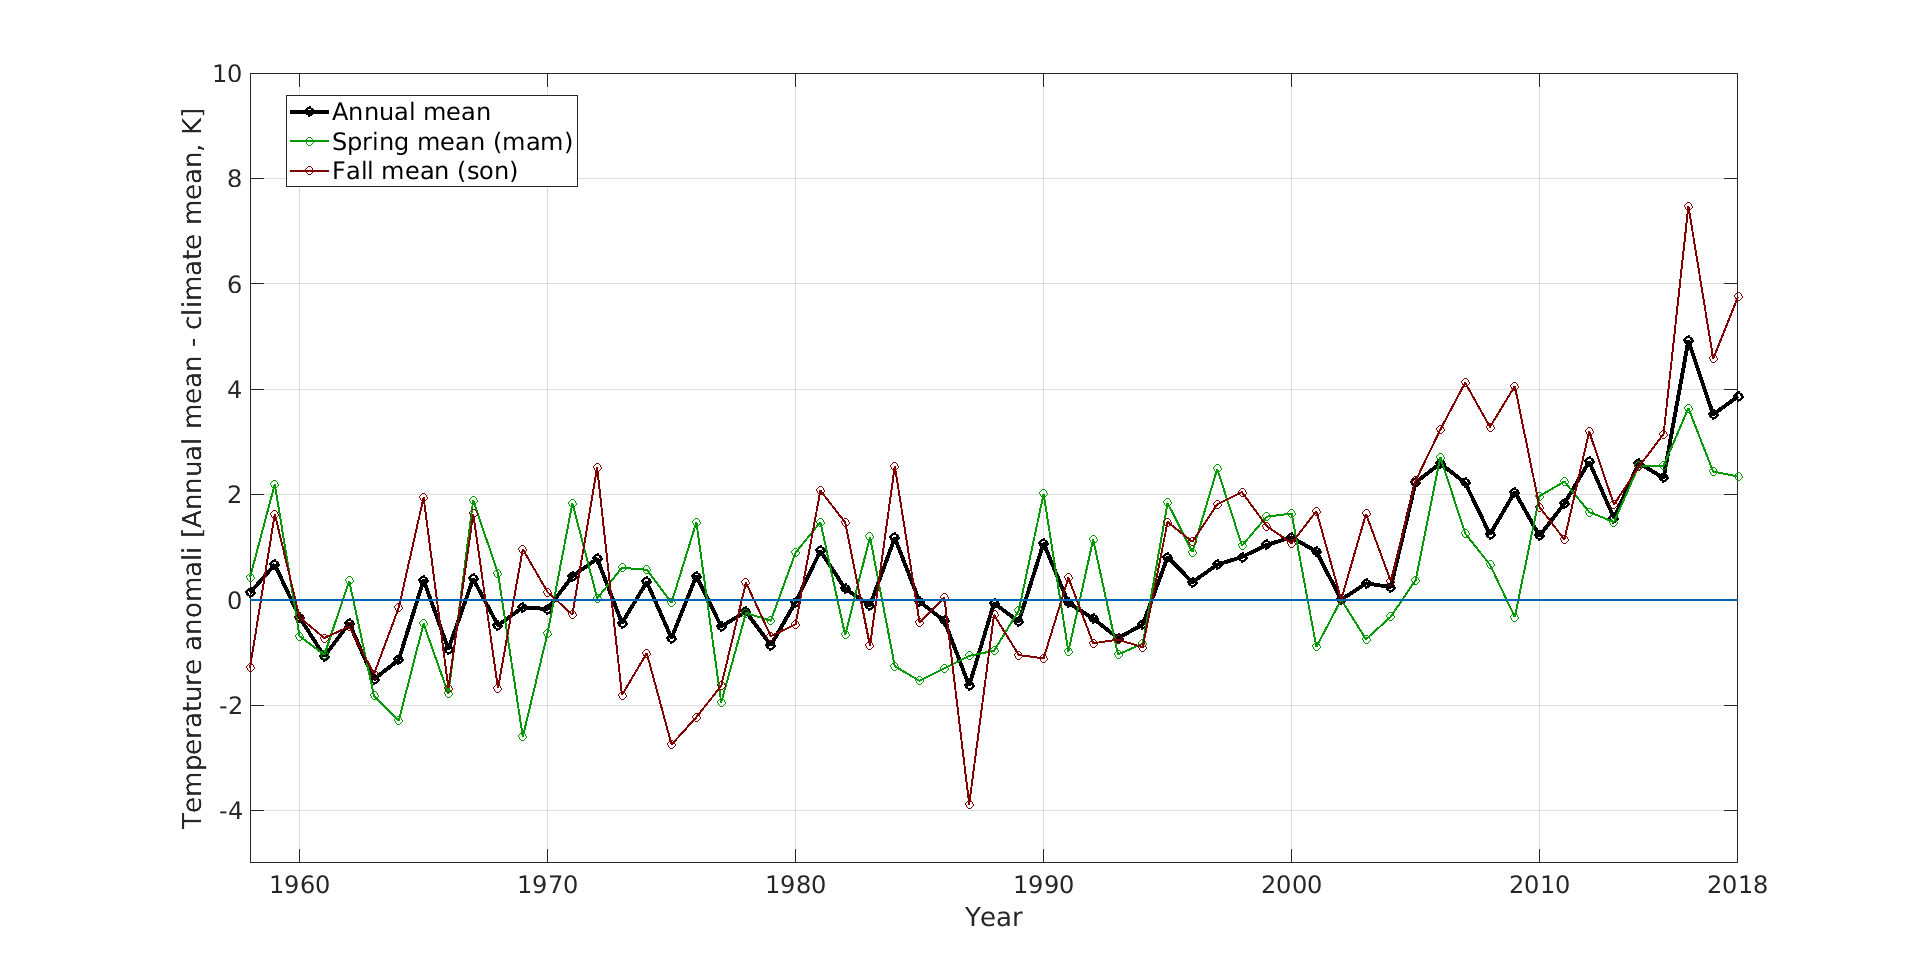
The fall temperature saw an increase of 5C and the spring temperature saw an increase of about 2.5C.
The 2020 winter has so far seen an about 5c increase Source: DMI.

This 8C ( or 5C) rise in winter temperatures is significant, most would even say alarming, but my response is, why is that?
To get the answer we must study molecular absorption spectroscopy and explain a couple of facts for the 97% of all scientists who have not studied molecular spectroscopy. IPCC and most scientists claim that the greenhouse effect is dependent on the gases that are in the atmosphere, and their combined effect is additive according to a logarithmic formula. This is true up to a certain point, but it is not possible to absorb more than 100% of all the energy available in a certain frequency band! For example: If water vapor absorbs 50% of all incoming energy in a certain band, and CO2 absorbs another 90% of the energy in the same band, the result is that 95% is absorbed, (90% + 50% * (100% – 90%)), not 140%, (90% + 50%).
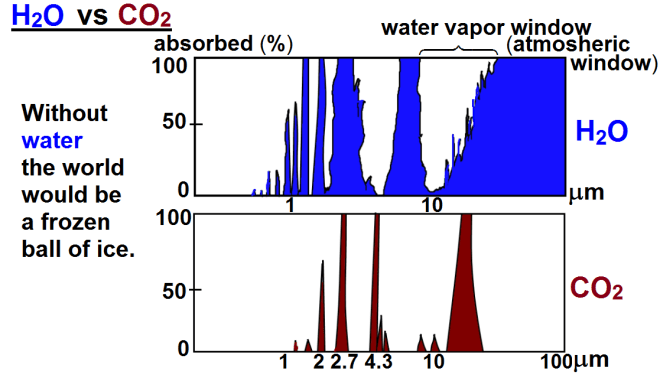
The following chart shows both CO2 and H2O are absorbing greenhouse gases, with H20 being the stronger greenhouse gas, absorbing over a much wider spectrum, and they overlap for the most part. But it also matters in what frequency ranges they absorb.
To better understand the importance of frequency spectra this we will look at the frequency ranges of the incoming solar radiation and the outgoing black body radiation of the earth. It is the latter that causes the greenhouse effect. Take a look at this chart:
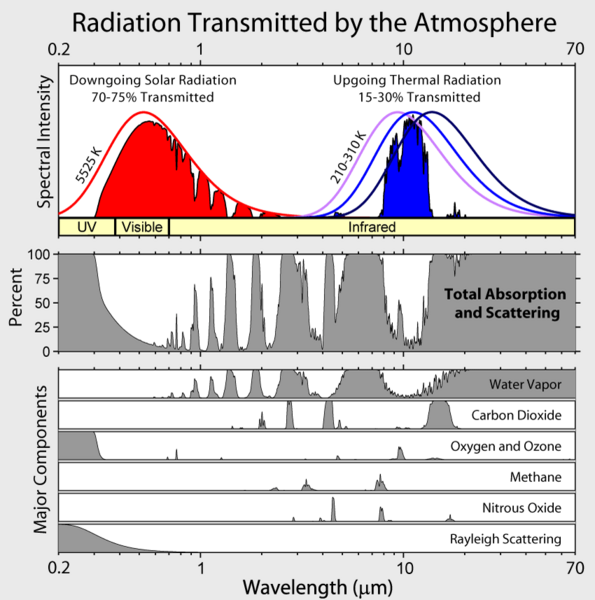
The red area represents the observed amount of solar radiation that reaches the earth’s surface. the white area under the red line represents radiation absorbed in the atmosphere. Likewise, the blue area represents the outgoing black body radiation that is re-emitted. The remaining white area under the magenta, blue or black line represents the retained absorbed energy that causes the greenhouse effect.
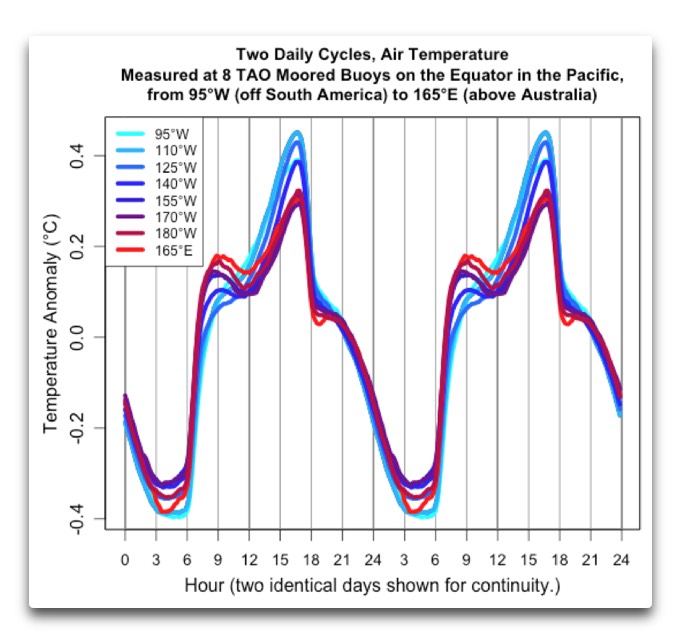
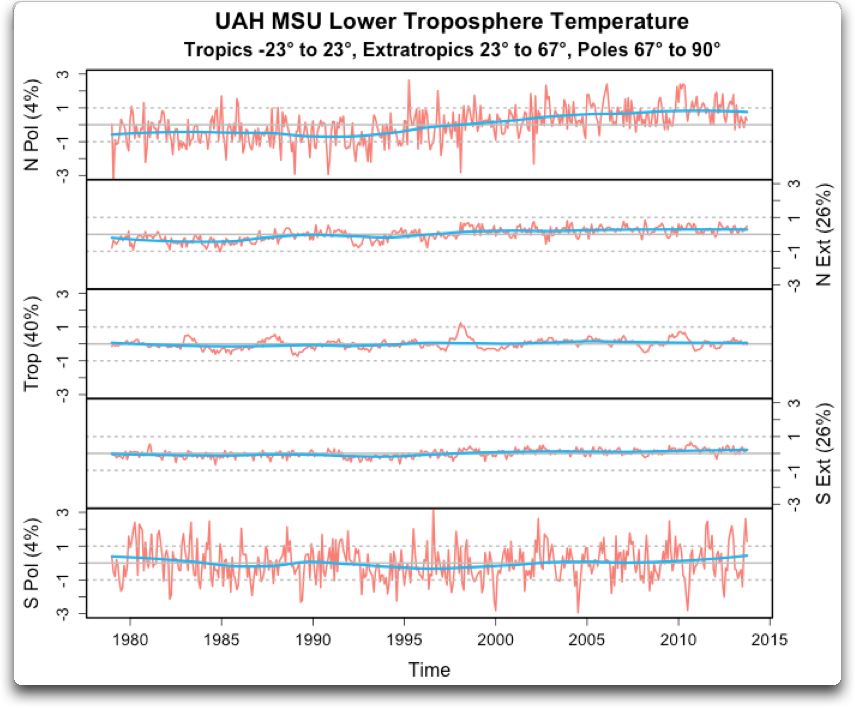
Let us now take a look at the Carbon Dioxide bands of absorption, at 2.7, 4.3 and 15 microns. Of them the 2.7 and 4.3 micron bands absorb where there is little black body radiation, the only band that counts is at 15 microns, and that is in a band where the black body radiation has its maximum. However it is also in a band where water vapor also absorb, not as much as CO2,only about 20% to 70% as much. Water vapor or absolute humidity is highly dependent on the temperature of the air, so at 30C there may be 50 times as much water vapor, at 0C there may be ten times as much water vapor, and at -25C there may be more CO2 than water vapor. At those low temperatures the gases are mostly additive. In the tropics with fifty times more water vapor than CO2, increased CO2 has no influence on the temperature whatsoever. Temperature charts confirm this assertion:
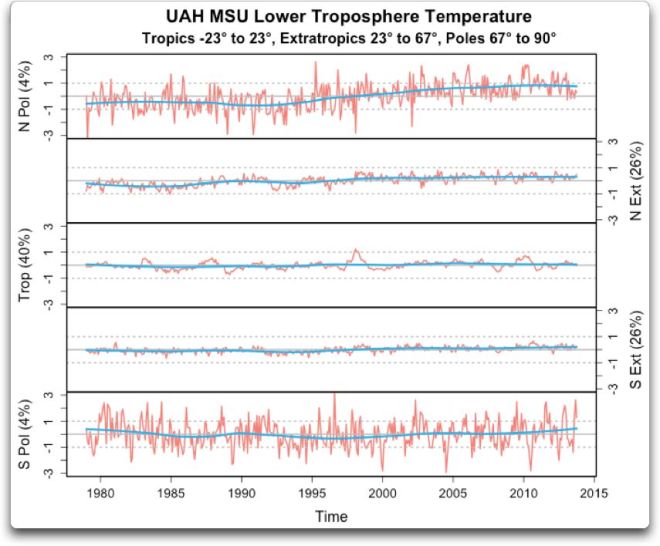
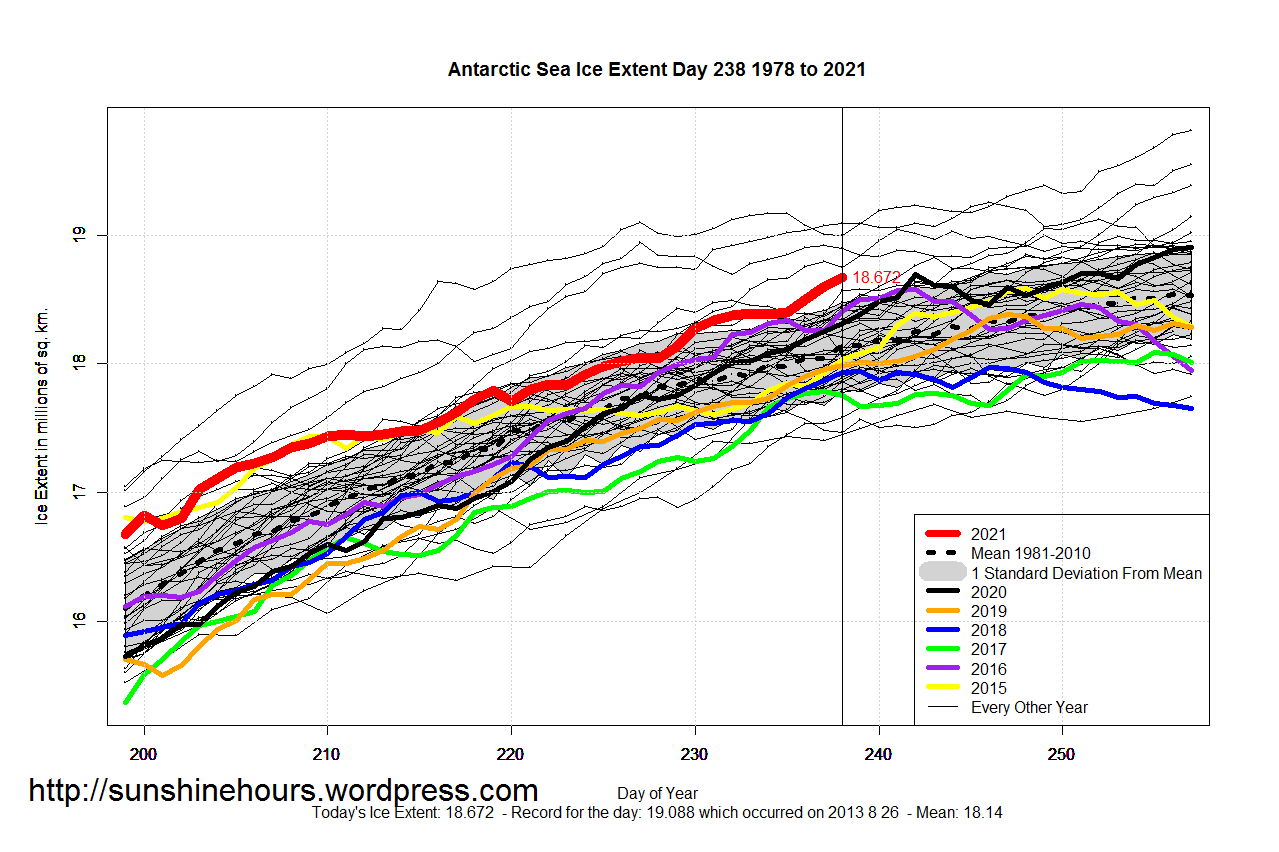
The temperature in the tropics displays no trend whatsoever. It follows the temperature of the oceans, rises in an el niño and falls in a la niña. We are now in the end of an el niño, soon to be followed by a rather strong la niña.The temperature in the southern hemisphere shows no trend. In the northern temperate region there is a slight increase, but the great increase is occurring in the Arctic. There is no increase in the Antarctic yet even though the increase in CO2 is the same in the Antarctic as it is in the Arctic and the winter temperature in the Antarctic is even lower than in the Arctic. So CO2 increase cannot be the sole answer to the winter temperature increase in the Arctic.
A few days ago there was a storm of historic magnitude, filled with moisture going up from the Mexican Gulf through the Atlantic and really sacked Scotland and Norway. The weather warnings called for severe floods and hurricane-like winds:

What happened to the temperature when the storm arrived?
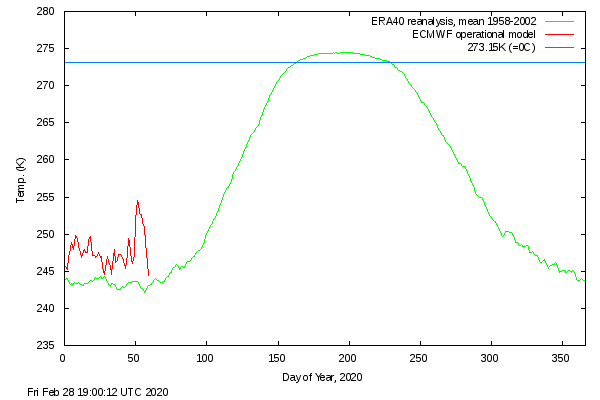
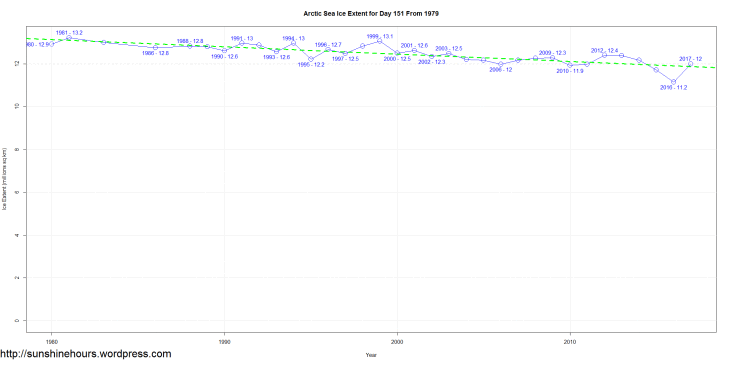
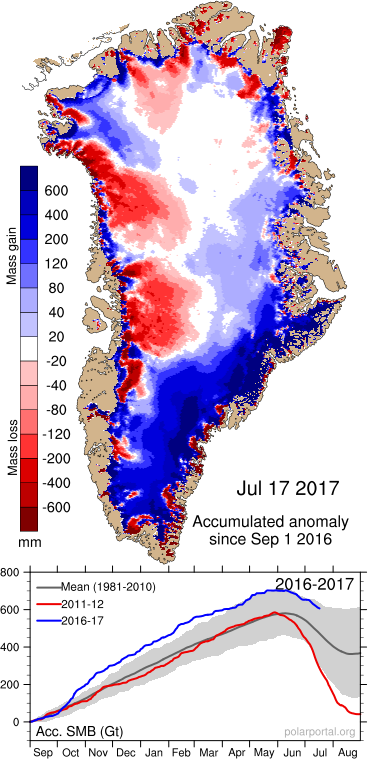
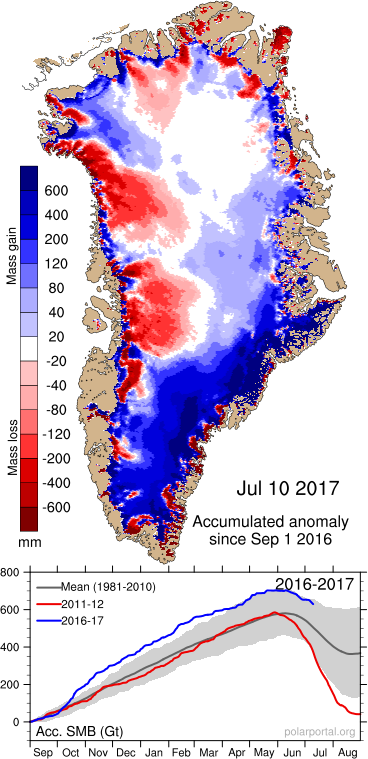
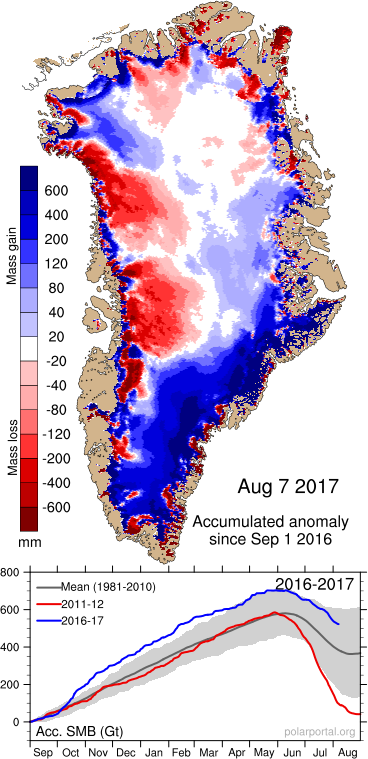
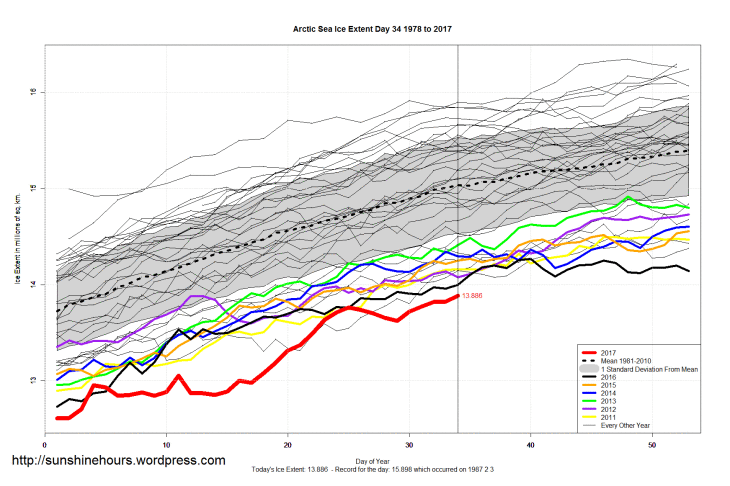
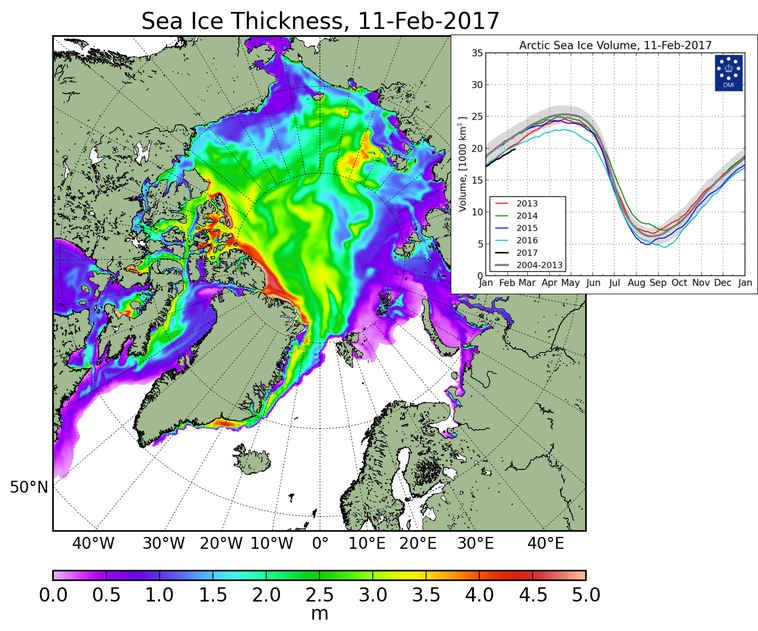
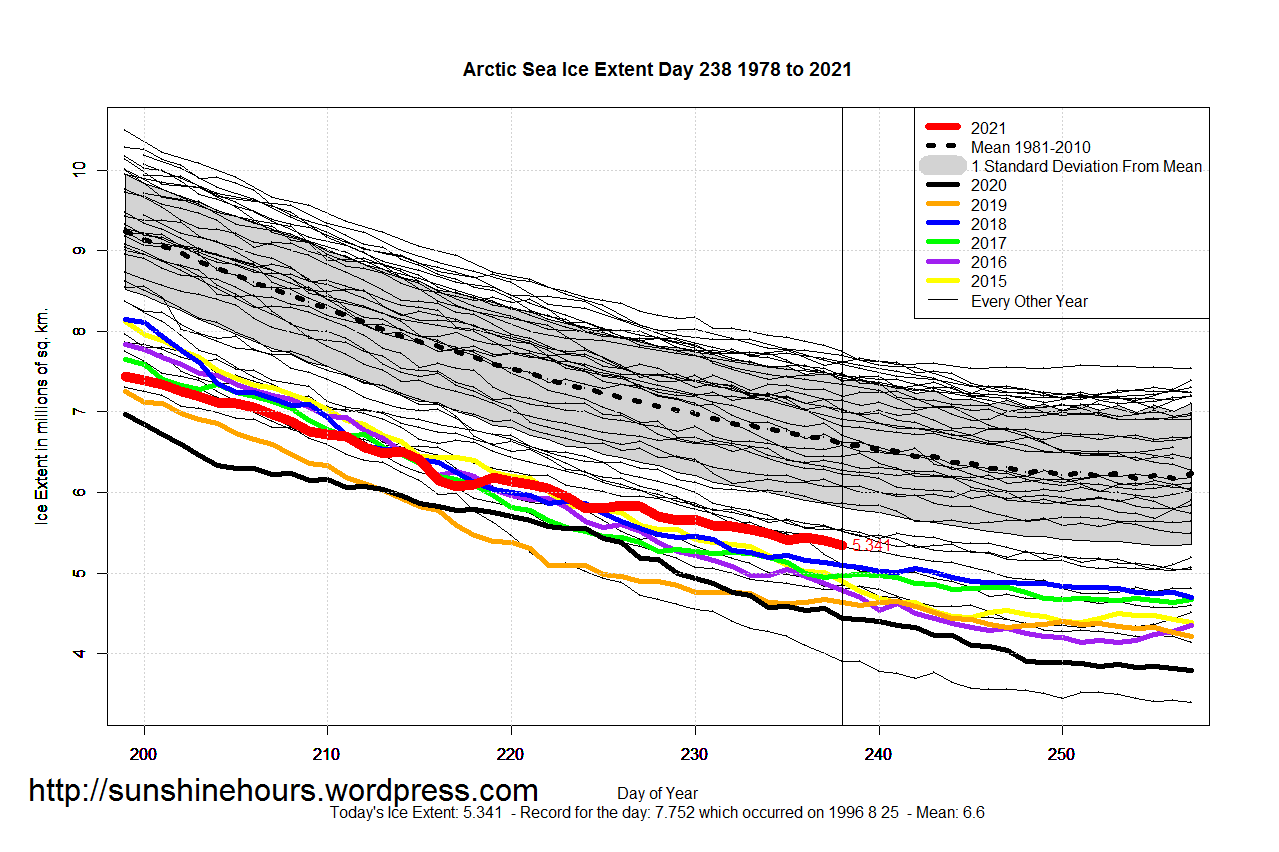
The Arctic temperature above the 80th latitude rose about 12C, from about -30C to about -18C, and most of the moisture snowed out. What happened to the ice cover when the storm arrived? Let’s see the most recent Arctic ice cover.
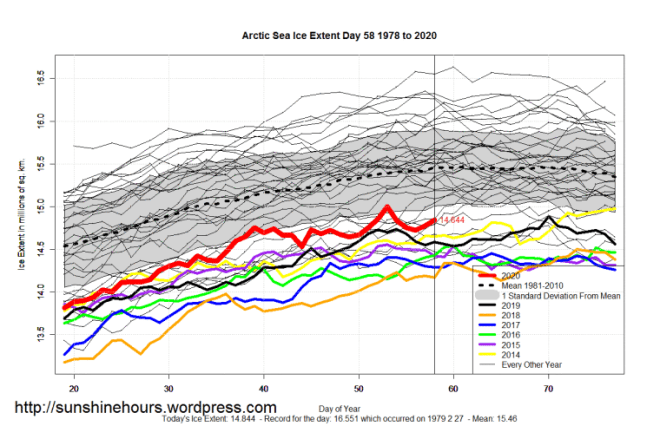
As the storm arrives, some of the ice breaks up, but at the end of the storm it bounces back, helped with all the snow that just fell. After the snowfall ends the ice formed easily breaks up again.
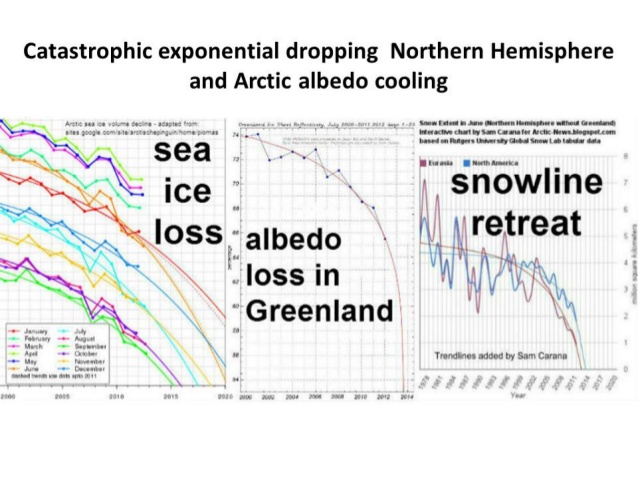
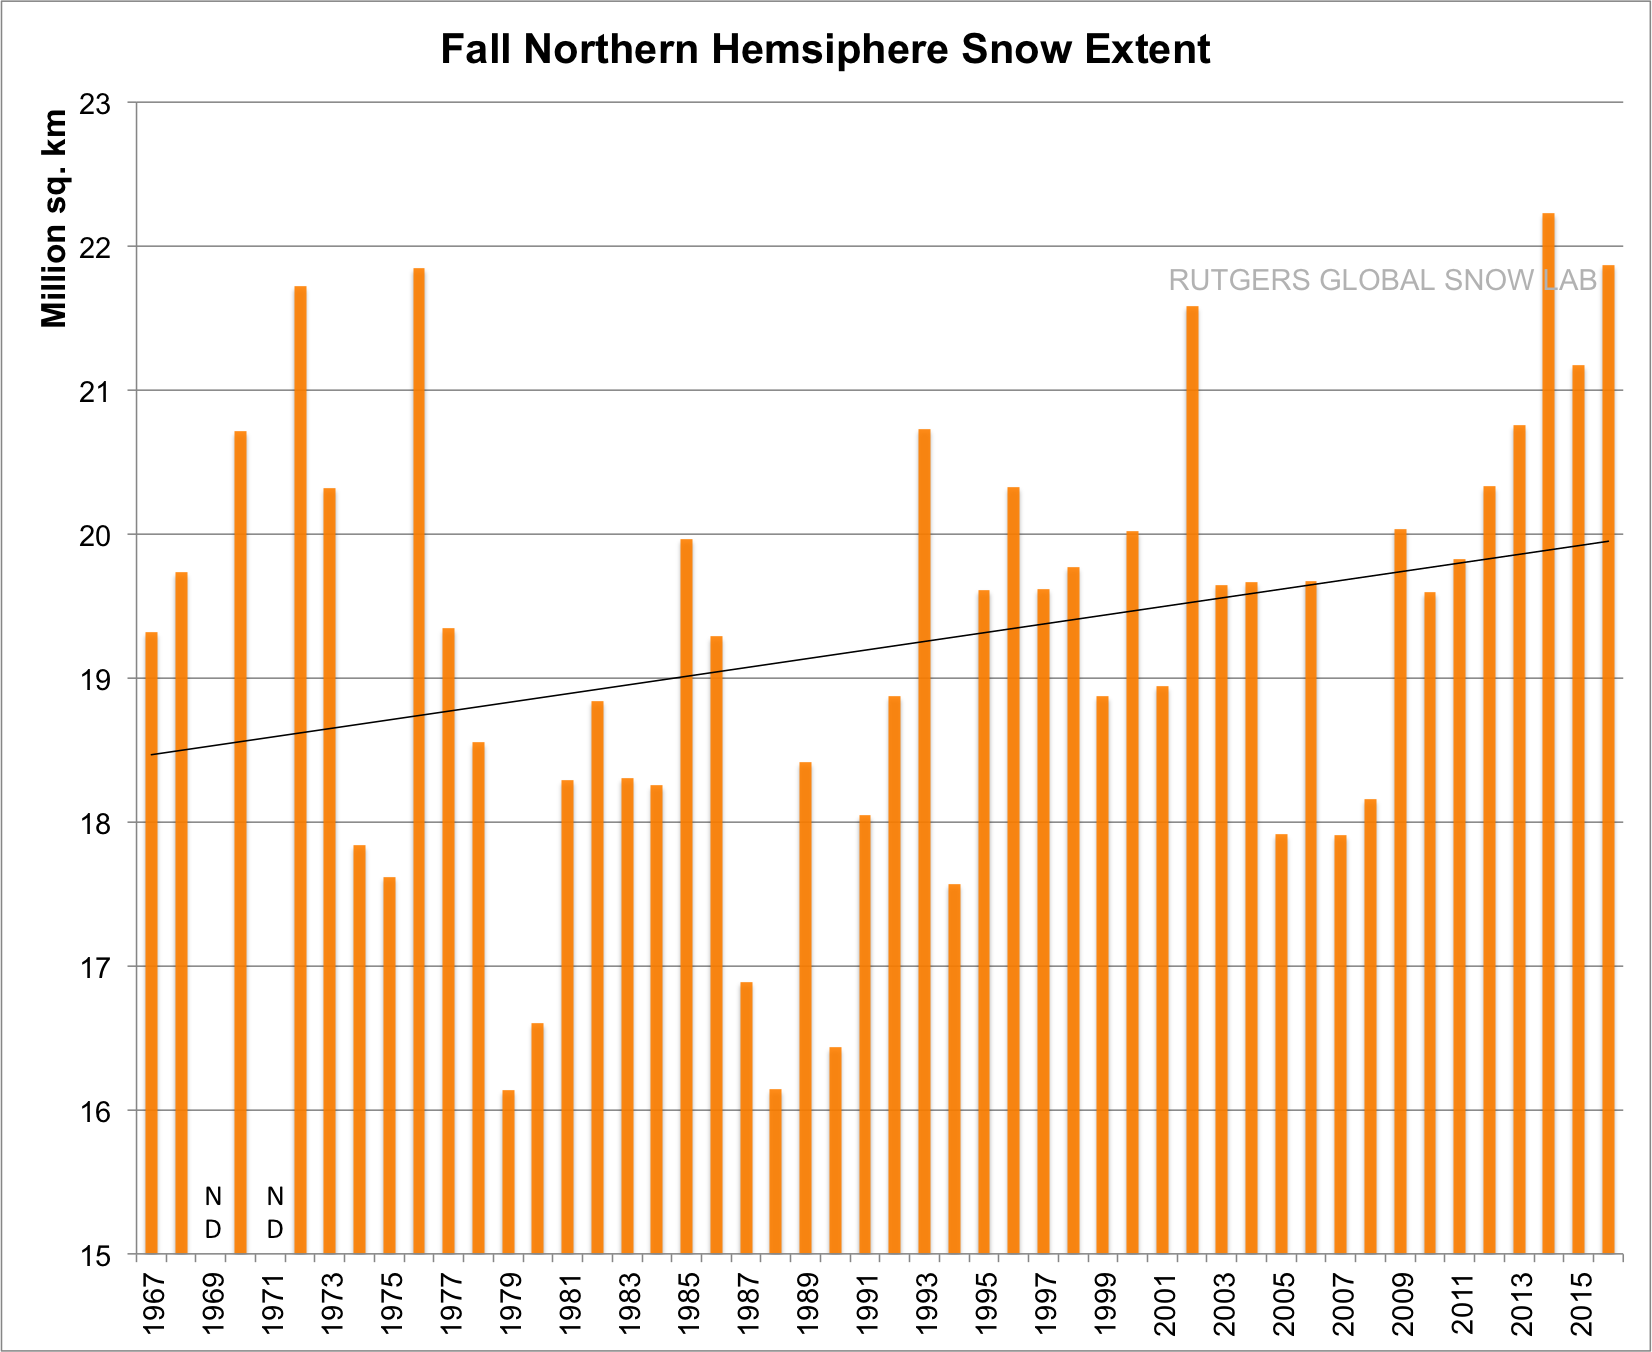
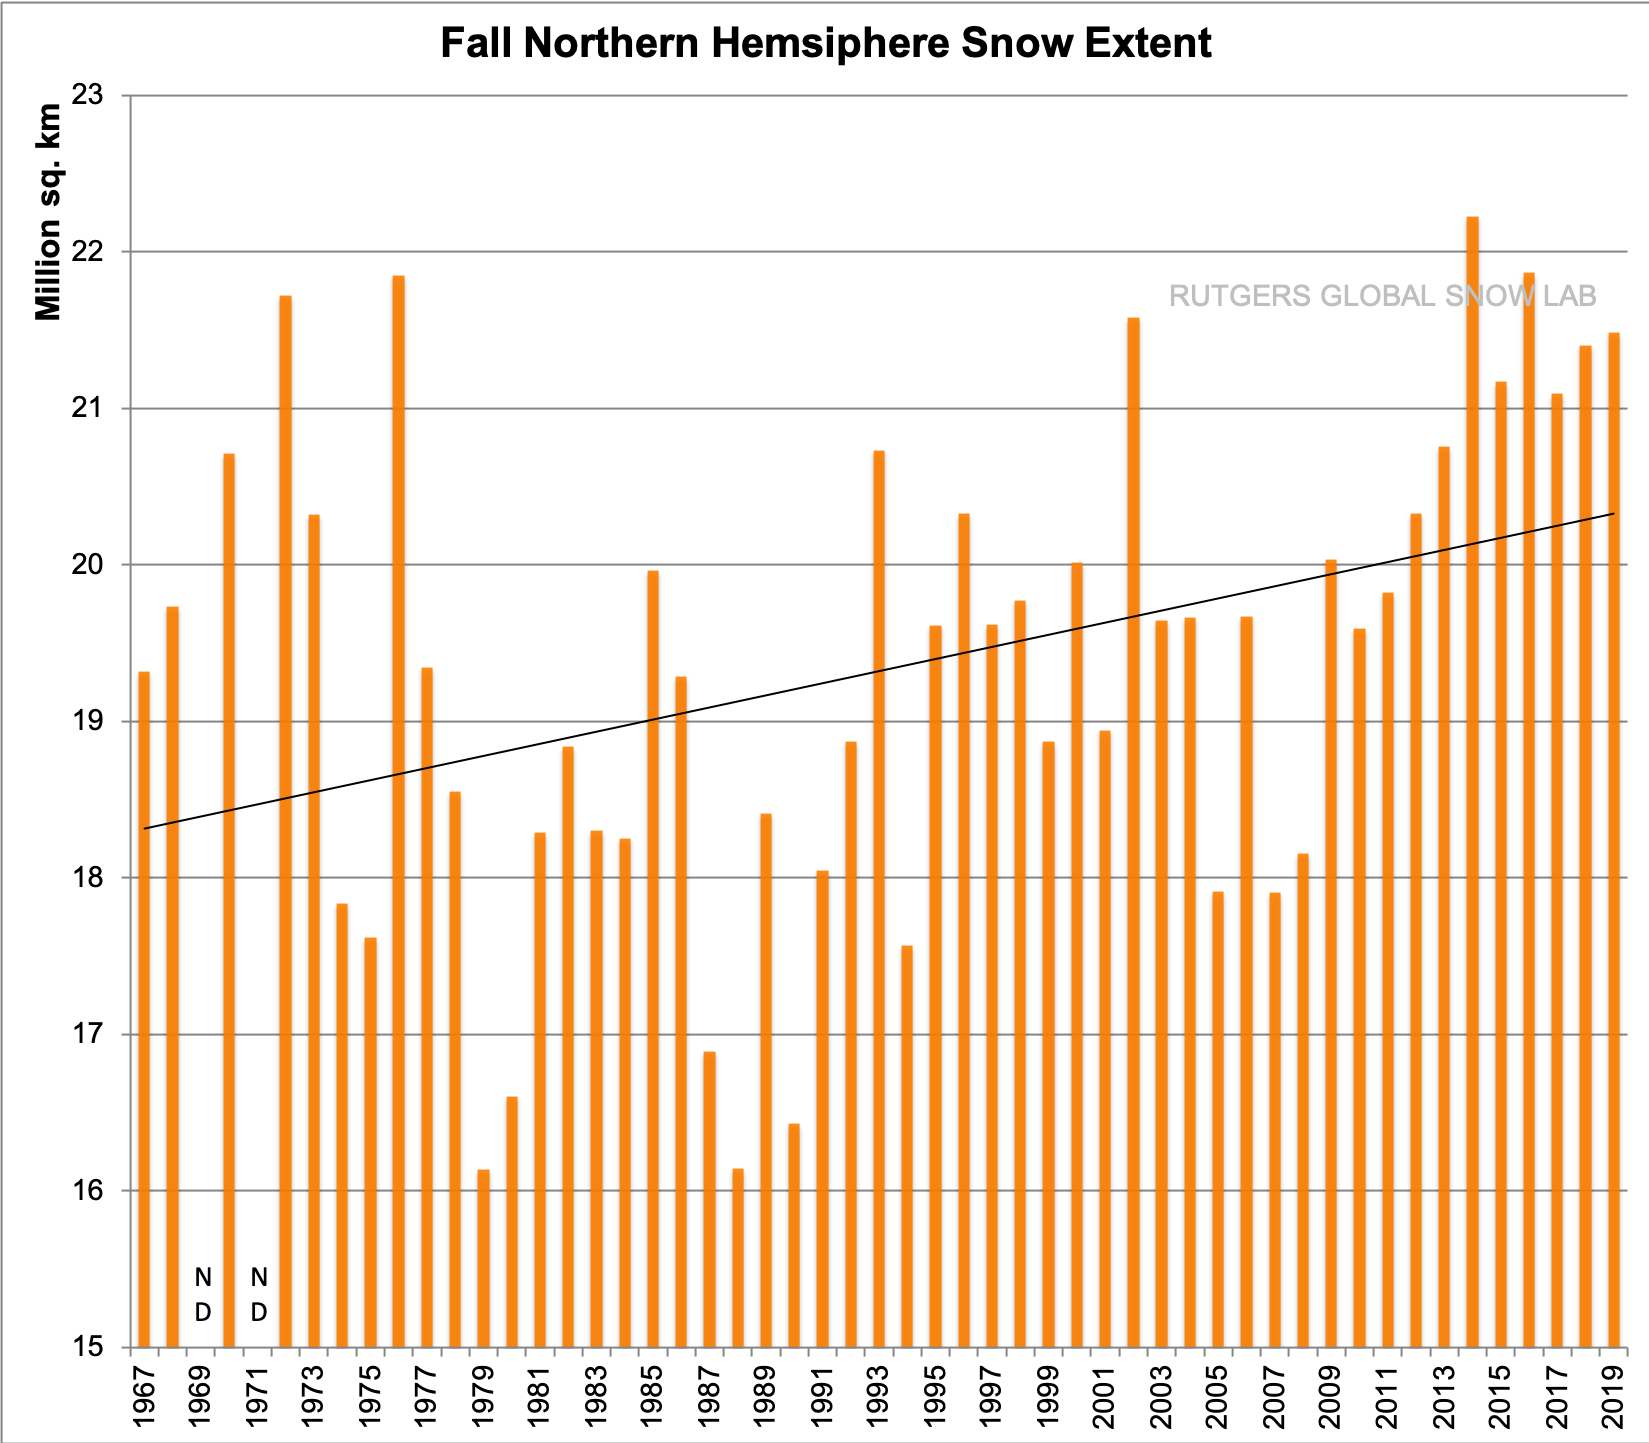
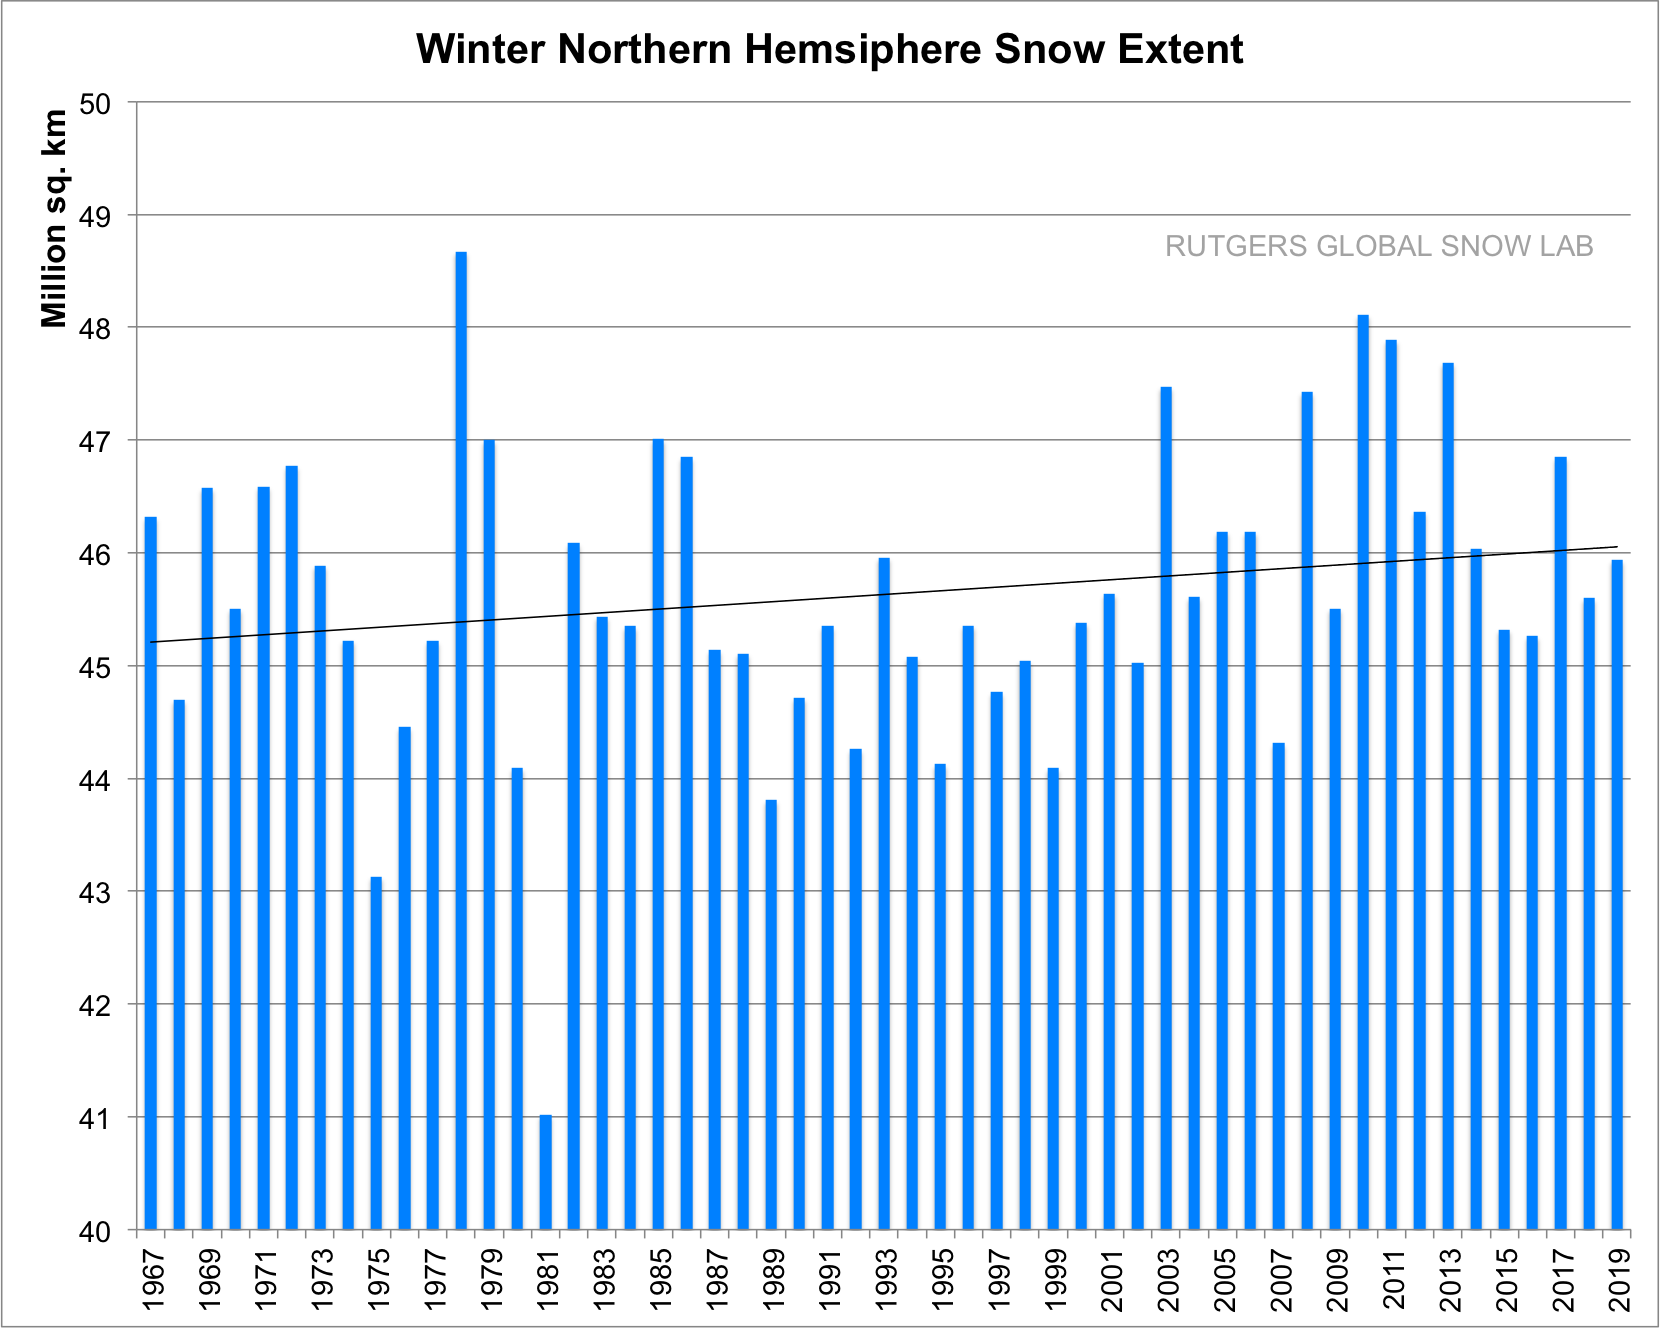
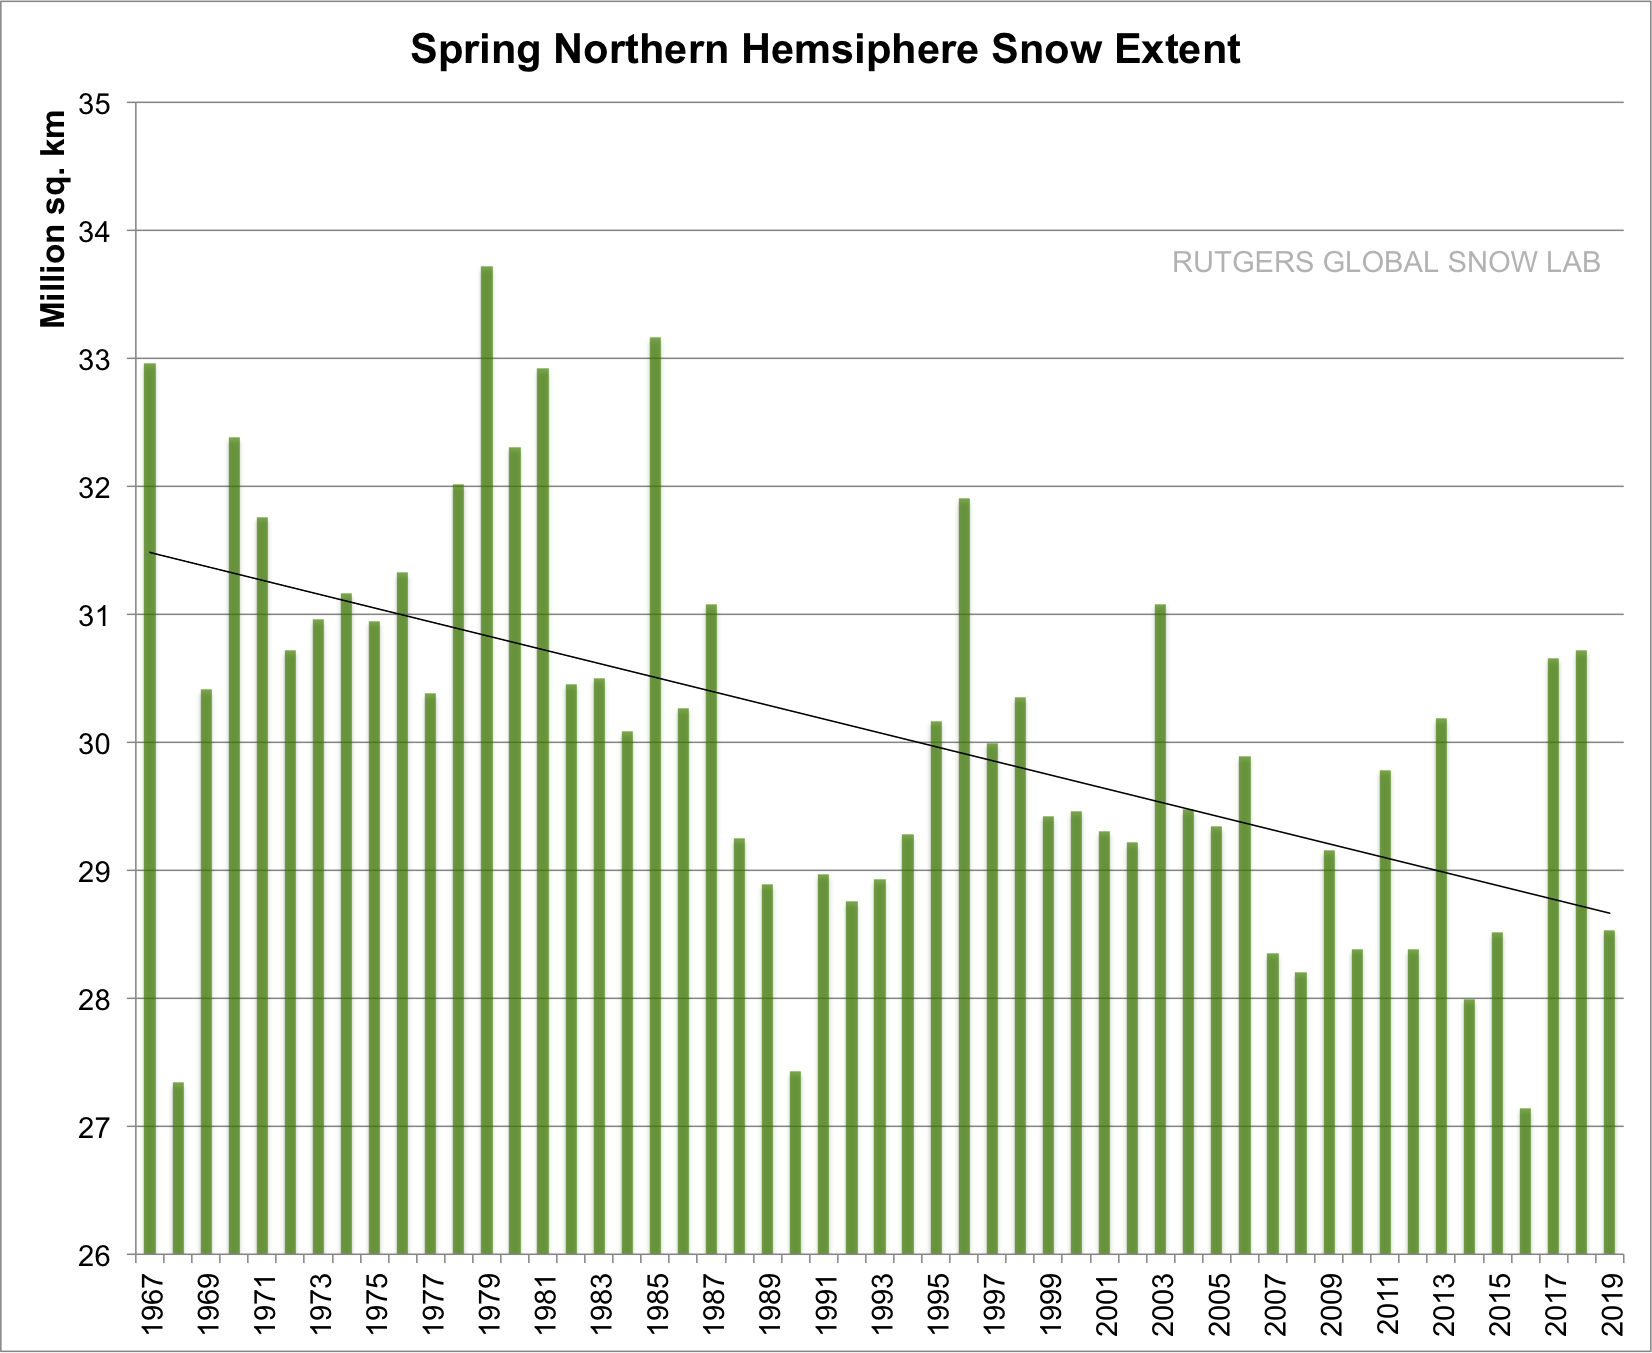
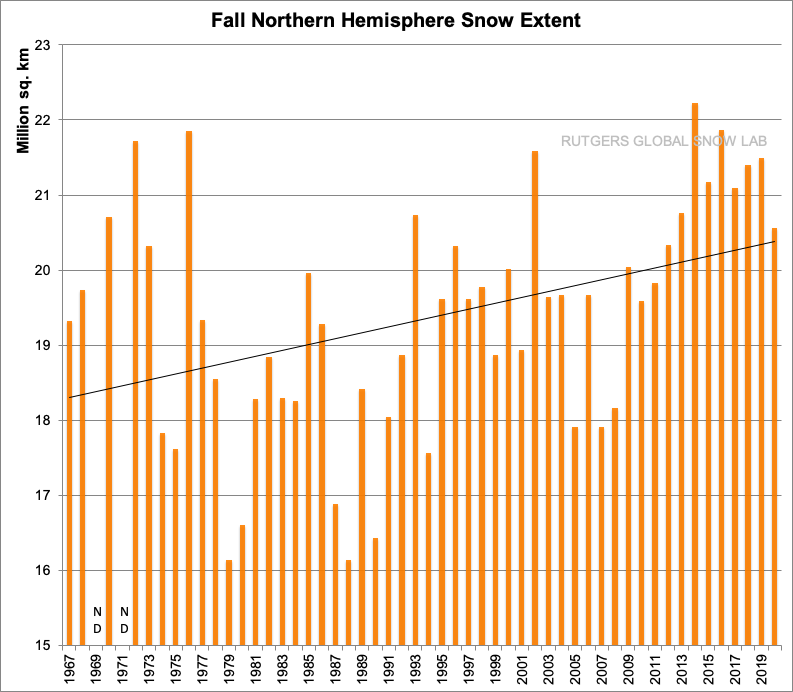
Is the snow cover increasing in the Arctic? Let us see what the snow statistics show. These are from the Rutgers snow lab.
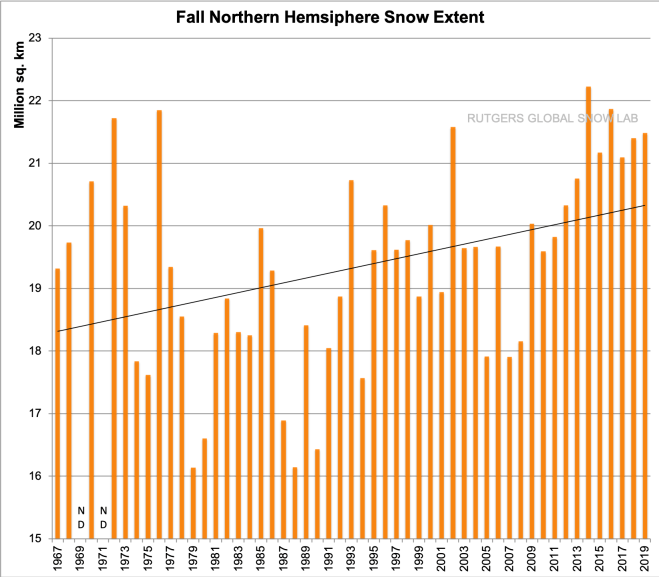
The fall snow extent is increasing by more than 2 percent per year.
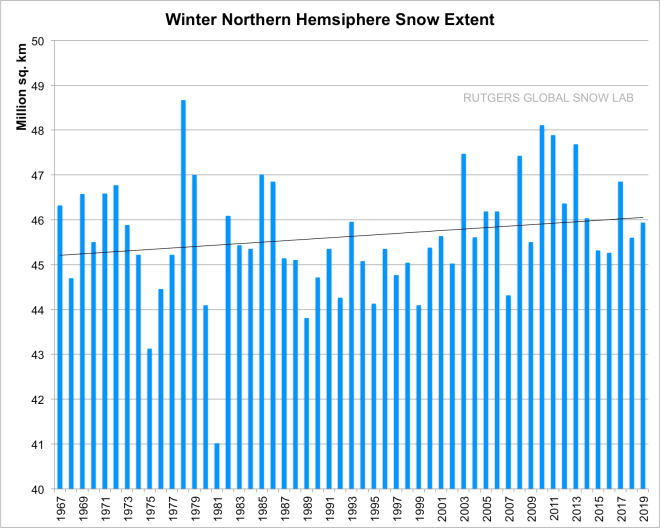
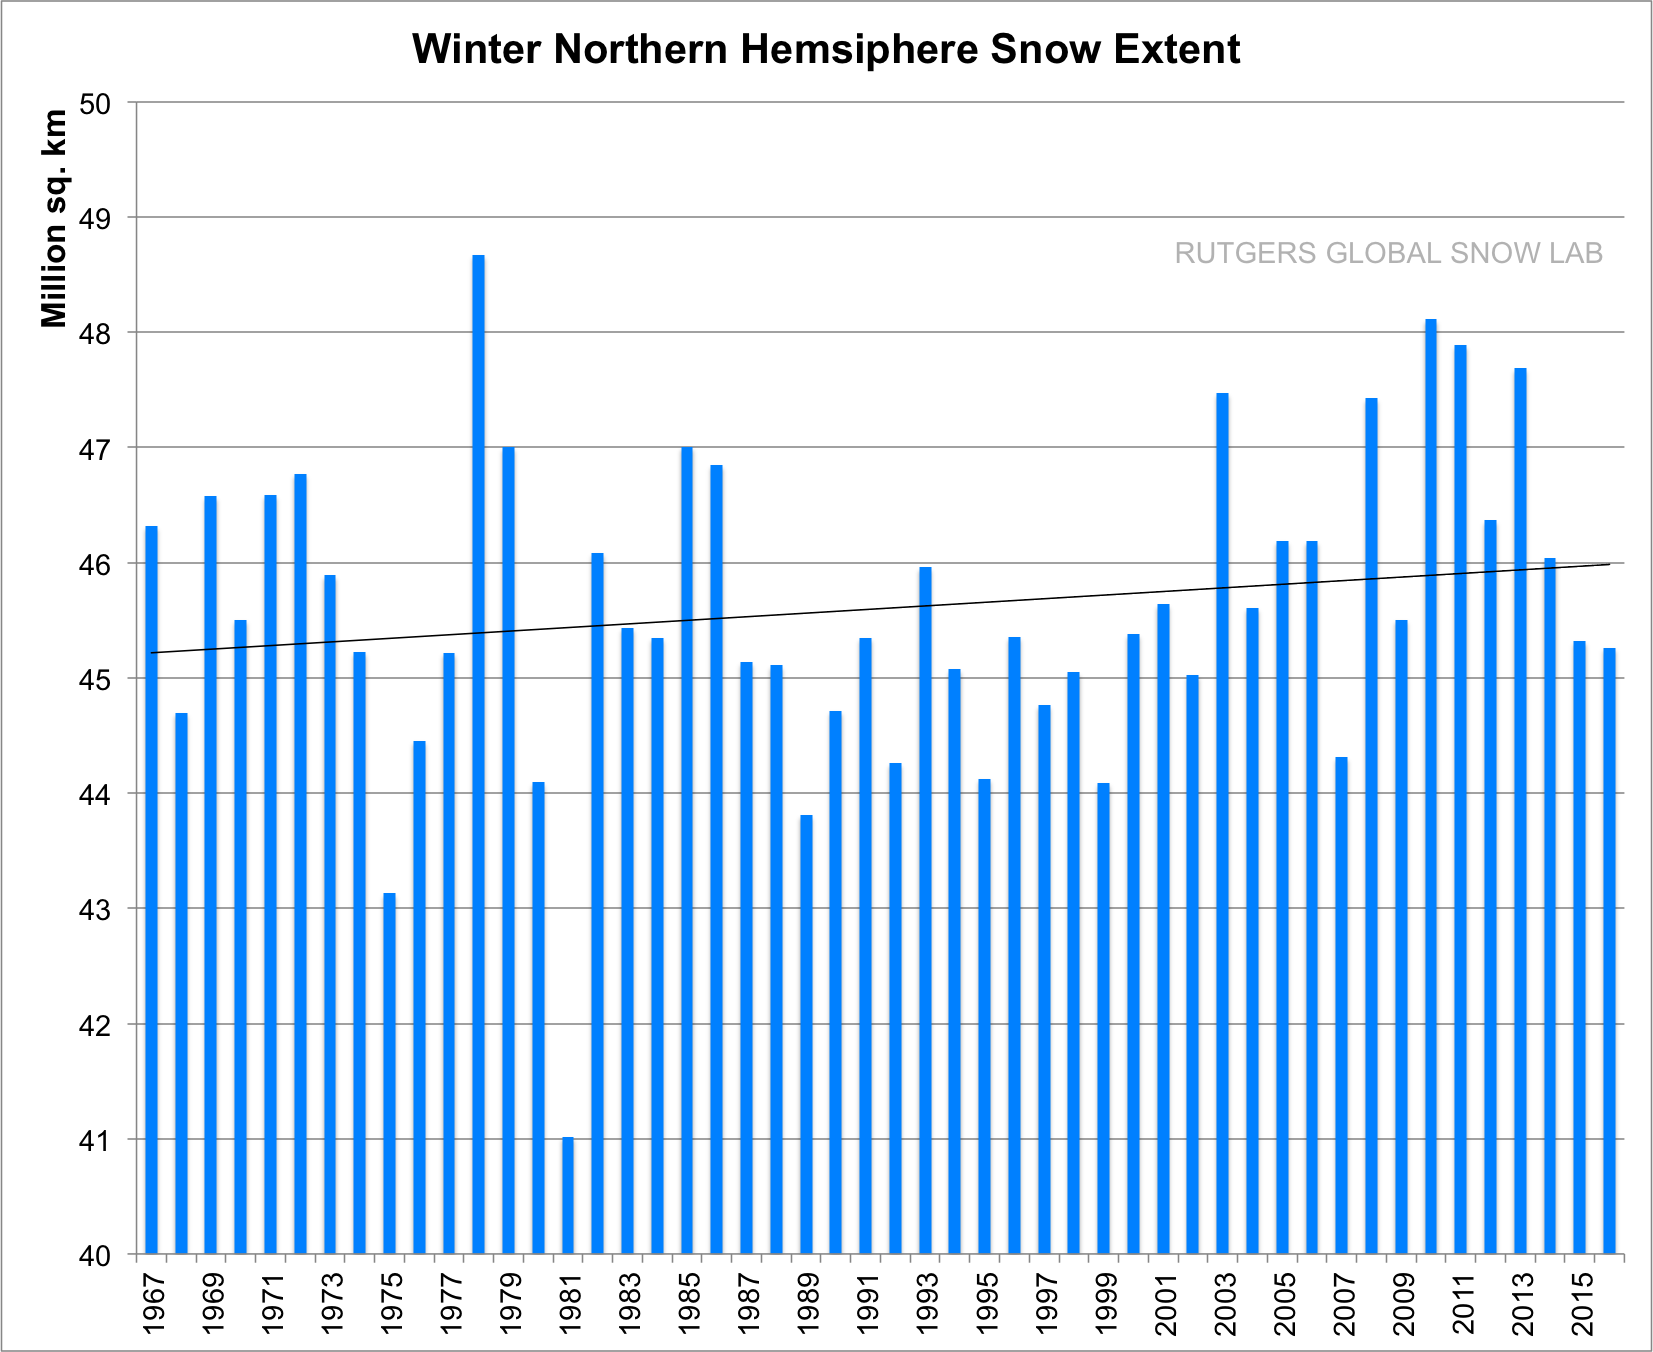
The winter snowfall has also increased but only by 0.04 percent per year.
The snow covers all of Russia, Northern China, Mongolia, Tibet, Kashmir and northern Pakistan, Northern Afghanistan, Northern Iran, Turkey, Part of Eastern Europe, Scandinavia, Canada, Alaska, Greenland and parts of Western and Northern United States.
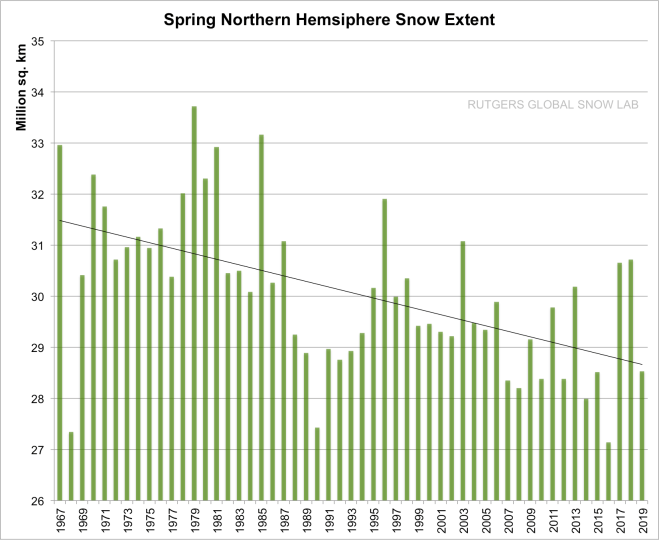
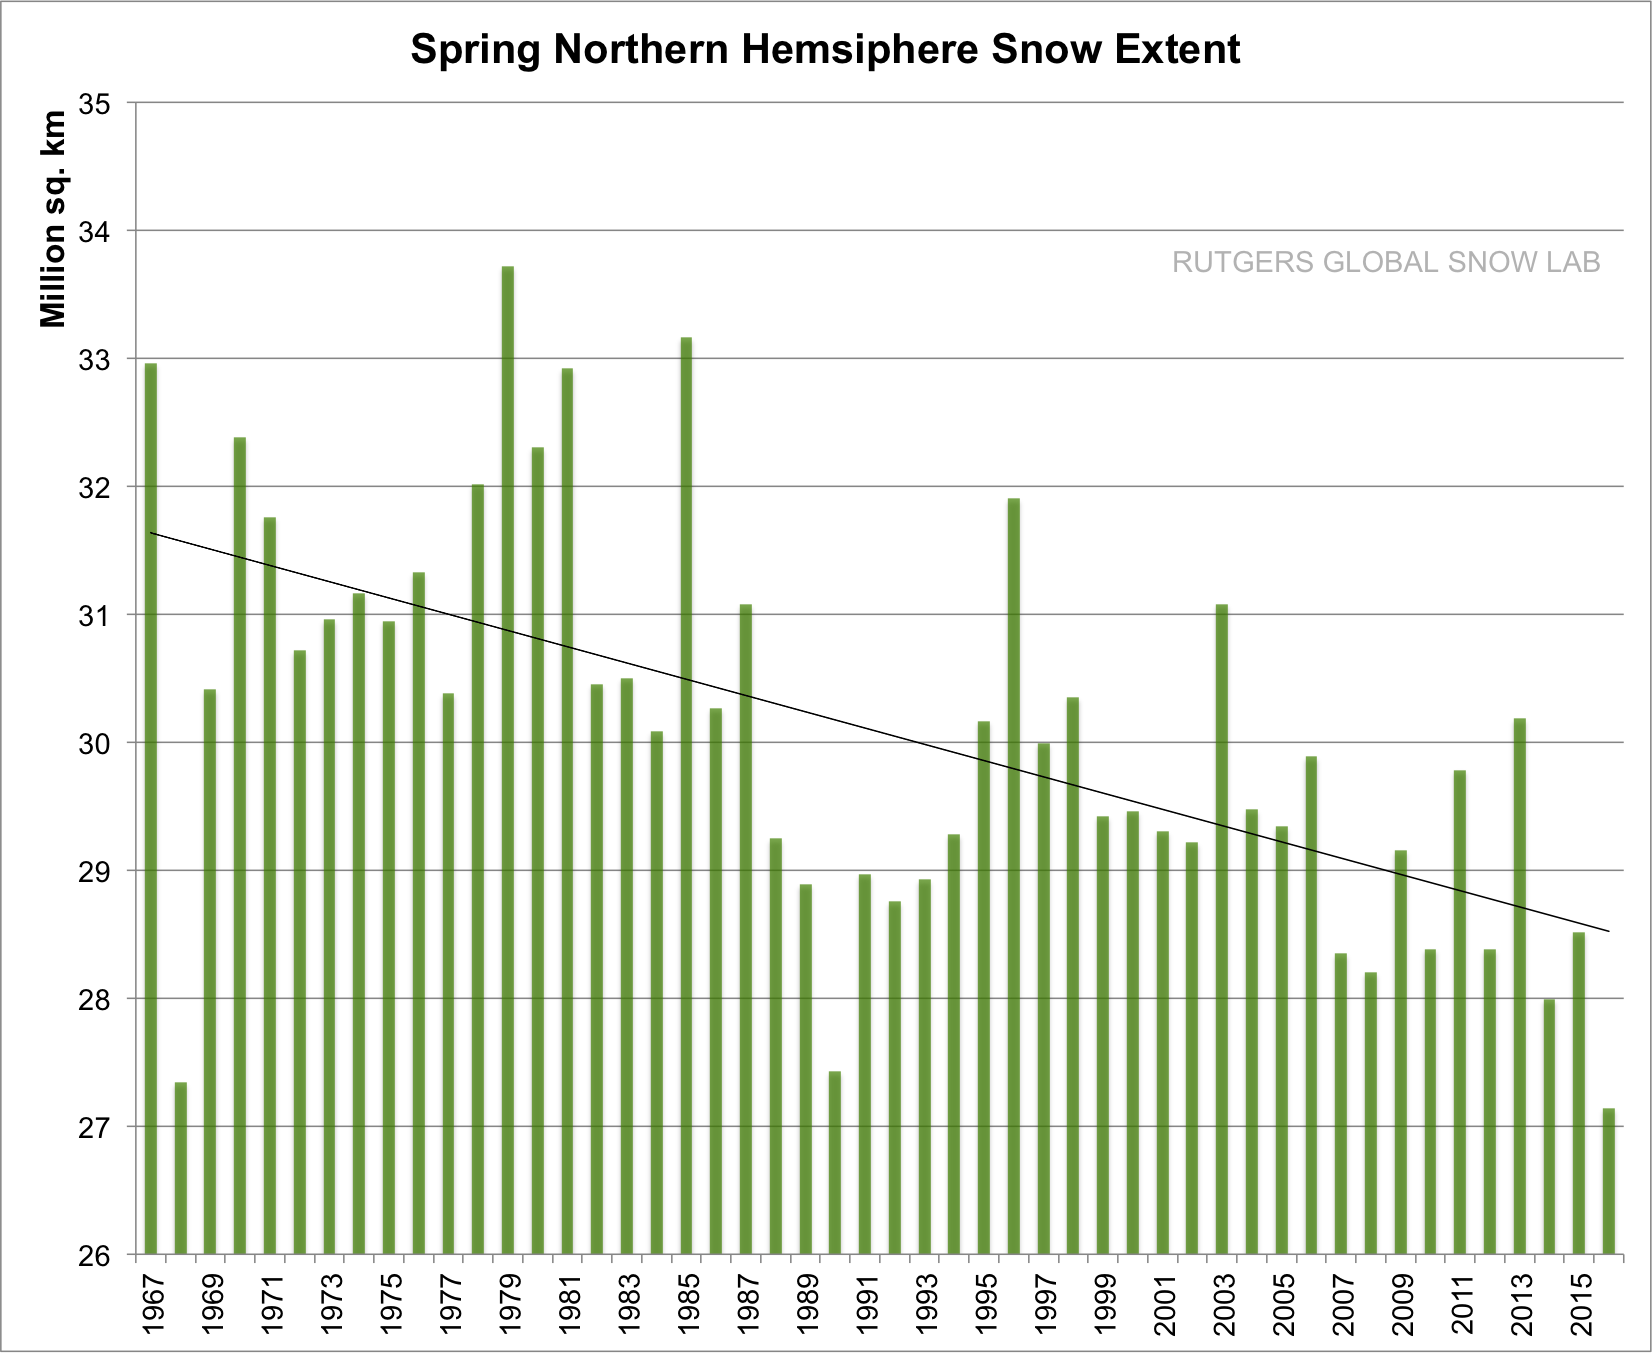
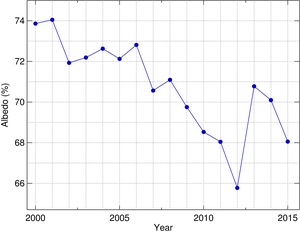
In the spring on the other hand the snow pack is melting faster, about 1.6 percent less snow per year. One of the major reasons for an earlier snow-melt is that the air is getting dirtier, especially over China, and to some extent Russia. The soot from burning coal and mining and manufacturing changes the albedo of the snow. The soot is visible on old snow all the way up to the North Pole. The other reason is that the poles are getting warmer. In the fall and winter it is mostly due to increased snowfall, but in the spring, as soon as the temperature rises over the freezing point, melting occurs.
Moving down to the continental U.S. there are even more good news.
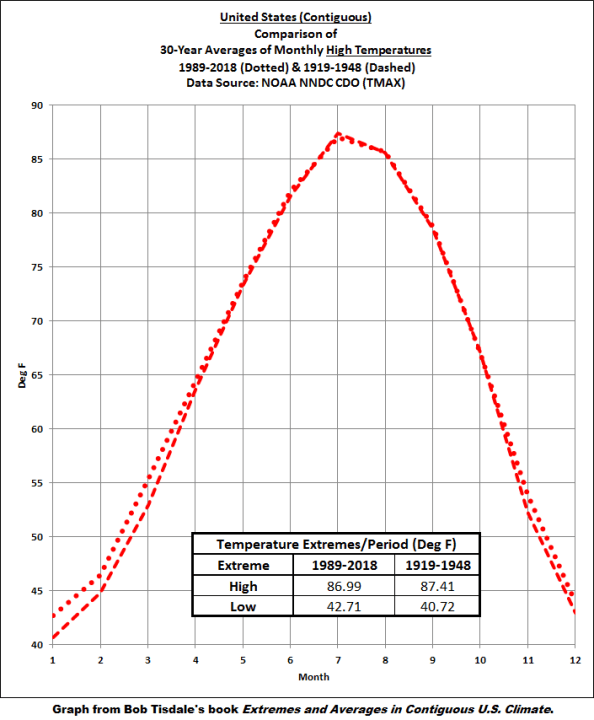
The data presented in the next six graphs were extracted from the data available at the NOAA National Data Center Climate Data Online (NNDC CDO) website.
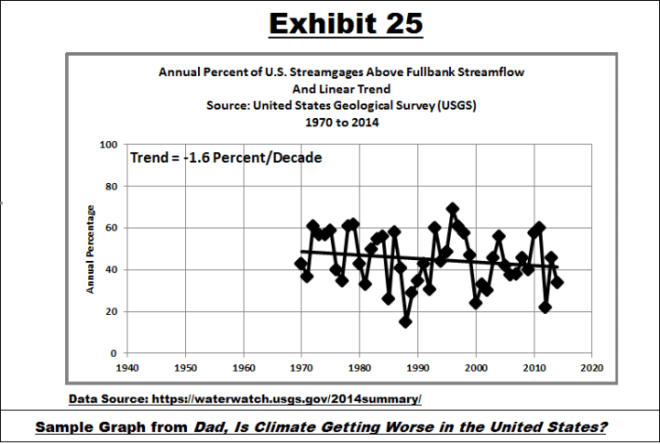
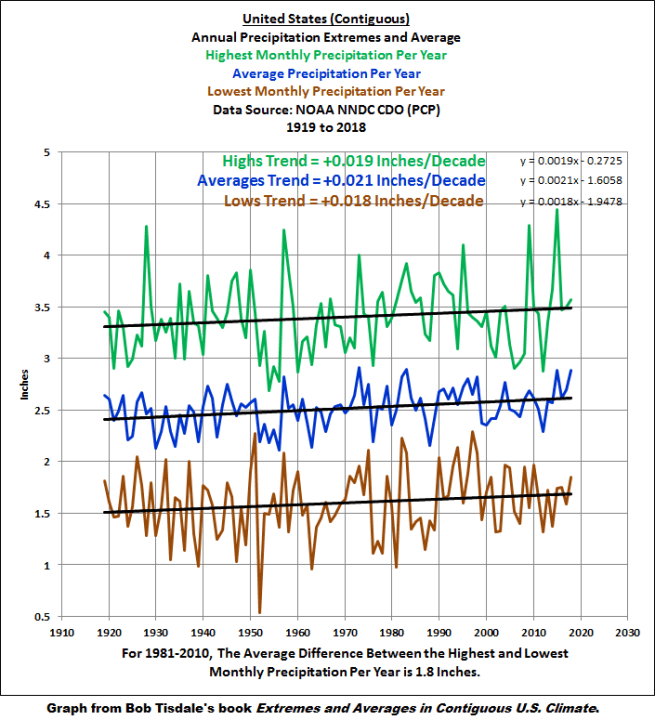 Yes, rain (and snow) are increasing, but it is also raining slightly more often and regularly, so the net result is a slight decrease in flooding.
Of course, this could change in the future, and we need to watch the rain patterns, as they are constantly changing. Building more levees is not always the answer, since this will increase the risk for flooding in other places. It may be necessary to let certain areas, mostly farmland and woodland be flooded from time to time.
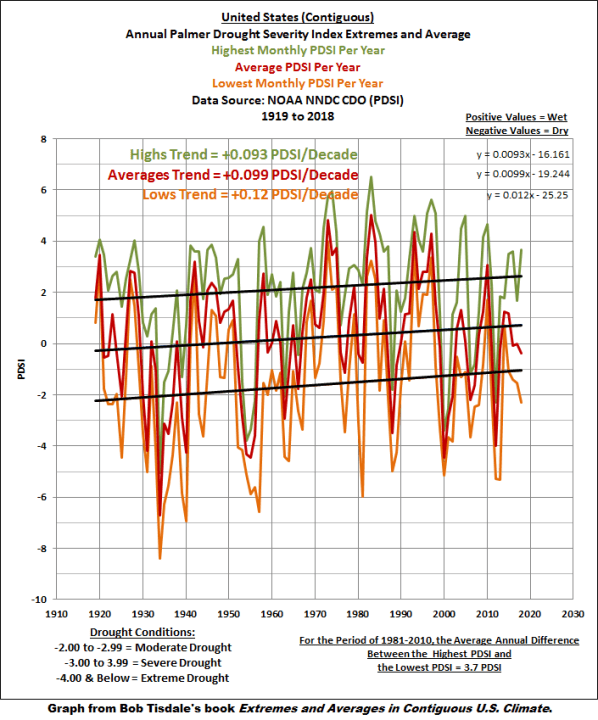
The Palmer Drought Severity Index (PDSI) uses readily available temperature and precipitation data to estimate relative dryness. It is a standardized index that generally spans -10 (dry) to +10 (wet). The chart shows Continental U.S. is getting wetter, about 0.01 PDSI index per year with the lows trend is getting wetter the fastest. This is good news.
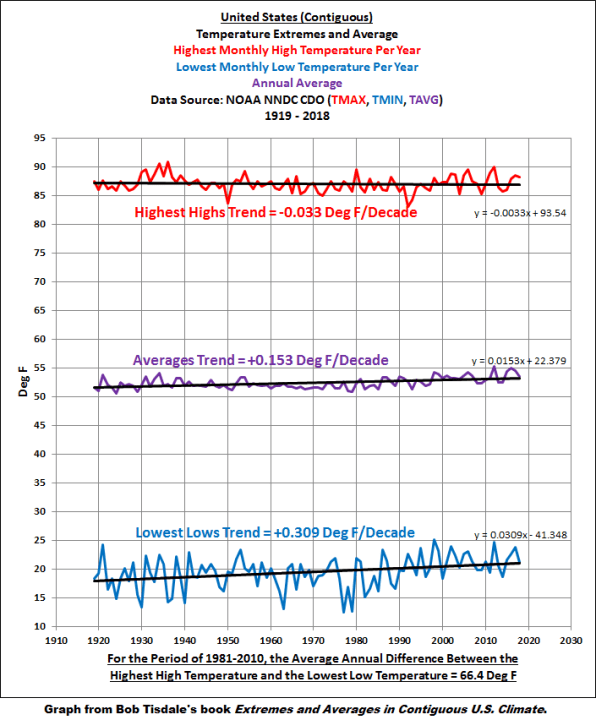
The temperature extremes keep narrowing, the maximum temperatures decrease by 0.033 degree F/decade, but the minimum temperatures increase by 0.309 degree F/decade. This is good, since tornadoes are a result of extreme temperature differences, most often associated with cold fronts.
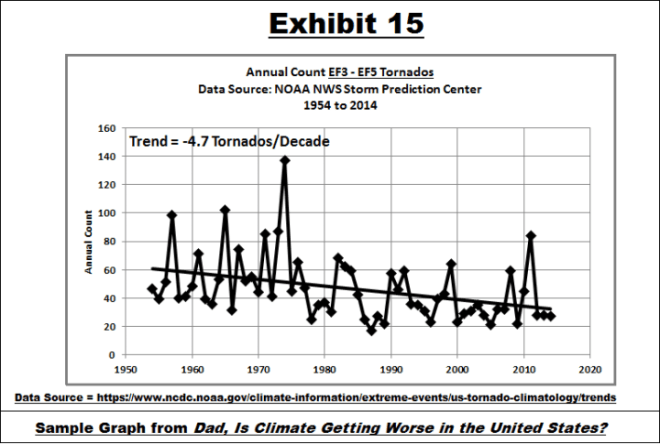
The Continental U.S. has not had an EF5 tornado (the most severe) since 2013. Let us hope this trend continues.
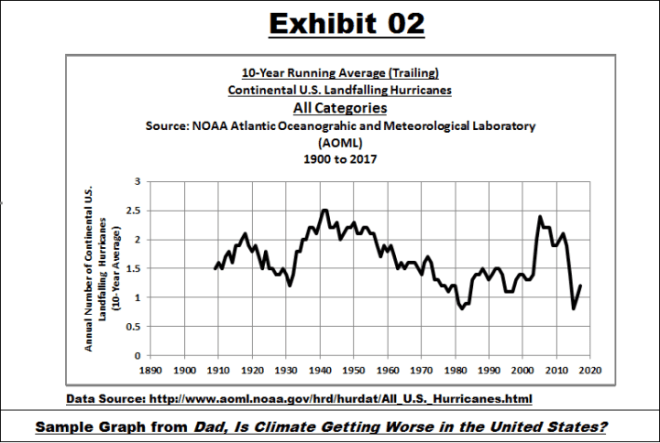
Contrary to popular belief, hurricanes making landfall on the U.S. mainland are decreasing slightly, especially major hurricanes.
Taking a closer look at the seasonal temperature trends we can see that the winter aveerage temperatures are rising by about 0.3F per decade but the summer temperatures rise only about one seventh as much, (0.04F/decade) .
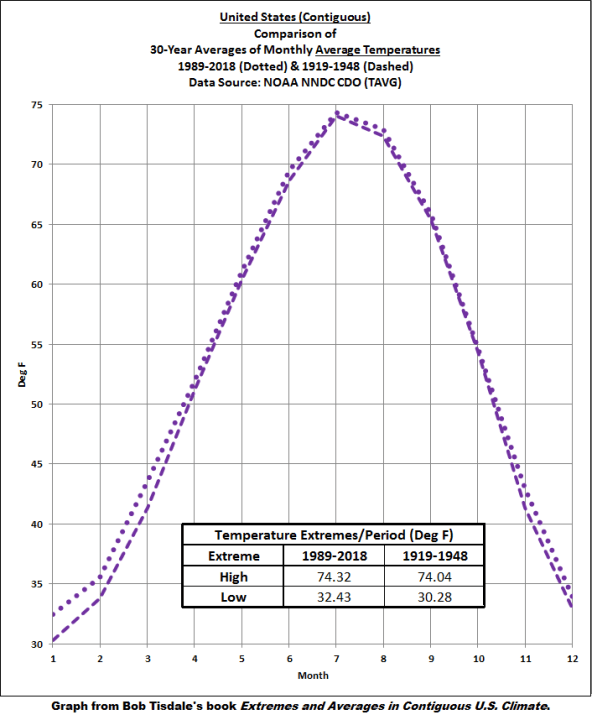
These are the average temperatures. The minimum average temperatures rise in all seasons, but mostly in the winter,
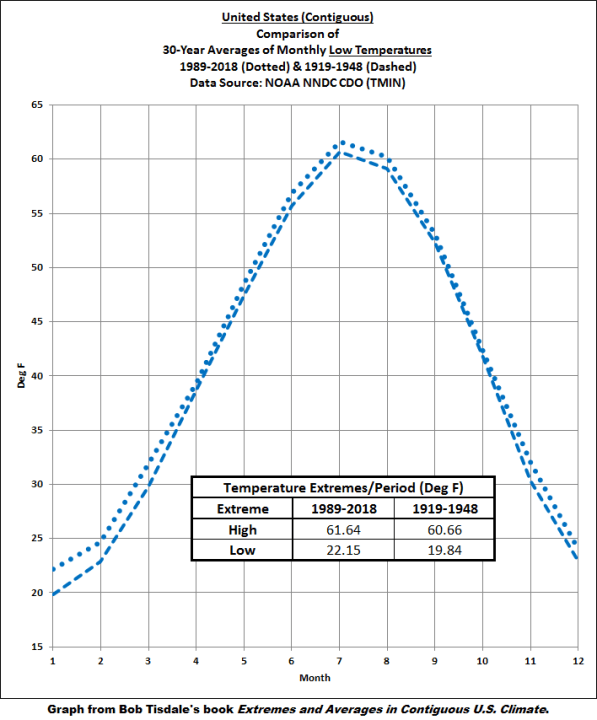
The maximum temperatures barely budge. They rise in the winter and decrease ever so slightly in the summer.
Watching the warming of the poles, and even the continental U.S., far from being an impending end of mankind as we know it, may even be beneficial. Warmer poles in the winter means less temperature gradient between the poles and the tropics, leading to less severe storms. They will still be there, but less severe.
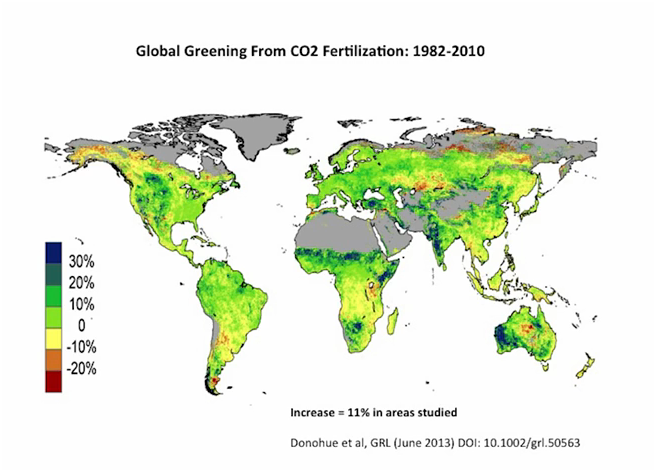
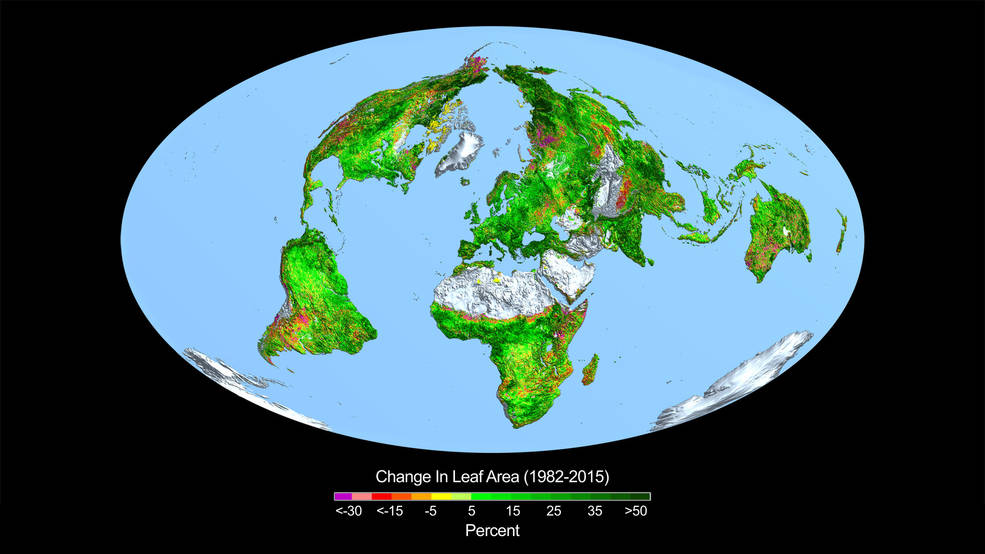
There is one great benefit of increased CO2, the greening of the earth.
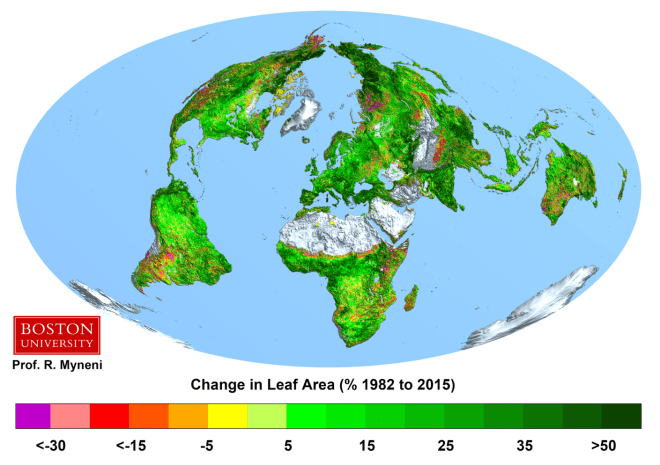
Thanks to this greening, which is accomplished with the fertilizer effect of CO2, the earth can now keep another 2 billion people from starvation, not to mention what it does to plants and wildlife.
Having said that, I am still a conservationist. Coal, oil and gas will run out at some time, and I for one would like to save some for our great grandchildren, not yet born. In addition I would like to minimize the need for mining, which can be quite destructive. We have immense environmental problems, like water pollution, deforestation, intoxication of the soil, over-fertilization with nitrogen, real air pollutants, such as Sulfur compounds and soot, just to name a few. They have one thing in common: It takes lots of energy to do the cleanup.
The best solution is to switch most electricity generation to Thorium molten salt nuclear power. There are multiple reasons why this should be done as a priority by streamlining regulation and facilitate competition in development of the best solutions to the energy problems.
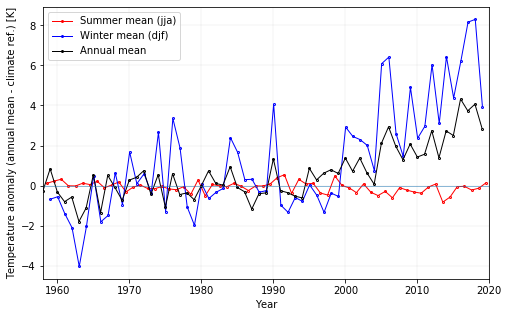
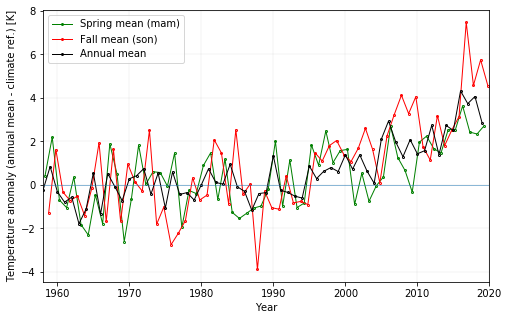
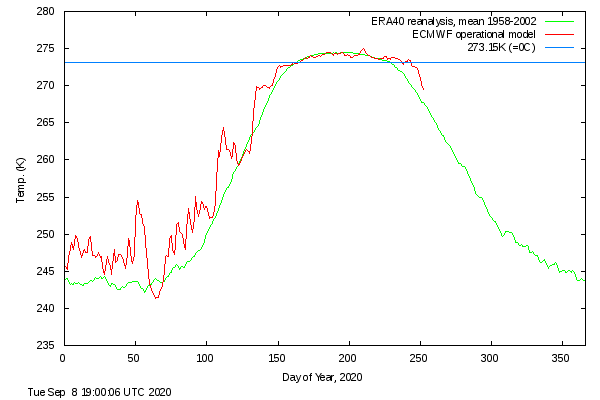


 Source: Danish Meteorology Institute