California has been promoting the sales of “carbon free” electric cars wit subsidies that in extreme cases has been as high as $57,000 per vehicle, mostly a subsidy for the rich. There are now over 1 million electric vehicles on the road. there is one problem. They use electricity, and it has to come from somewhere, mostly from the electric grid, but in emergencies a diesel generator will do.
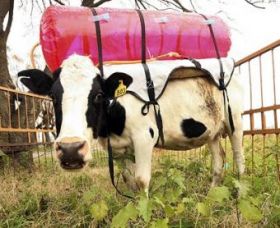
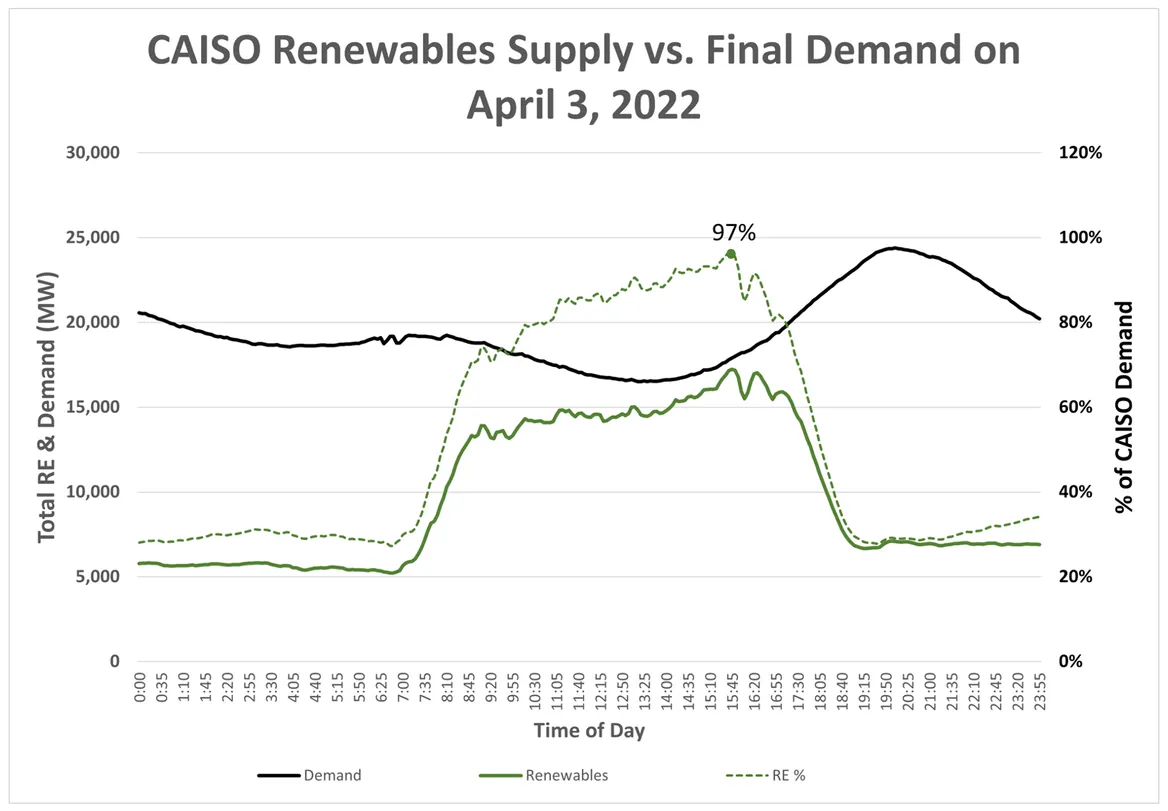
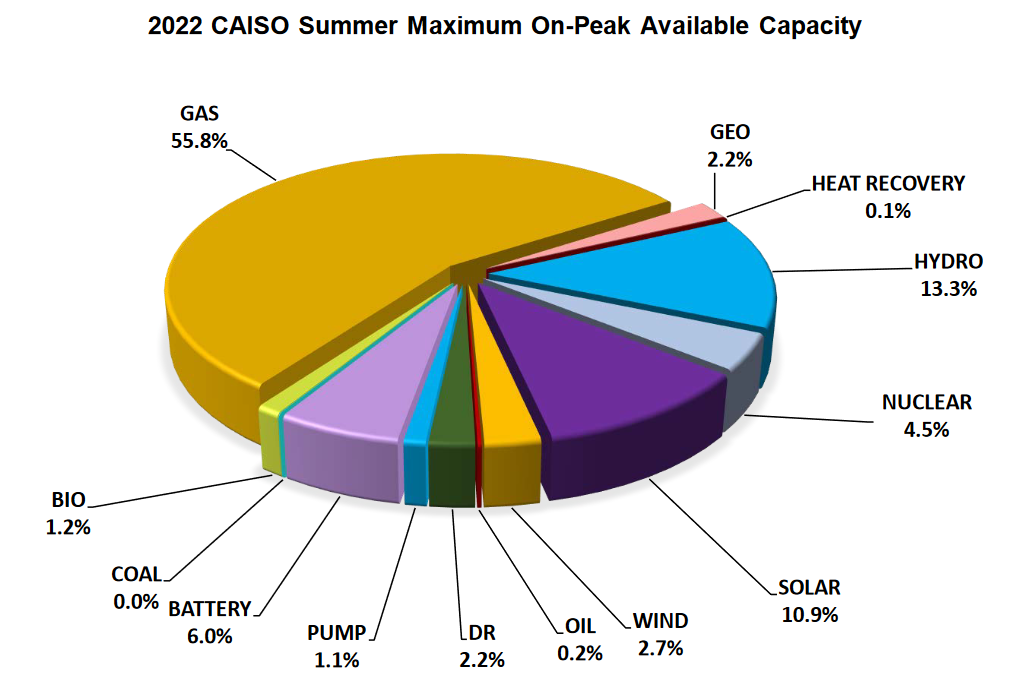
They keep talking of supplying the electricity through renewable power, and on April 3 CAISO reported that the California electric grid was served to 97% by non-hydro renewable non carbon emitting energy sources. This was widely reported, mostly by solar panel providers showing that we are on our way to a wonderful carbon free future. See the chart below.
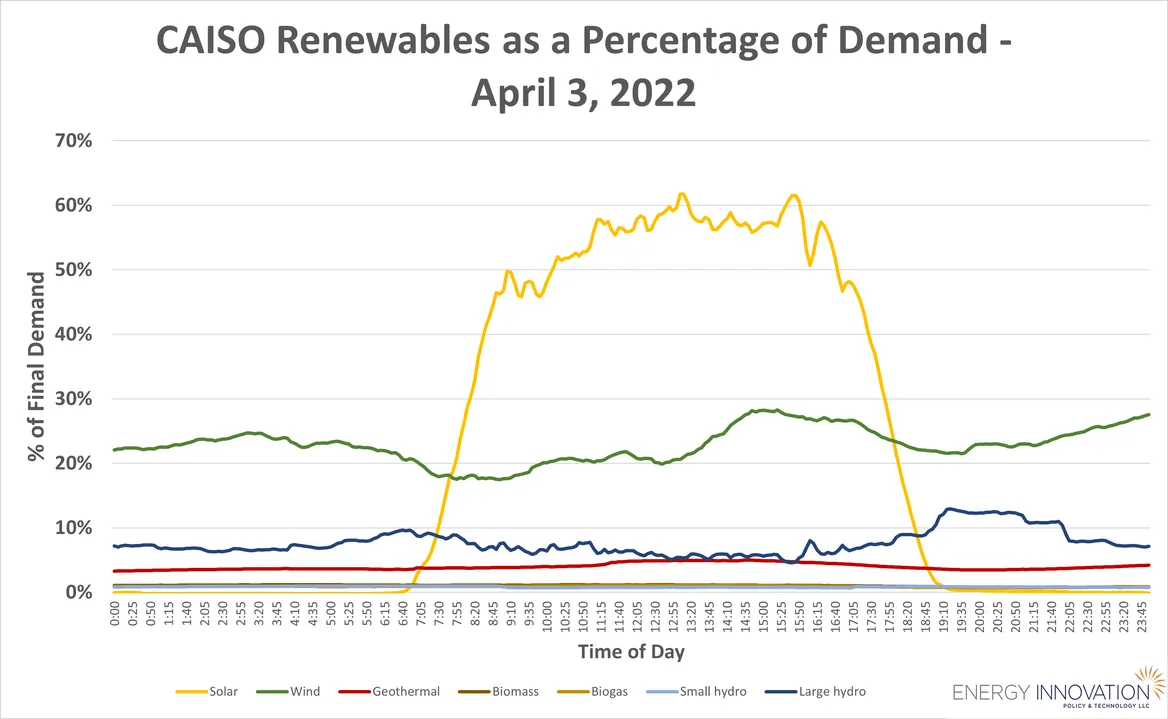
Another way to look at it is to see the renewable sources individually
With the addition of electric cars as grid users, they have to be recharged. This will occur at dinner time for most people, coming home, connecting the car, take a shower, run the air conditioner, run the washer and dryer, and watch TV, the time when the grid is already most strained and the solar panels have stopped supplying energy.
It has already happened once this March that some electric companies in California has asked their customers to not recharge their cars for fear the grid would collapse, see here.
How big is the problem? The Western Journal reports that at least ten states are at risk of major electric outages this summer, among them California with an expected power shortage of up to 1,700 MW during peak hours, see here. California has an ambitious program to build up its capacity in the next ten years, but with the addition of electric cars needing recharging it ia not enough. Here is their proposed build for the next ten years.
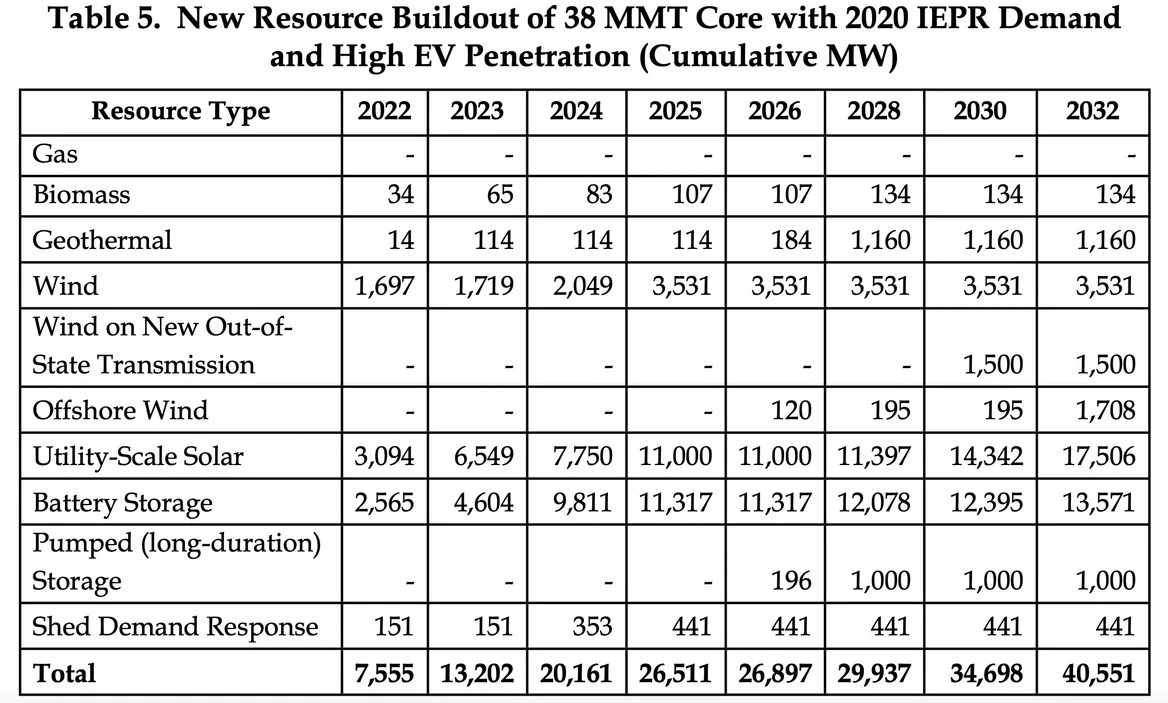
The plan is ambitious. Coal is already eliminated as a source of energy. There will be no new Natural gas plants, even for peak power. The remaining two nuclear plants will be decommissioned in 2024 and 2025. From now on they will rely on solar power and battery storage to make the grid “carbon free”.
But there is one big problem. The American South-west is drying up. Lake Mead can only provide power from seven of their 17 turbines, and water is getting lower and lower reducing power output. Lake Powell is precariously close to lose its power generation capacity altogether, the water is that low. But California has a lot of reservoirs:

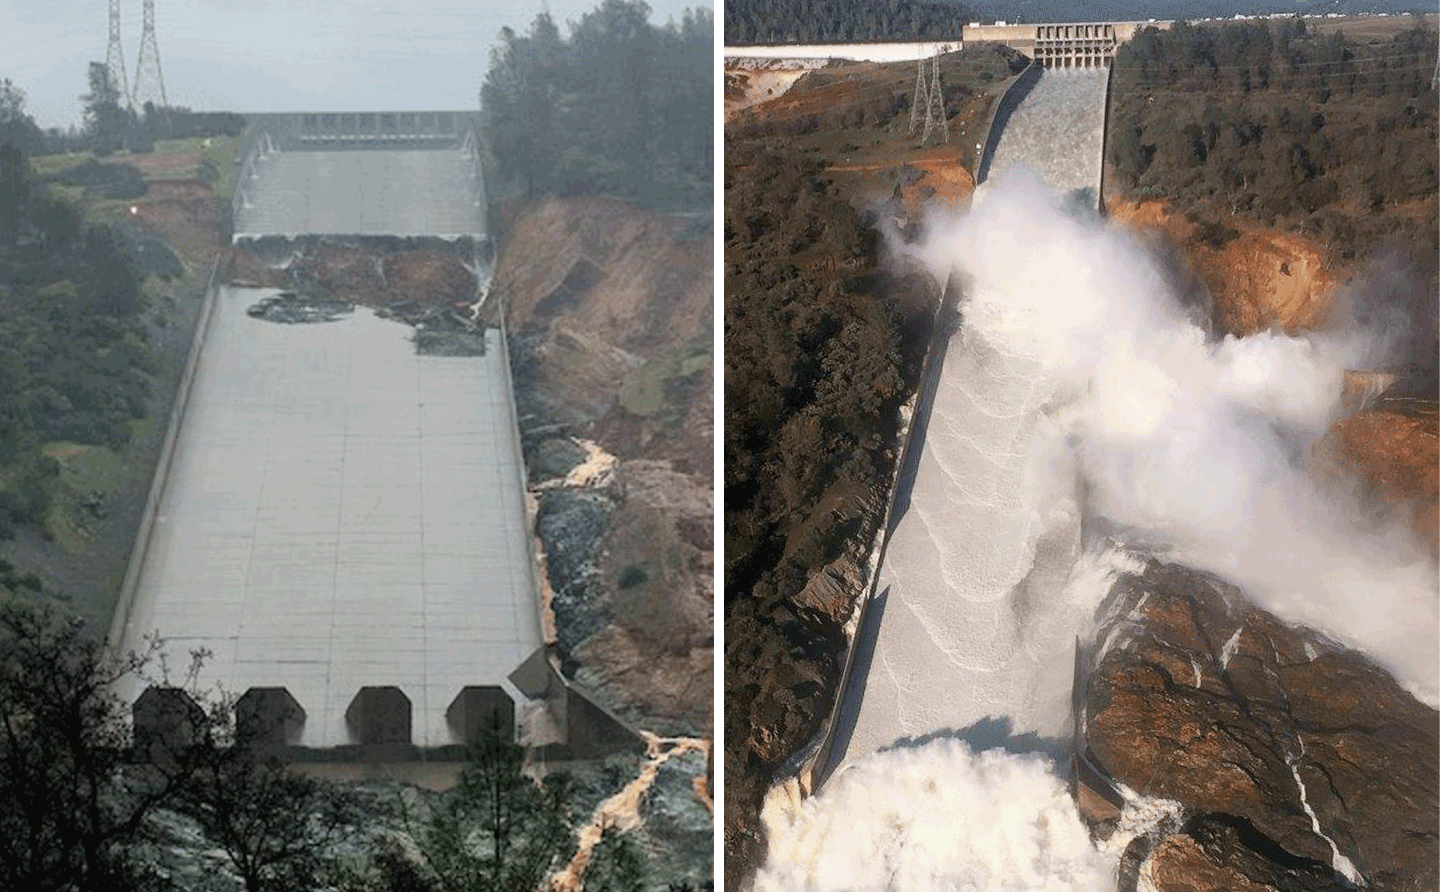
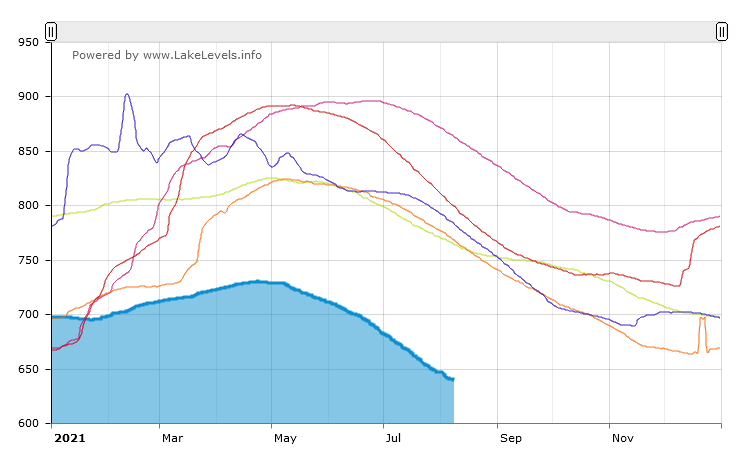
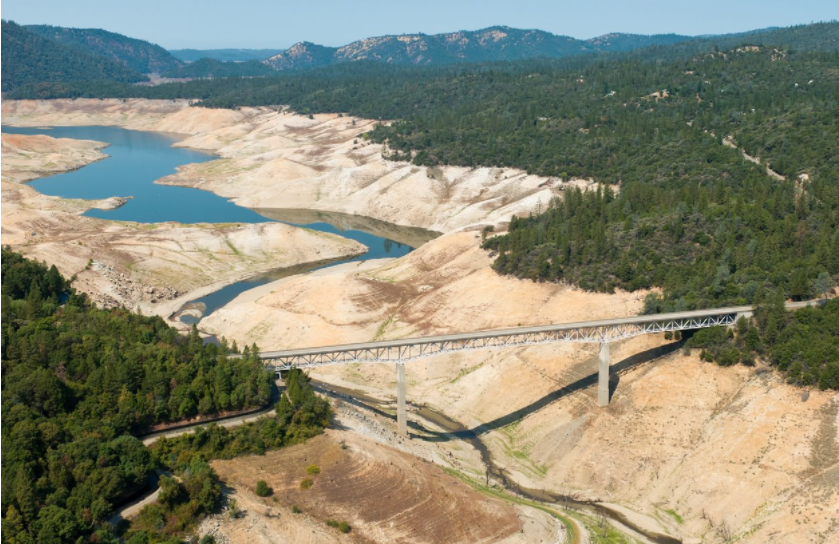
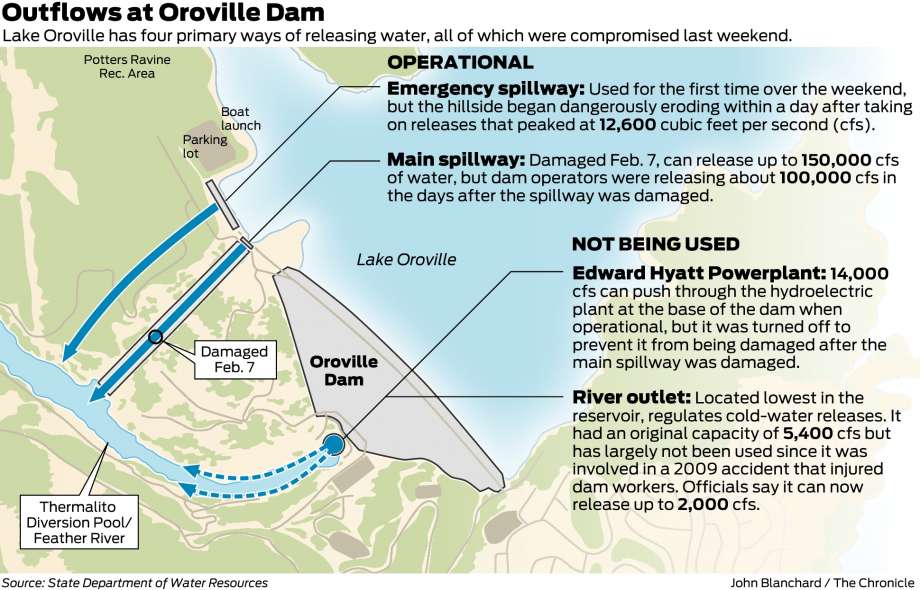
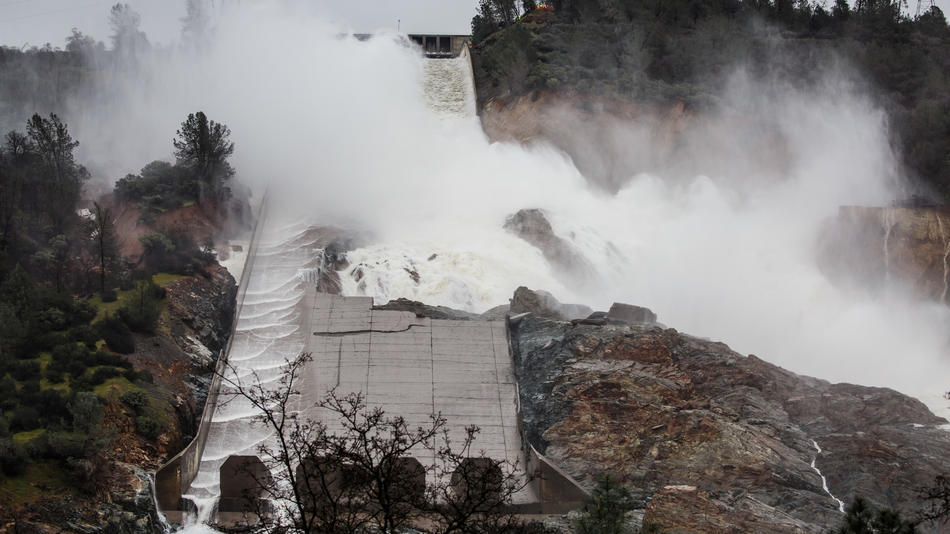
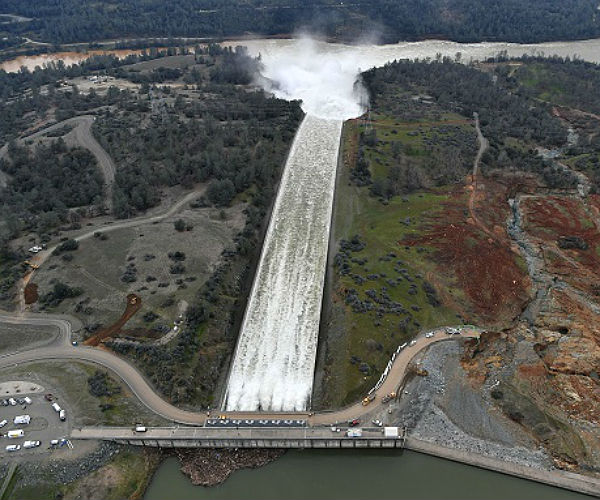
Unfortunately, most of their water levels are well below seasonal average and are in danger of being unable to provide any power at all in late Summer, like Lake Oroville did last year. Lake Oroville is one lake that has pumping storage, but they let the water levels fall below even the lowest pumping levels.
Historically California has imported a lot of its electric energy, and has one of the highest transmission losses in the nation. but all the surrounding states suffer a similar drought, so hydropower will be hard to obtain. Luckily, the surrounding states have not abandoned all of their coal burning plants, so they are happy to sell peak power to California for up to a dollar a kWh when the demand is high. Even at that price the supply is limited, so California will have to resort to rotating brown and blackouts this summer.
Here is the
Let’s take a look at each of the compounds that contribute to the electric supply and the future trends
Geothermal energy. Limited by available sources.
Heat recovery. Very limited
Hydroelectric power. Lake Mead and Lake Powell are drying up. In then years they are gone unless we do something. There will still be some water in the Colorado River, but the storage is gone. The desertification of the American Southwest will ensure hydropower is diminishing.
Nuclear power. The 2 last remaining Nuclear power plants will be decommissioned in 2024 and 2025.
Solar energy power. This is rapidly growing and will provide an increasing percentage of the total power, but not during peak demand which is in the evening.
Wind power. The best locations are already taken. Wind is good when it blows, but useless on a calm day. During storms sometimes some windmills will have to be shut off because there are no customers for the extra power.
Oil power is negligible and essentially only used as emergency backup power for hospitals and other vital systems.
Demand Response shutoffs. This will have to be increased to maintain a stable grid. California has very few industries that only operate when the cost of electricity is low, so to increase this it will have to be done through variable pricing, like charging two dollars a kWh or so for recharging your car during peak demand.
Pumped storage. The last major pumped storage facilities were made in the 1970’s. Since then it has always been more economical to provide peak power using natural gas. With natural gas prices tripling and still rising it is again worth looking at increasing the pumped storage. California has many dams. they should be upgraded to not only provide water and hydroelectric power, but also provide pumped storage. The best way to do this is to build lower, much smaller dams and pump up water from the lower to the upper reservoir during excess energy production and reverse the flow during peak demand. The energy losses for peak power are 15 to 20%, much less than the price differential between excess power and peak power. There is only one problem. The reservoirs are running out of water when they are needed the most, like in this period of drought.
Battery storage. California is making big investments in batteries, like a contract to supply more than three GW of battery storage. It is not cheap. The cost for batteries is about $1,250 per kWh, so assume the batteries will last 4 hours the investment by my estimate is about 15 billion dollars. The prices for batteries are set to increase rapidly as the supply of raw material is limited, especially Lithium and Cobalt. Since the weight of stationary batteries is unimportant, there will have to be developed lower cost alternatives for stationary batteries. And the research is intense to develop better batteries that do not require as much mining of rare resources.
Coal, California does not use coal anymore for electricity production, but it imports a lot of electric energy, some of which is generated by coal plants. In addition, this power comes from far, far away, so the transmission losses are substantial.
Biofuel. There will be better uses for biofuel than to burn it to produce electricity. Some of it is far too valuable as raw material for recycling. But it takes a lot of power to recycle properly, yet it is necessary to recycle and clean up the environment.
Natural gas. In the past natural gas supplied all the remaining power needed. With the addition of solar and wind, the amount of gas needed was reduced sufficiently still meet the electricity needs. This was fine until solar and wind could supply more than 100% of the electricity needs. The extra energy must then be stored in batteries or peak storage, or that energy would be wasted. This means that from now on every added solar panel or wind turbine must come with an equivalent amount of battery or pumped storage. So to supply the first 10% of California’s electric power needs with solar and wind was cheap, from now on it will be all about battery and pumped storage.
What to do?
The American Southwest has started its desertification. Lake Mead and Lake Powell are soon but a memory. With extreme conservation measures, and limiting water for all, eliminating nearly all irrigation farming and limiting new building the desertification can be lowed down but not halted. Once it has started it will run its course and render the place that was the fastest growing part of America almost uninhabitable for people that want to take showers every now and then, enjoy gardening and having fresh food to eat.
So here is my proposal:
The first is to build a Transcontinental aqueduct, up the Arkansas River to the Colorado River via Arkansas, Oklahoma, New Mexico and Arizona, supplying water and peak power on the way.
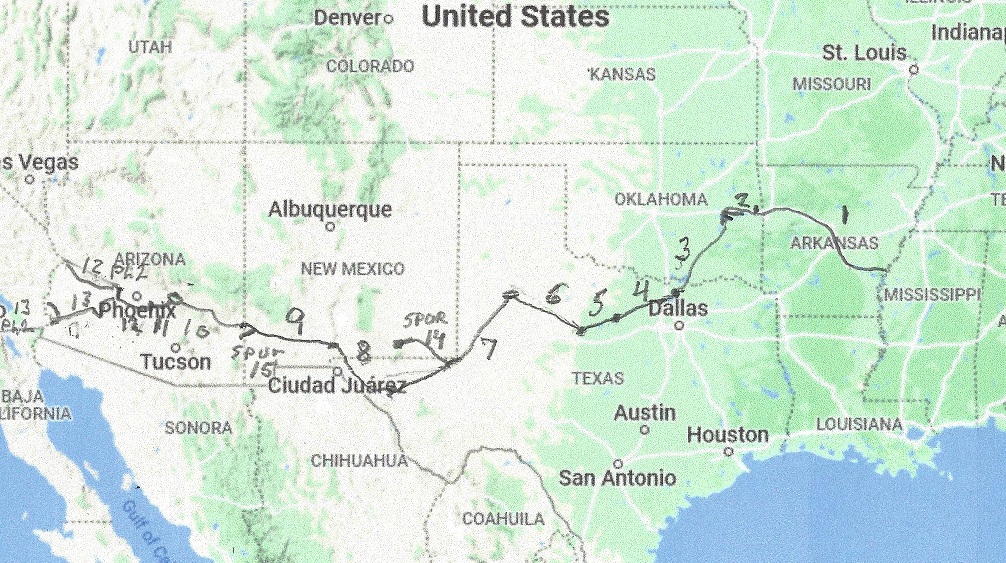
For a detailed description, see here.
Secondly, build a Trans-Rocky Mountain Aqueduct, up the Arkansas River via Arkansas, Oklahoma, Kansas, Colorado, and New Mexico, to the San Juan River, a tributary to the Colorado River.
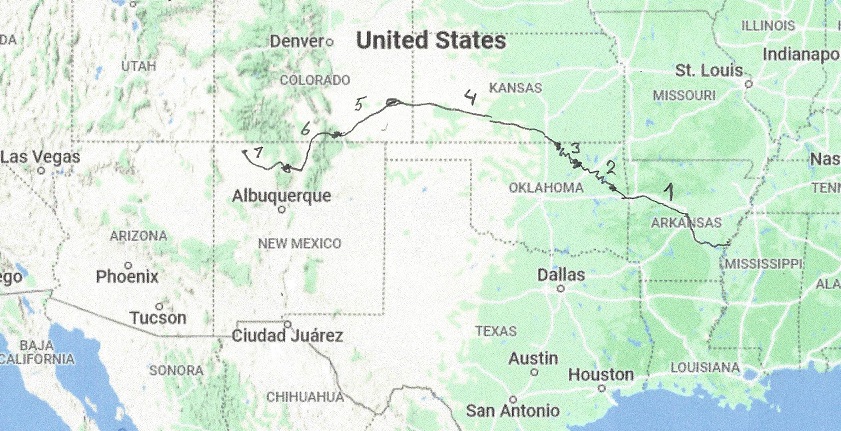
For a detailed description, see here.
The Transcontinental aqueduct will provide over 10 million acre-feet of water to the dry Southwest, triple the nation’s pumped water storage and allow the South-west to grow again. The Trans-Rocky Mountain will do likewise, and together they will allow the south-west to keep growing for at least another 50 years. Together with a smaller project , the South Platte river aqueduct they will save the Ogallala aquifer and allow it to keep producing crops for generations to come.