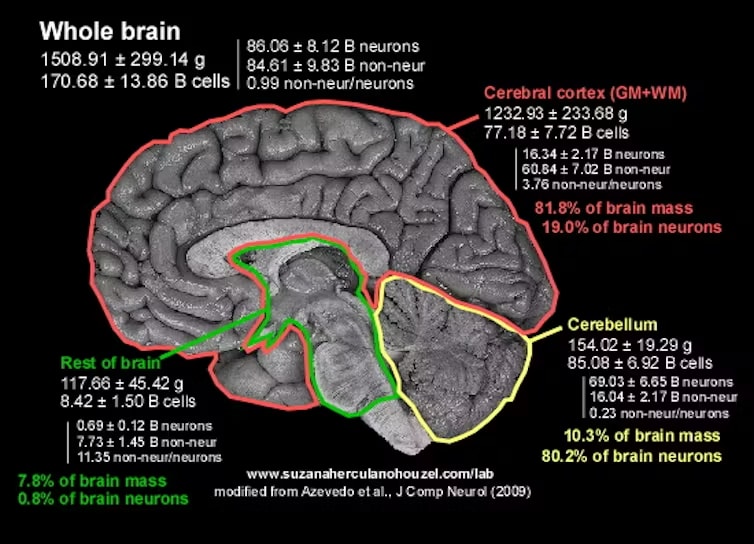
We were created by God in his image with an expanded brain, capable of lifelong learning. This included a spiritual connection directly with God through His Spirit. This is the connection that died when Adam sinned and people decided they could function quite well without constant communication with God. Yet there remained a god-shaped void in their brains, a longing that wanted to be satisfied.
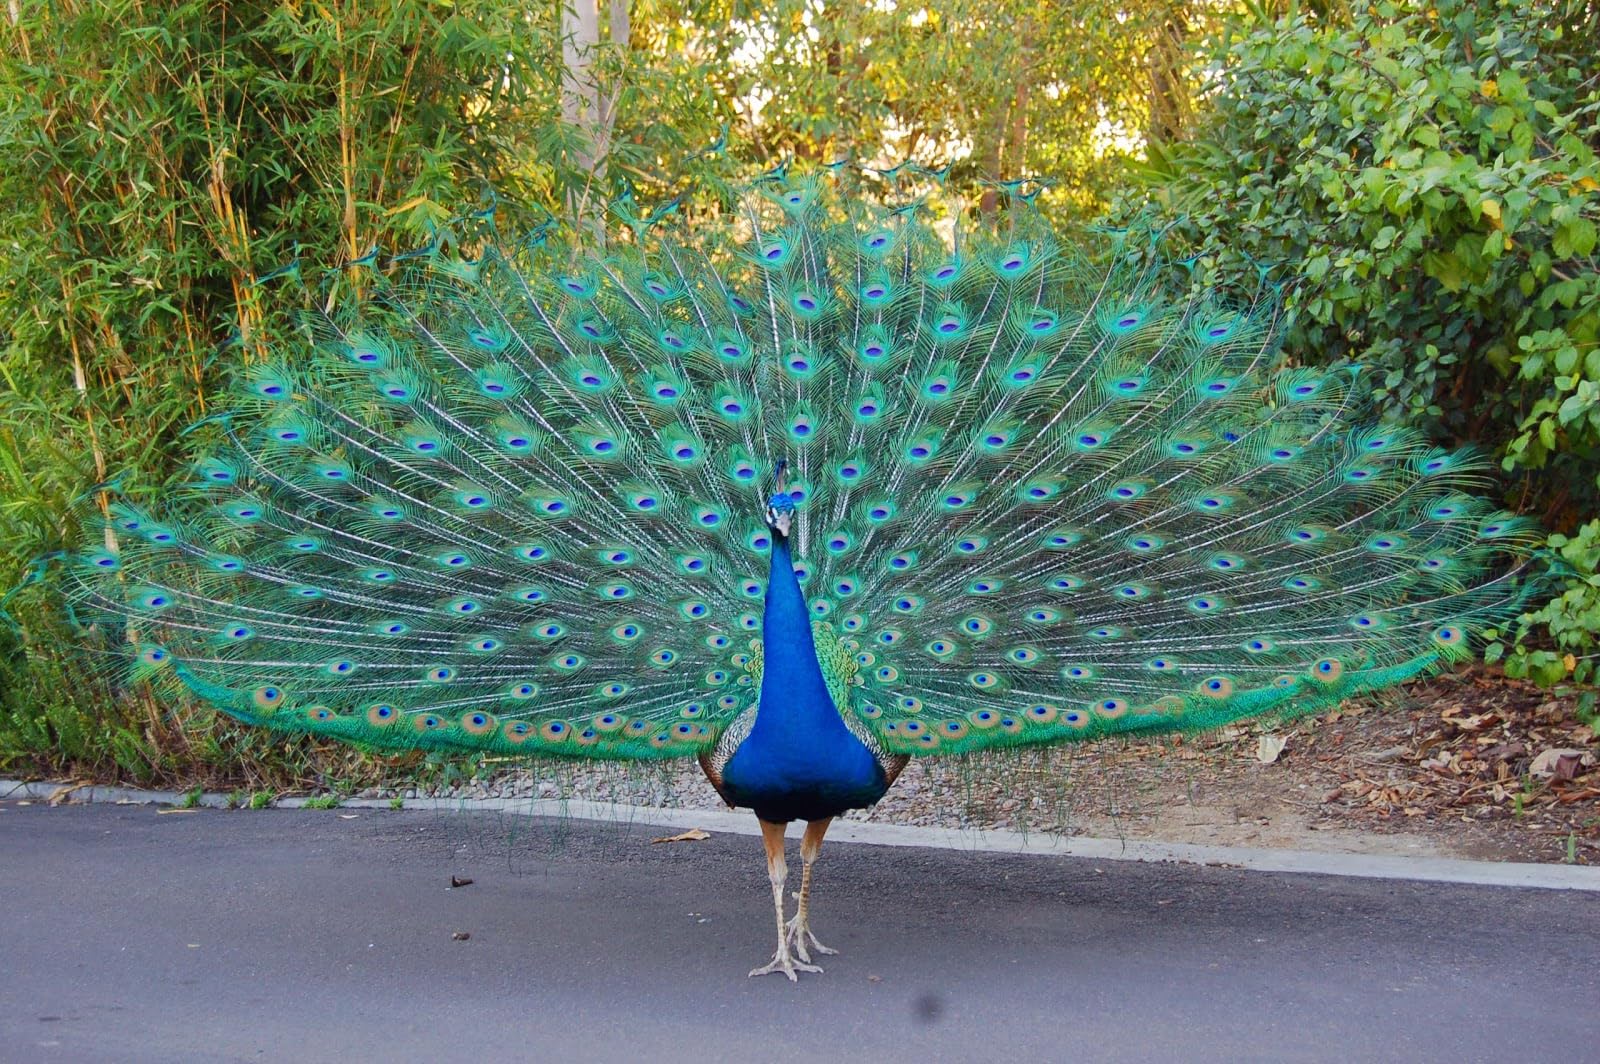
The question for us now is: Are we the way we are as a result of nature or nurture? Up to now we have dealt with the physical universe, the creation of all forms of life, and finally the creation of mankind, where mankind is unique in that it is created to have a special functioning connection with God. This is the only physical difference between us and the animals. A dog has better sense of smell, a cat hears better, an eagle sees better a bat uses echolocation to see at night, a dolphin has a better sonar than what scientists has been able to duplicate, many animals can sense changes in magnetic disturbances and so on.
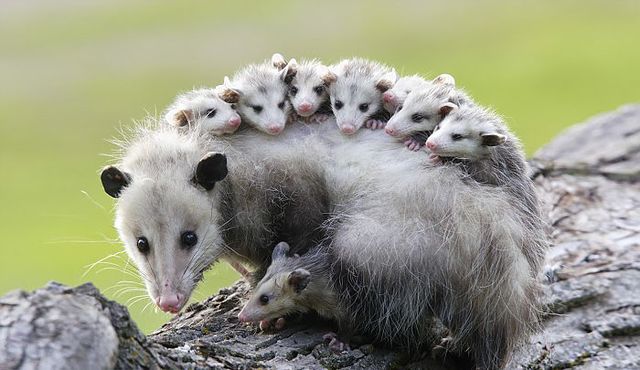
We can separate the nature-nurture question two ways: Spiritually and environmentally. We start to develop much sooner after conception than people think, and the brain as it develops starts to record sounds and begins feeling way before birth.These impressions become hardwired into the brain and some insists that listening to classical music is the best environment for the developing baby, but the voice of the mother, both language and accent start to get imprinted before birth. The baby can also sense mood changes, arguments, stress and unrest. Some of this is already imprinted in their brain before the baby is born! If the mother gets sick, takes drugs, eats or drinks improper things, this too affects the baby’s development. Then comes birth, and so many things have to come to pass in right time and order for the birth to succeed, and yet it normally does. This is a miracle. Granted, when you see a cow give birth, she licks the calf off, and one hour later the calf rises up and starts to follow the mare, while a baby is helpless for a long time. When a child grows up, all it senses, hears, sees smells, tastes and feels gets uploaded into the brain, but only a small part is forever stored into memory, and what is stored permanently is often in connection with a traumatic event, good or bad. The events as memorized can be seen as nurture, but how they are handled are more part of nature. Some learn and change for the better, others change for the worse.
For all of us that are over 45 we will never forget January 28 1986. The space shuttle was ready and loaded to send up “teacher in space”, every classroom that had access to a television had it loaded and President Regan was ready to give the State of the Union speech the same night. The sky was perfect, but there had been a short dip below freezing and the dew had condensed thick on the main tank and even formed icicles from the cold from the liquid oxygen and liquid hydrogen. The boosters were not certified to work safely below 50 F, but they had done successful cold liftoffs before. A friend Ph.D chemist was working in the next cubical and together we were terrified that they would not scrub the mission. They could not find one engineer to sign off on the mission, but they went ahead anyway. The State of the Union speech was more important than safety. We all know what happened.With nearly all school-age children watching online the shuttle blew up and all seven astronauts were instantly killed. Some took it very hard, especially most teachers that had looked forward to this special moment in history. Some children had nightmares for a long time, but for others it was just another video-game. I can still remember some children coming home from school laughing: We now know what NASA stands for: “Need Another Seven Astronauts”. – The only one punished for this disaster was the one refusing to approve the mission and not accepting the white-washing of management responsibility; another sign of the fallen human nature.
It is of great importance where you spent your childhood. If you are born and raised on a subsistence farm, your experience is quite different from being raised on a modern specialized farm. If you are raised in the asphalt jungle of a modern city where crime and rape is commonplace, drugs are everywhere and corruption is the dominant method of doing business, that will shape how you see the world. Every memory impression will shape the way you behave and react.
If you are born in the country you will observe nature, and see how weather and climate affect all aspects of life, and you will see how beautifully God controls the weather. You learn to read the clouds and be a part of nature. Not so in the big cities! All is covered up, the sky tells you nothing. There are of course cultural events, sports, shows and spectacles, and many are drawn to that.
All this will be important in how you deal with the big question: Why are we here in the first place?
Next installment: The spiritual search for truth.