By far, the strongest greenhouse gas is water vapor, not because it is very strong of itself, but it absorbs nearly all outgoing energy in the infrared spectrum except in the so called atmospheric window, where it only partially absorbs. Yet water vapor is missing from the IPCC calculations. Instead is put in a forcing multiplier to account for the water vapor
IPCC has consistently treated the effect of greenhouse gasses as additive, but it is impossible to absorb more than 100% of all emitted energy for a given wavelength. This leads to an overestimation of absorption when 2 or more gases are present. For example, if CO2 absorbs 90% of available energy at 13 μm and water vapor another 50%, the sum is 90% + (1 -0.9} * 0.5 = 95%, not 140%. To see more how the calculations are made, see here.
We have valid satellite data from 1979, and they give very good global averages. so as a test I took a quick look at the temperature rise from 1980 to 2022 and compared what the rise would be, if all greenhouse and other factors would add up to, and to my surprise the result came within 4% of real data, see here.
Between 2022 and 2050 CO2 concentration is expected to increase from 415 ppm to 460 ppm and Methane from 1.9 ppm to 2.23 ppm. these are the most important greenhouse gases after water vapor. The calculations are here.
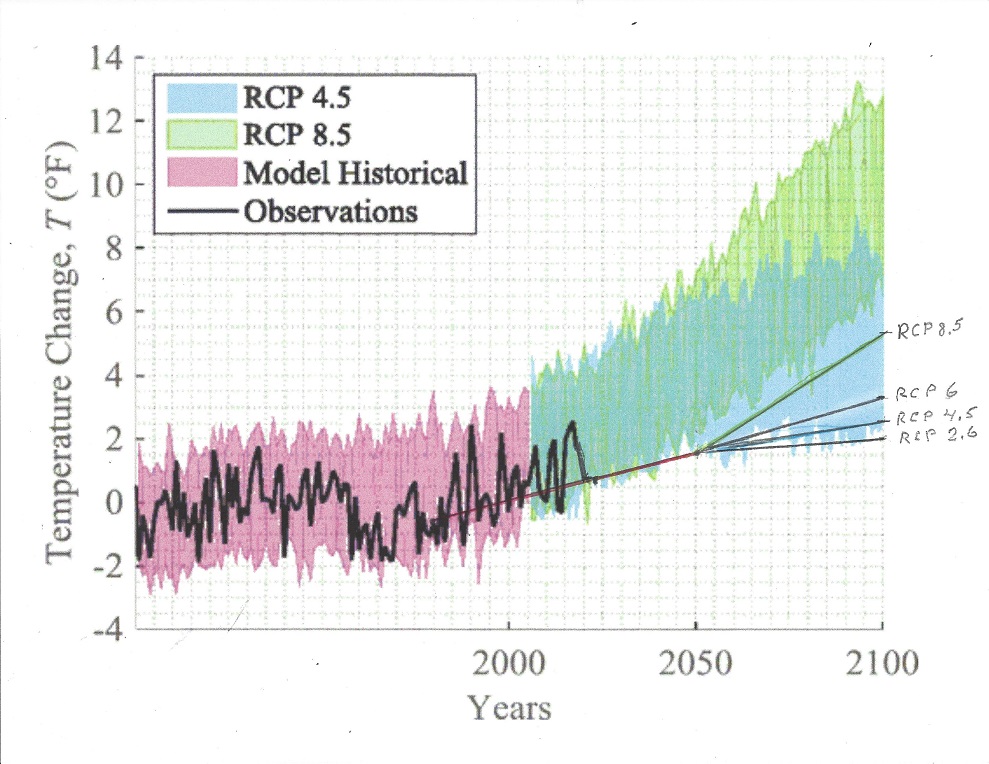
Extended to 2100 IPCC has given 4 scenarios for future temperature development. RCP 8.5 assumes that all future energy growth is provided by fossil fuel, and at least most nuclear energy is phased out. the 8.5 stands for W/m2 for CO2 increase as per IPCC calculation. See further here.
RPC 6 and RPC 4.5 are intermediate stages , while RPC 2.6 achieves net CO2 decline by 2100, but still rising temperature. Here is a figure for the different scenarios.
Calculations:
Scenario 1: RCP 8.5, CO2 1370 ppm, CH4 4 ppm, N2O+20%, HFC +20%, air pollutants -50%, population 12 billion, GDP 170 Trillion$ (2000)
Summary of all greenhouse effect causes for temperature rise from 2050 until 2100:
Effect from water vapor increase: 2.22 C or 10.54 W/m2;
Effect from rising CO2: 0.40C or 1.89 W/m2;
Effect from rising Methane: 0.09C or 0.43 W/m2,
Effect from rising N2O: 0.005C or 0.024 W/m2
Effect from rising Ozone: 0.0005C or 0.002 W/m2
Effect from rising HFCs : 0.006 C or 0.027 W/m2
TOTAL TEMPERATURE CHANGE 2050 to 2100: 2.72 C or 12.9 W/m2
Summary of all non-greenhouse effect causes for climate change from 2050 to 2100:
Long term warming of the sun: 0.0000005C
Temperature decrease from the Milankovitch cycle: – 0.02C or – 0.10 W/m2
Temperature increase from changing solar spot activity + 0.007 C or 0.033 W/m2
Temperature rise from decreasing cloud cover of 0.05 C or 0.24 W/m2.
Change from temperature rise of the Arctic 0.05 C or 0.24 W/m2
Pollution aerosols cause a temperature decrease of – 0.03 C or – 0.12 W/m2
Temperature increase from greening of the earth 0.004C or 0.020 W/m2
Temperature decrease from areas of desertification – 0.001C or 0.005 W/m2.
TOTAL TEMPERATURE RISE FROM OTHER THAN GREENHOUSE GASES FROM 2050 to 2100: 0.060 C or 0.308 W/m2
TEMPERATURE CHANGE FROM 2050 TO 2100 FROM ALL CAUSES: 2.78 C or 13.2 W/m2
Scenario 2: RCP 6.5, CO2 850 ppm, CH4 1.9 ppm, N2O-10%, HFC +20%, air pollutants -50%, population 9.5 billion, GDP 160 T$
Summary of all greenhouse effect causes for temperature rise from 2050 until 2100:
Effect from water vapor increase: 1.28C or 5.95 W/m2;
Effect from rising CO2: 0.20 C or 0.93 W/m2;
Effect from falling Methane: – 0.02C or 0.08 W/m2,
Effect from rising N2O: 0.001C or 0.005 W/m2
Effect from rising Ozone: 0.0005C or 0.002 W/m2
Effect from rising HFCs : 0.006 C or 0.027 W/m2
TOTAL TEMPERATURE CHANGE 2050 to 2100: 1.4665 C or 6.83 W/m2
Summary of all non-greenhouse effect causes for climate change from 2050 to 2100:
Long term warming of the sun: 0.0000005C
Temperature decrease from the Milankovitch cycle: – 0.02C or 0.10 W/m2
Temperature increase from changing solar spot activity + 0.007 C or 0.033 W/m2
Temperature rise from decreasing cloud cover of 0.05 C or 0.24 W/m2.
Change from temperature rise of the Arctic 0.05 C or 0.24 W/m2
Less pollution aerosols cause a temperature increase of 0.05 C or 0.24 W/m2
Temperature increase from greening of the earth 0.002C or 0.010 W/m2
Temperature decrease from areas of desertification – 0.001C or 0.005 W/m2.
TOTAL TEMPERATURE RISE FROM OTHER THAN GREENHOUSE GASES FROM 2050 to 2100: 0.138 C or 0.658 W/m2
TEMPERATURE CHANGE FROM 2050 TO 2100 FROM ALL CAUSES: 1.6 C or 7.5 W/m2
Scenario 3: RCP 4, CO2 650 ppm, CH4 2.0 ppm, N2O-10%, HFC 0%, air pollutants -50%, population 8.7 billion, GDP 280 T$
Summary of all greenhouse effect causes for temperature rise from 2050 until 2100:
Effect from water vapor increase: 0.88 C or 4.19 W/m2;
Effect from rising CO2: 0.08 C or 0.40 W/m2;
Effect from stable Methane: 0.0 C or 0.0 W/m2,
Effect from falling N2O: 0.004C or 0.02 W/m2
Effect from stable Ozone: 0.0 C or 0.0 W/m2
Effect from stable HFCs : 0.0 C or 0.0 W/m2
TOTAL TEMPERATURE CHANGE 2050 to 2100: 0.964C or 4.61 W/m2
Summary of all non-greenhouse effect causes for climate change from 2050 to 2100:
Long term warming of the sun: 0.0000005C
Temperature decrease from the Milankovitch cycle: – 0.02C or 0.10 W/m2
Temperature increase from changing solar spot activity + 0.007 C or 0.033 W/m2
Temperature rise from decreasing cloud cover of 0.05 C or 0.24 W/m2.
Change from temperature rise of the Arctic 0.05 C or 0.24 W/m2
Pollution aerosols cause a temperature increase of 0.05 C or 0.24 W/m2
Temperature increase from greening of the earth 0.002C or 0.010 W/m2
Temperature decrease from areas of desertification – 0.001C or 0.005 W/m2.
TOTAL TEMPERATURE RISE FROM OTHER THAN GREENHOUSE GASES FROM 2050 to 2100: 0.135 C or 0.658 W/m2
TEMPERATURE CHANGE FROM 2050 TO 2100 FROM ALL CAUSES: 1.1 C or 5.3 W/m2
Scenario 4: RCP 2.6, CO2 490 ppm, CH4 1.5 ppm, N2O-15%, HFC -10%, air pollutants -75%, population 9 billion, GDP 320 T$
Summary of all greenhouse effect causes for temperature rise from 2050 until 2100:
Effect from water vapor increase: 0.55 C or 2.55W/m2;
Effect from rising CO2: 0.02C or 0.07 W/m2;
Effect from declining Methane: – 0.01C or 0.06 W/m2,
Effect from stable N2O: 0.0 C or 0.0 W/m2
Effect from stable Ozone: 0.0 C or 0.0 W/m2
Effect from stable HFCs : 0.0 C or 0.0 W/m2
TOTAL TEMPERATURE CHANGE 2050 to 2100: 0.56 C or 2.56 W/m2
Summary of all non-greenhouse effect causes for climate change from 2050 to 2100:
Long term warming of the sun: 0.0000005C
Temperature decrease from the Milankovitch cycle: – 0.02C or 0.10 W/m2
Temperature increase from changing solar spot activity + 0.007 C or 0.033 W/m2
Temperature rise from decreasing cloud cover of 0.02 C or 0.10 W/m2.
Change from temperature rise of the Arctic 0.05 C or 0.24 W/m2
Pollution aerosols cause a temperature increase of 0.08 C or 0.36 W/m2
Temperature increase from greening of the earth 0.002C or 0.010 W/m2
Temperature decrease from areas of desertification – 0.001C or 0.005 W/m2.
TOTAL TEMPERATURE RISE FROM OTHER THAN GREENHOUSE GASES FROM 2050 to 2100: 0.138 C or 0.64 W/m2
TEMPERATURE CHANGE FROM 2050 TO 2100 FROM ALL CAUSES: 0.70 C or 3.2 W/m2
The temperature data from 1980 to 2022 is the control group, and is based on real data.It was then the basis for doing the 2022 to 2050 calculation assuming no mitigation efforts, the most likely result if none of the Paris accord is implemented. The climate target is to stay under + 1.5 C, and this model, that worked better than 95% accurate between 1980 and 2022, comes up with a temperature rise of 1.28C, well below the 1.5C maximum rise since the 1800s
This admittedly simple climate model takes into account the expected temperature influence for eac component, but it also takes into account that it is impossible to absorb more energy than is available for each component. When saturation occurs, that’s it. For calculations, see here and here
Summary of all greenhouse effect causes for temperature rise from 1980 until 2022:
Effect from water vapor increase: 0.37 C or 1.75 W/m2; 80.9% of total
Effect from rising CO2: 0.04C or 0.19 W/m2; 8.78% of total
Effect from rising Methane: 0.036 C or 0.17 W/m2, 7.86% of total
Effect from rising N2O: 0.0065 C or 0.031 W/m2 1.4% of total
Effect from rising Ozone: 0.0034C or 0.016 W/m2 0.7% of total
Effect from rising HFCs : 0.0015 C or 0.007 W/m2 0.3% of total
TOTAL TEMPERATURE CHANGE 1980 to 2022: 0.4544C or 2.164 W/m2
Summary of all non-greenhouse effect causes for climate change from 1980 to 2022:
Long term warming of the sun: 0.0000005C
Temperature decrease from the Milankovitch cycle: – 0.021 C or 0.1 W/m2
Temperature decrease from changing solar spot activity – 0.021 C or 0.1 W/m2
Temperature rise from decreasing cloud cover of 0.10 C or 0.48 W/m2.
Change from temperature rise of the Arctic 0.1 C or 0.48 W/m2
Pollution aerosols cause a temperature decrease of – 0.1 C or 0.48 W/m2
Temperature increase from greening of the earth 0.0063C or 0.030 W/m2
Temperature decrease from areas of desertification – 0.0015C or 0.007 W/m2.
TOTAL TEMPERATURE RISE FROM OTHER THAN GREENHOUSE GASES FROM 1980 to 2022: 0.0628 C or 0.303 W/m2
TEMPERATURE CHANGE FROM 1980 TO 2022 FROM ALL CAUSES: 0.5172 C or 2.467 W/m2
This is well within the uncertainty band, being at least plus minus 10%, for such a crude calculation, but at least it is better than all climate models (except one) Here is the picture compared with other climate models:
The U.S. Supreme Court settled the issue: Whether, in 42 U.S.C. § 7411(d), an ancillary provision of the Clean Air Act, Congress constitutionally authorized the Environmental Protection Agency to issue significant rules — including those capable of reshaping the nation’s electricity grids and unilaterally decarbonizing virtually any sector of the economy — without any limits on what the agency can require so long as it considers cost, nonair impacts and energy requirements.
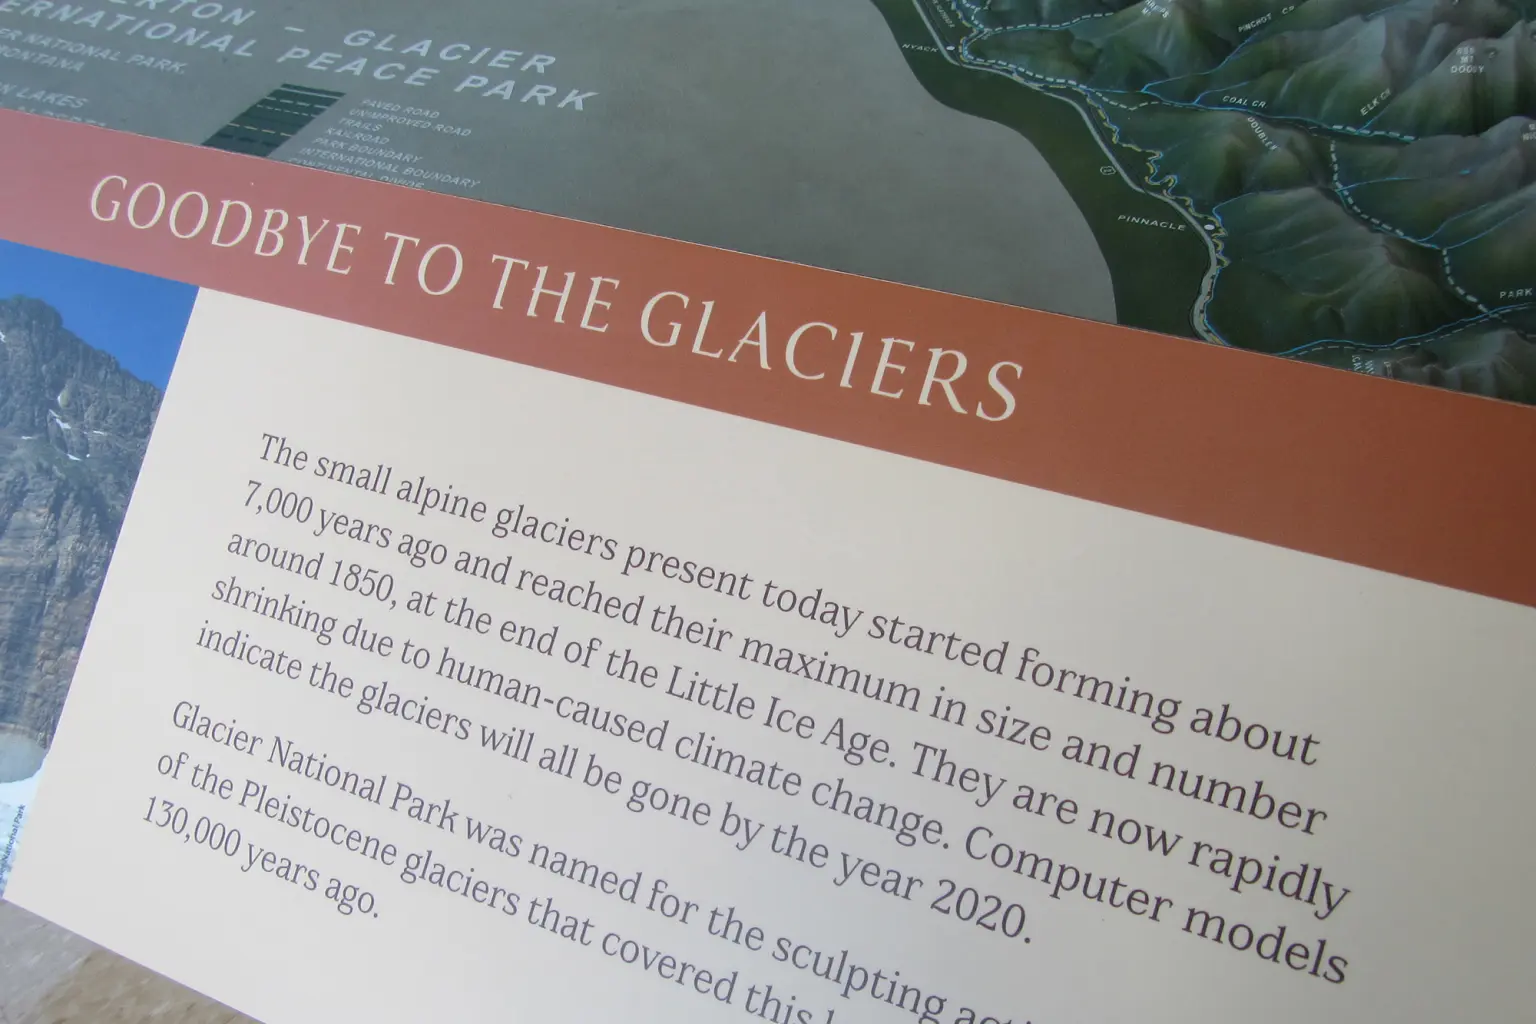
I have always been very interested in the environment. Nature teaches us so many lessons, the diversity of trees, birds, flowers and wildlife is breathtaking and giving cause to never cease to wonder. It would be a shame to destroy the beauty of it all. Yet we seem to make it worse by concentrating our effort by trying to limit CO2 emissions, rather than tackling the real and more urgent problems.
Let me first explain why I assert that rising CO2 levels, while real is only a minor player in the climate change equation.
The traditional way to approach this scientifically is making climate models. So far, nearly all, except the Russian model have failed to even remotely to predict future temperature changes. IPCC and all their climate models is still failing.
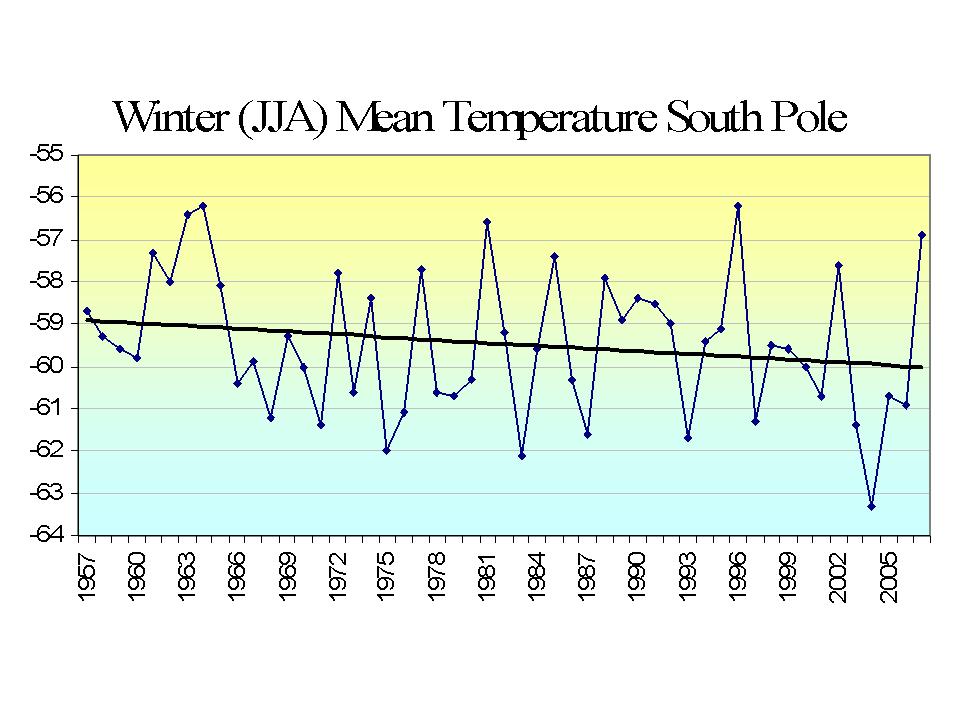
The other approach is to take measurements, and it so happens that we have really good global data for over 60 years. The Amundsen Scott – South Pole weather station, the average temperature of Winter season 2021 (April 2021 – September 2021) reached only -61,0°C / -78°F, and at this temperature CO2 is the dominant greenhouse gas by more than a factor of ten more important than water vapor. We have reliable measurements for the temperature change at the South Pole since 1957. During this time CO2 gas increased 31% to 413ppm, Methane increased 16% to 1.85 ppm and Nitrous oxide decreased, but this is a gas mostly confined to urban areas, and is now below 0.05 ppm worldwide. With CO2 increasing by 31% and water vapor negligible one would expect a temperature rise over 64 years of 0.65 C, or one degree Celsius warmer per century according to extrapolated lab measurements. This is the observed trend:
With 2021 value included the temperature trend is two degrees Celsius cooler per century!
At the South Pole snowfall is negligible in the winter, and for the whole year it is only 1.3 inches. No model would have predicted the cooling trend, so there must be other factors that are are more important, since real measurements beat models every time.
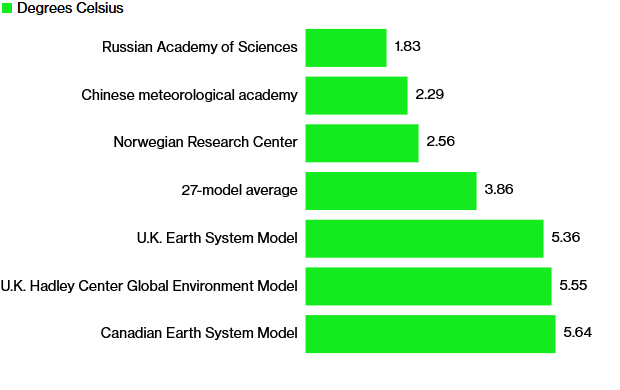
Ignoring the South Pole, the climate models are from time to time adjusted, and as the urgency among the ruling class grew, they suddenly showed a much higher rate of future temperature increases, in this case what is supposed to happen to global temperatures for a doubling of CO2 from pre-industrial times, from 270ppm to 540ppm.
Source: Mark D Zelinka et al. ” Causes of higher Climate sensitivity in CMIP6 models” Geophysical Research Letters.
There are two ways to approach this problem. The models make certain assumptions about the behavior of the changing atmosphere and model future temperature changes. This is the approach IPCC has takenfor the last 34 years. These models all fail miserably when compared to actual future temperature changes.
The other way i to observe what is actually happening to our temperature over time as the CO2 increases. We have over 60 years of excellent global temperature data, so with these we can see where, when and by how much the earth has warmed.
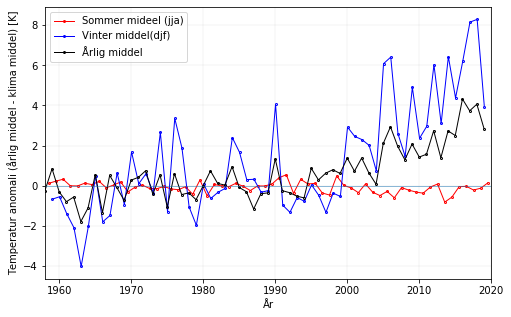
The most drastic temperature rise on earth has been in the Arctic above the 80th latitude. In the winter of 2018 it was 8C above the 50 year average. Since then it has come down to the more normal 4C increase. See charts from the Danish Meteorological Institute:
Summer: red, Jun,Jul, Aug. Winter: green, Dec, Jan, Feb Yearly: black
Note, there are no increase at all in the summer temperatures!
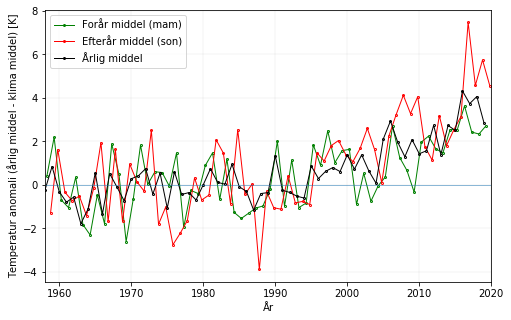
Spring: green, Mar, Apr, May. Fall: red, Sep Oct, Nov. Yearly: black
The fall temperature saw an increase of 4C and the spring temperature saw an increase of about 2.5C.
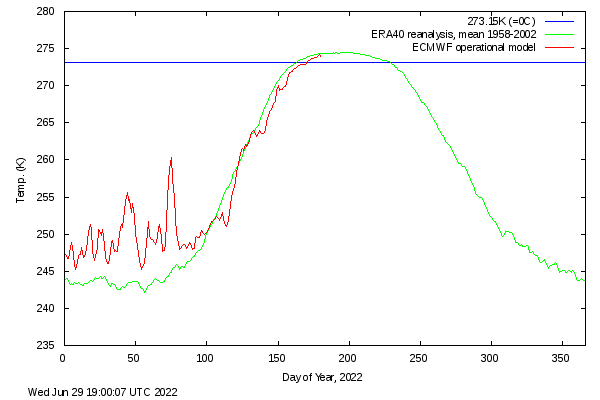
The 2022 winter saw an about 4c increase. The Spring temperatures have from the 10th of March were below or very close to the 1958 – 2002 average. Early Summer temperatures have so far been about 1C below normal. Source: DMI.
There seems to be no cause for immediate panic with the Arctic temperatures. If anything, they seem to moderate. In the Antarctic on the other hand temperatures have been decreasing! As we have seen before, the Amundsen Scott – South Pole weather station, the average temperature of Winter season 2021 (April 2021 – September 2021) reached only -61,0°C / -78°F, which is the coldest value in all-time history! This was 2,5°C /4.5°F degrees lower than the most recent 30-year average at this remote station.
Why are the temperatures not behaving like the models predict?
To get the answer we must study molecular absorption spectroscopy. IPCC and most scientists claim that the greenhouse effect is dependent on the gases that are in the atmosphere, and their combined effect is additive according to a logarithmic formula. This is true up to a certain point, but it is not possible to absorb more than 100% of all the energy available in a certain frequency band! For example: If water vapor absorbs 90% of all incoming energy in a certain band, and CO2 absorbs another 50% of the energy in the same band, the result is that 95% is absorbed, (90% + 50% * (100% – 90%)), not 140%, (90% + 50%).
The following chart shows both CO2 and H2O are absorbing greenhouse gases, with H20 being the stronger greenhouse gas, absorbing over a much wider spectrum, and they overlap for the most part. But it also matters in what frequency range s they absorb.
For this we will have to look at the frequency ranges of the incoming solar radiation and the outgoing black body radiation of the earth. It is the latter that causes the greenhouse effect. Take a look at this chart:
The red area represents the observed amount of solar radiation that reaches the earth’s surface. the white area under the red line represents radiation absorbed in the atmosphere. Likewise, the blue area represents the outgoing black body radiation that is re-emitted. The remaining white area under the magenta, blue or black line represents the retained absorbed energy that causes the greenhouse effect.
Let us now take a look at the Carbon Dioxide bands of absorption, at 2.7, 4.3 and 15 microns. The 2.7 and 4.3 micron bands absorb where there is little black body radiation, the only band that counts is at 15 microns, and that is in a band where the black body radiation has its maximum. However it is also in a band where water vapor also absorb, not as much as CO2,only about 20% to 70% as much. The important thing is that in the frequency band of 14.5 to 15.5 micron CO2 absorbs all the energy available in that spectral range, and it also did it before industrialization when CO2 levels were one third less than today!
The grey area is the difference between total pre-industrial absorption and today, less than 5 % added absorption in the 13 to 17 micron band. Notice that total absorption from ground level to thermopause cannot exceed 100%
From this we can see that increasing CO2 levels is not the cause of climate change, if anything, it is only a only a very minor player. How about Methane?
Methane has only two major absorption bands, one at 3.3 microns, and the other at 8 microns. The 3,3 micron band is where incoming radiation is negligible, and so is outgoing black-body radiation. The 8 micron band is where water vapor is dominant, so Methane turns out to be the don’t care gas.
Water vapor or absolute humidity is highly dependent on the temperature of the air, so at 30C there may be 50 times as much water vapor as CO2, at 0C there may be ten times as much water vapor, and at -25C there is more CO2 than water vapor. At those low temperatures the gases are mostly additive. In the tropics with fifty times more water vapor than CO2, increased CO2 has no influence on the temperature whatsoever. Temperature charts confirm this assertion:
The temperature in the tropics displays no trend whatsoever. It follows the temperature of the oceans, goes up in an el niño and down in a la niña. The temperature in the southern hemisphere shows no trend. In the northern temperate region there is a slight increase, but the great increase is occurring in the Arctic. There is no increase in the Antarctic yet even though the increase in CO2 is as great in the Antarctic and the winter temperature in the Antarctic is even lower than in the Arctic. So CO2 increase cannot be the answer to the winter temperature increase in the Arctic.
There is an obvious answer. When temperatures increase the air can and will contain more moisture and transport this moisture from the tropics all the way to the arctic, where it ends up as snow. Is the snow increasing in the Arctic?
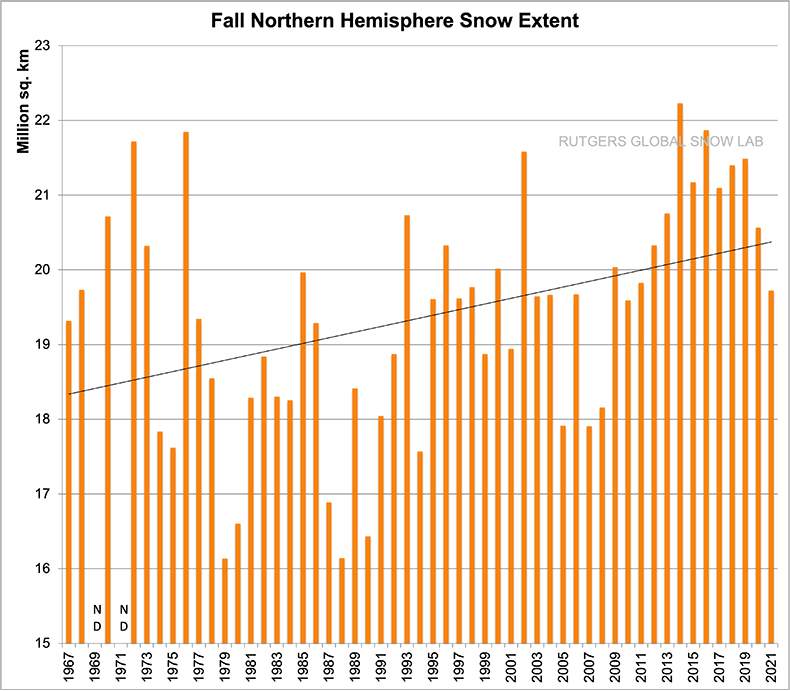
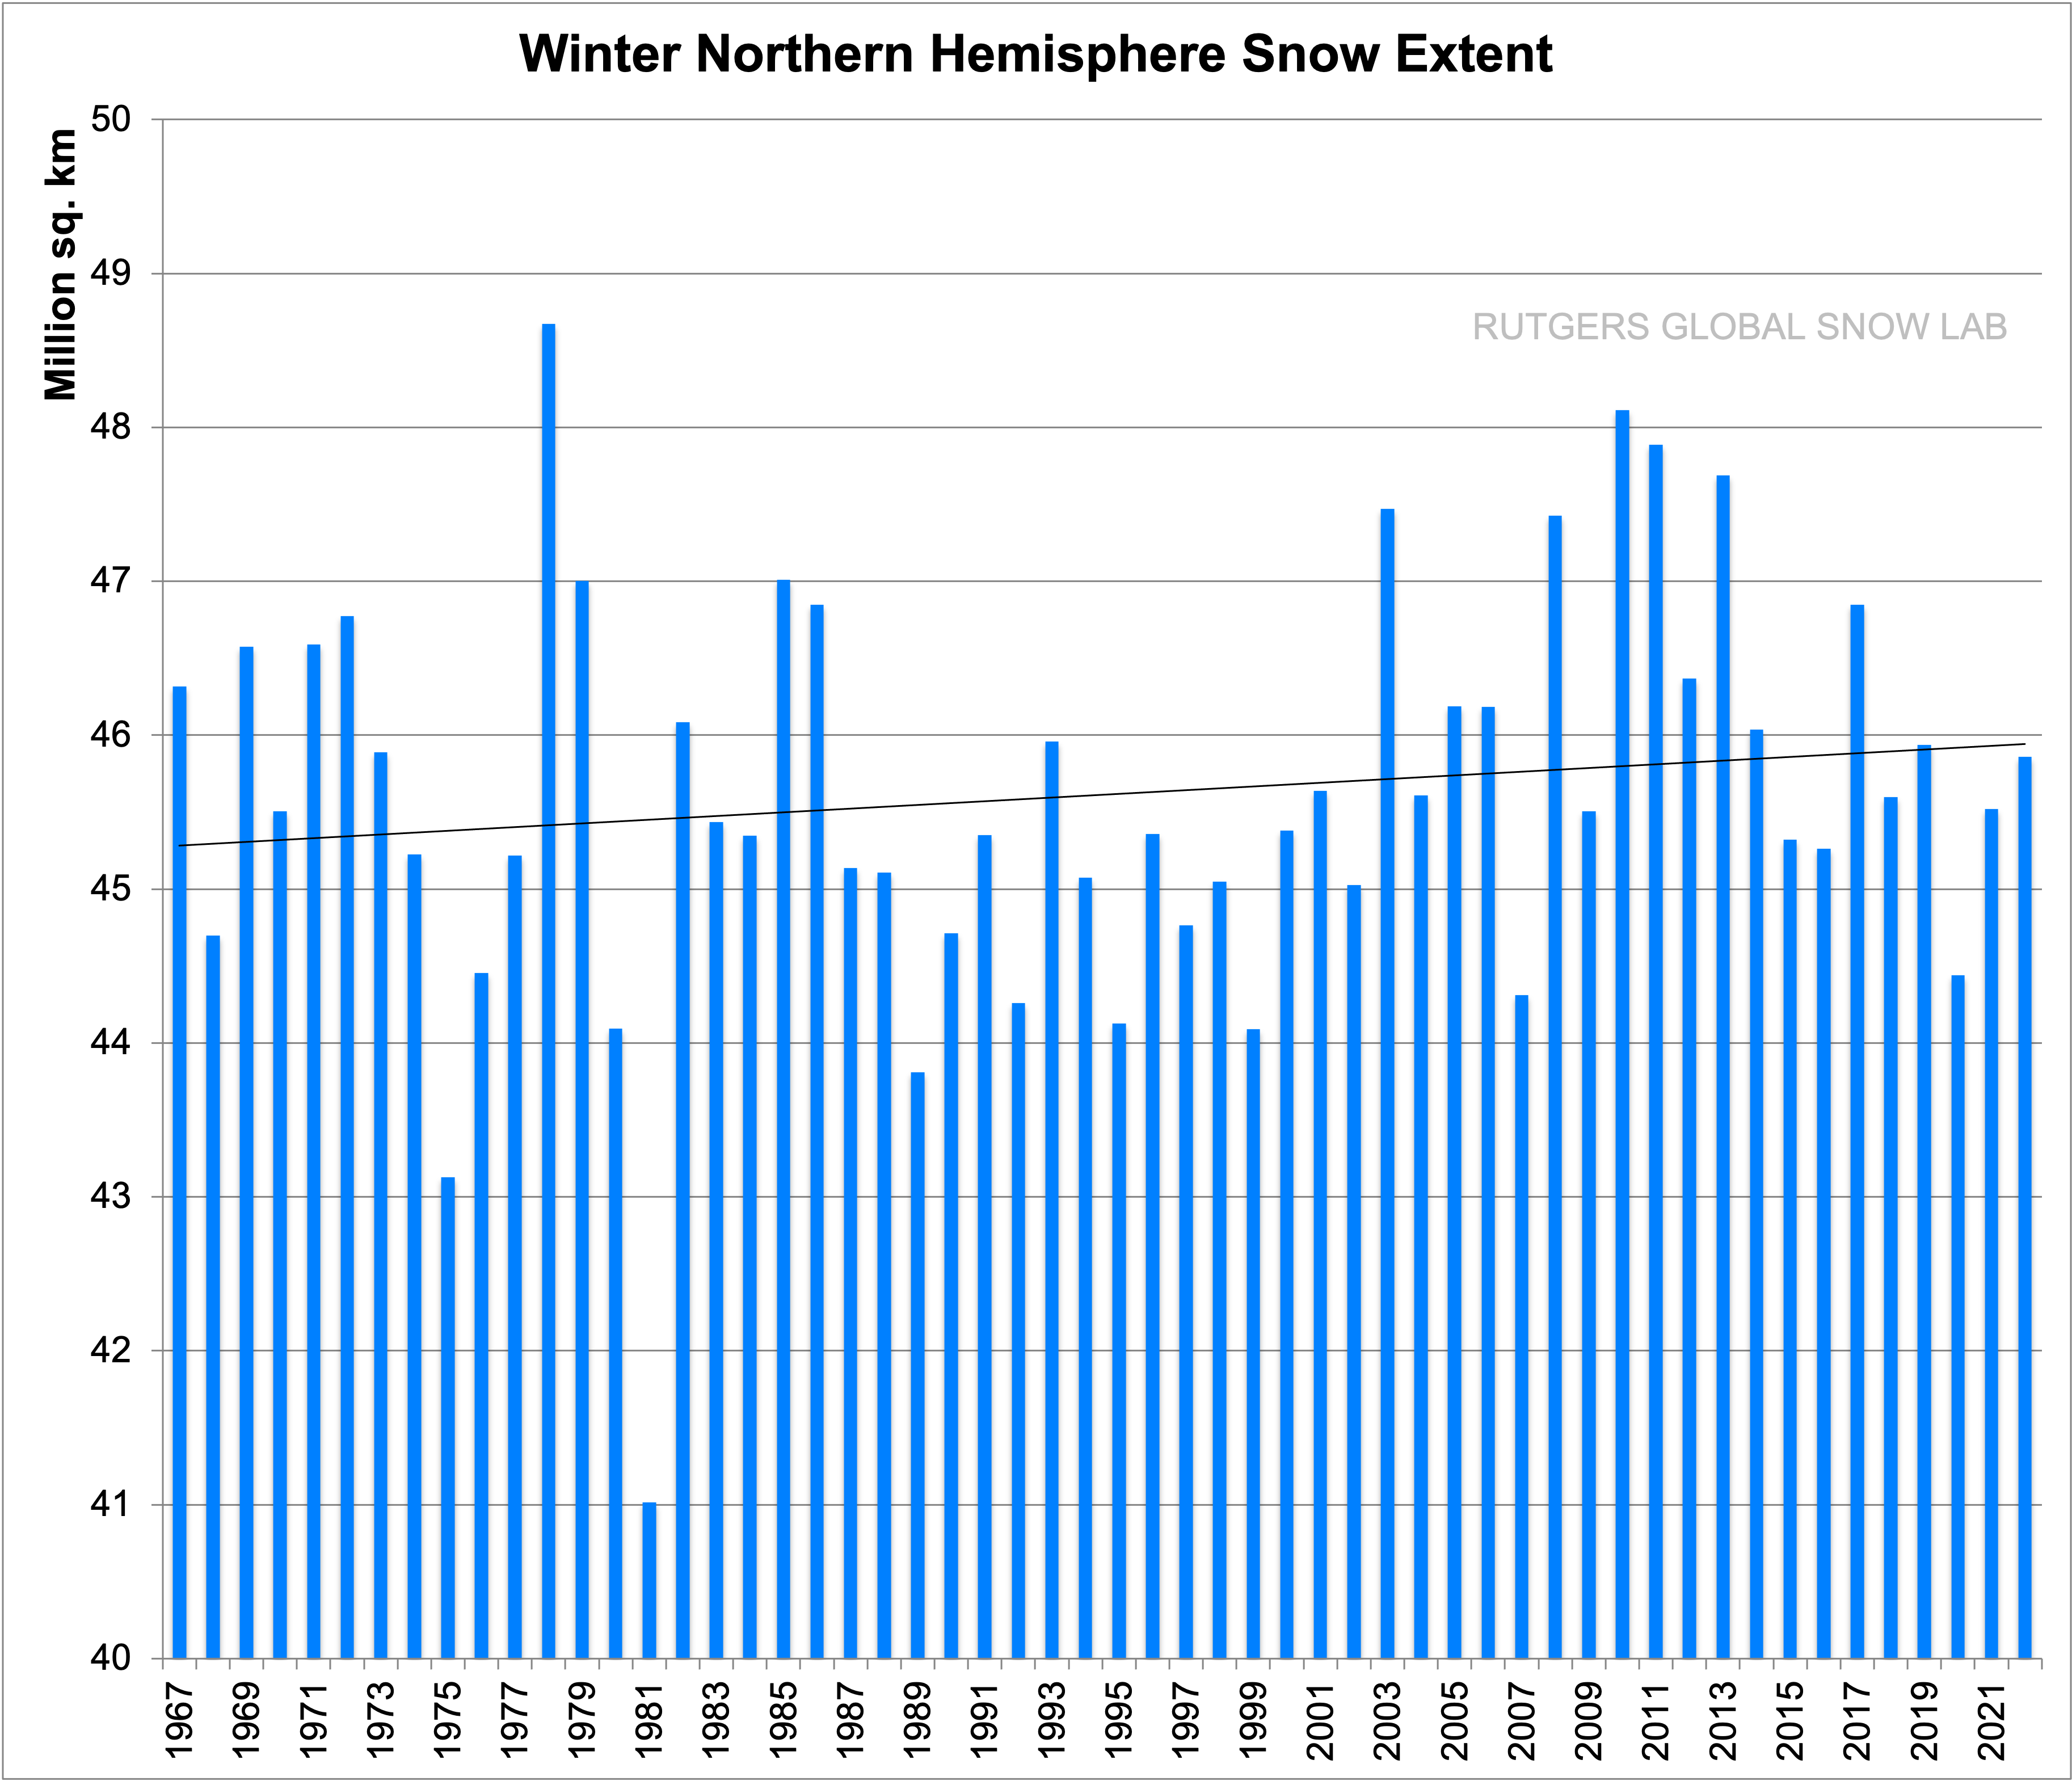
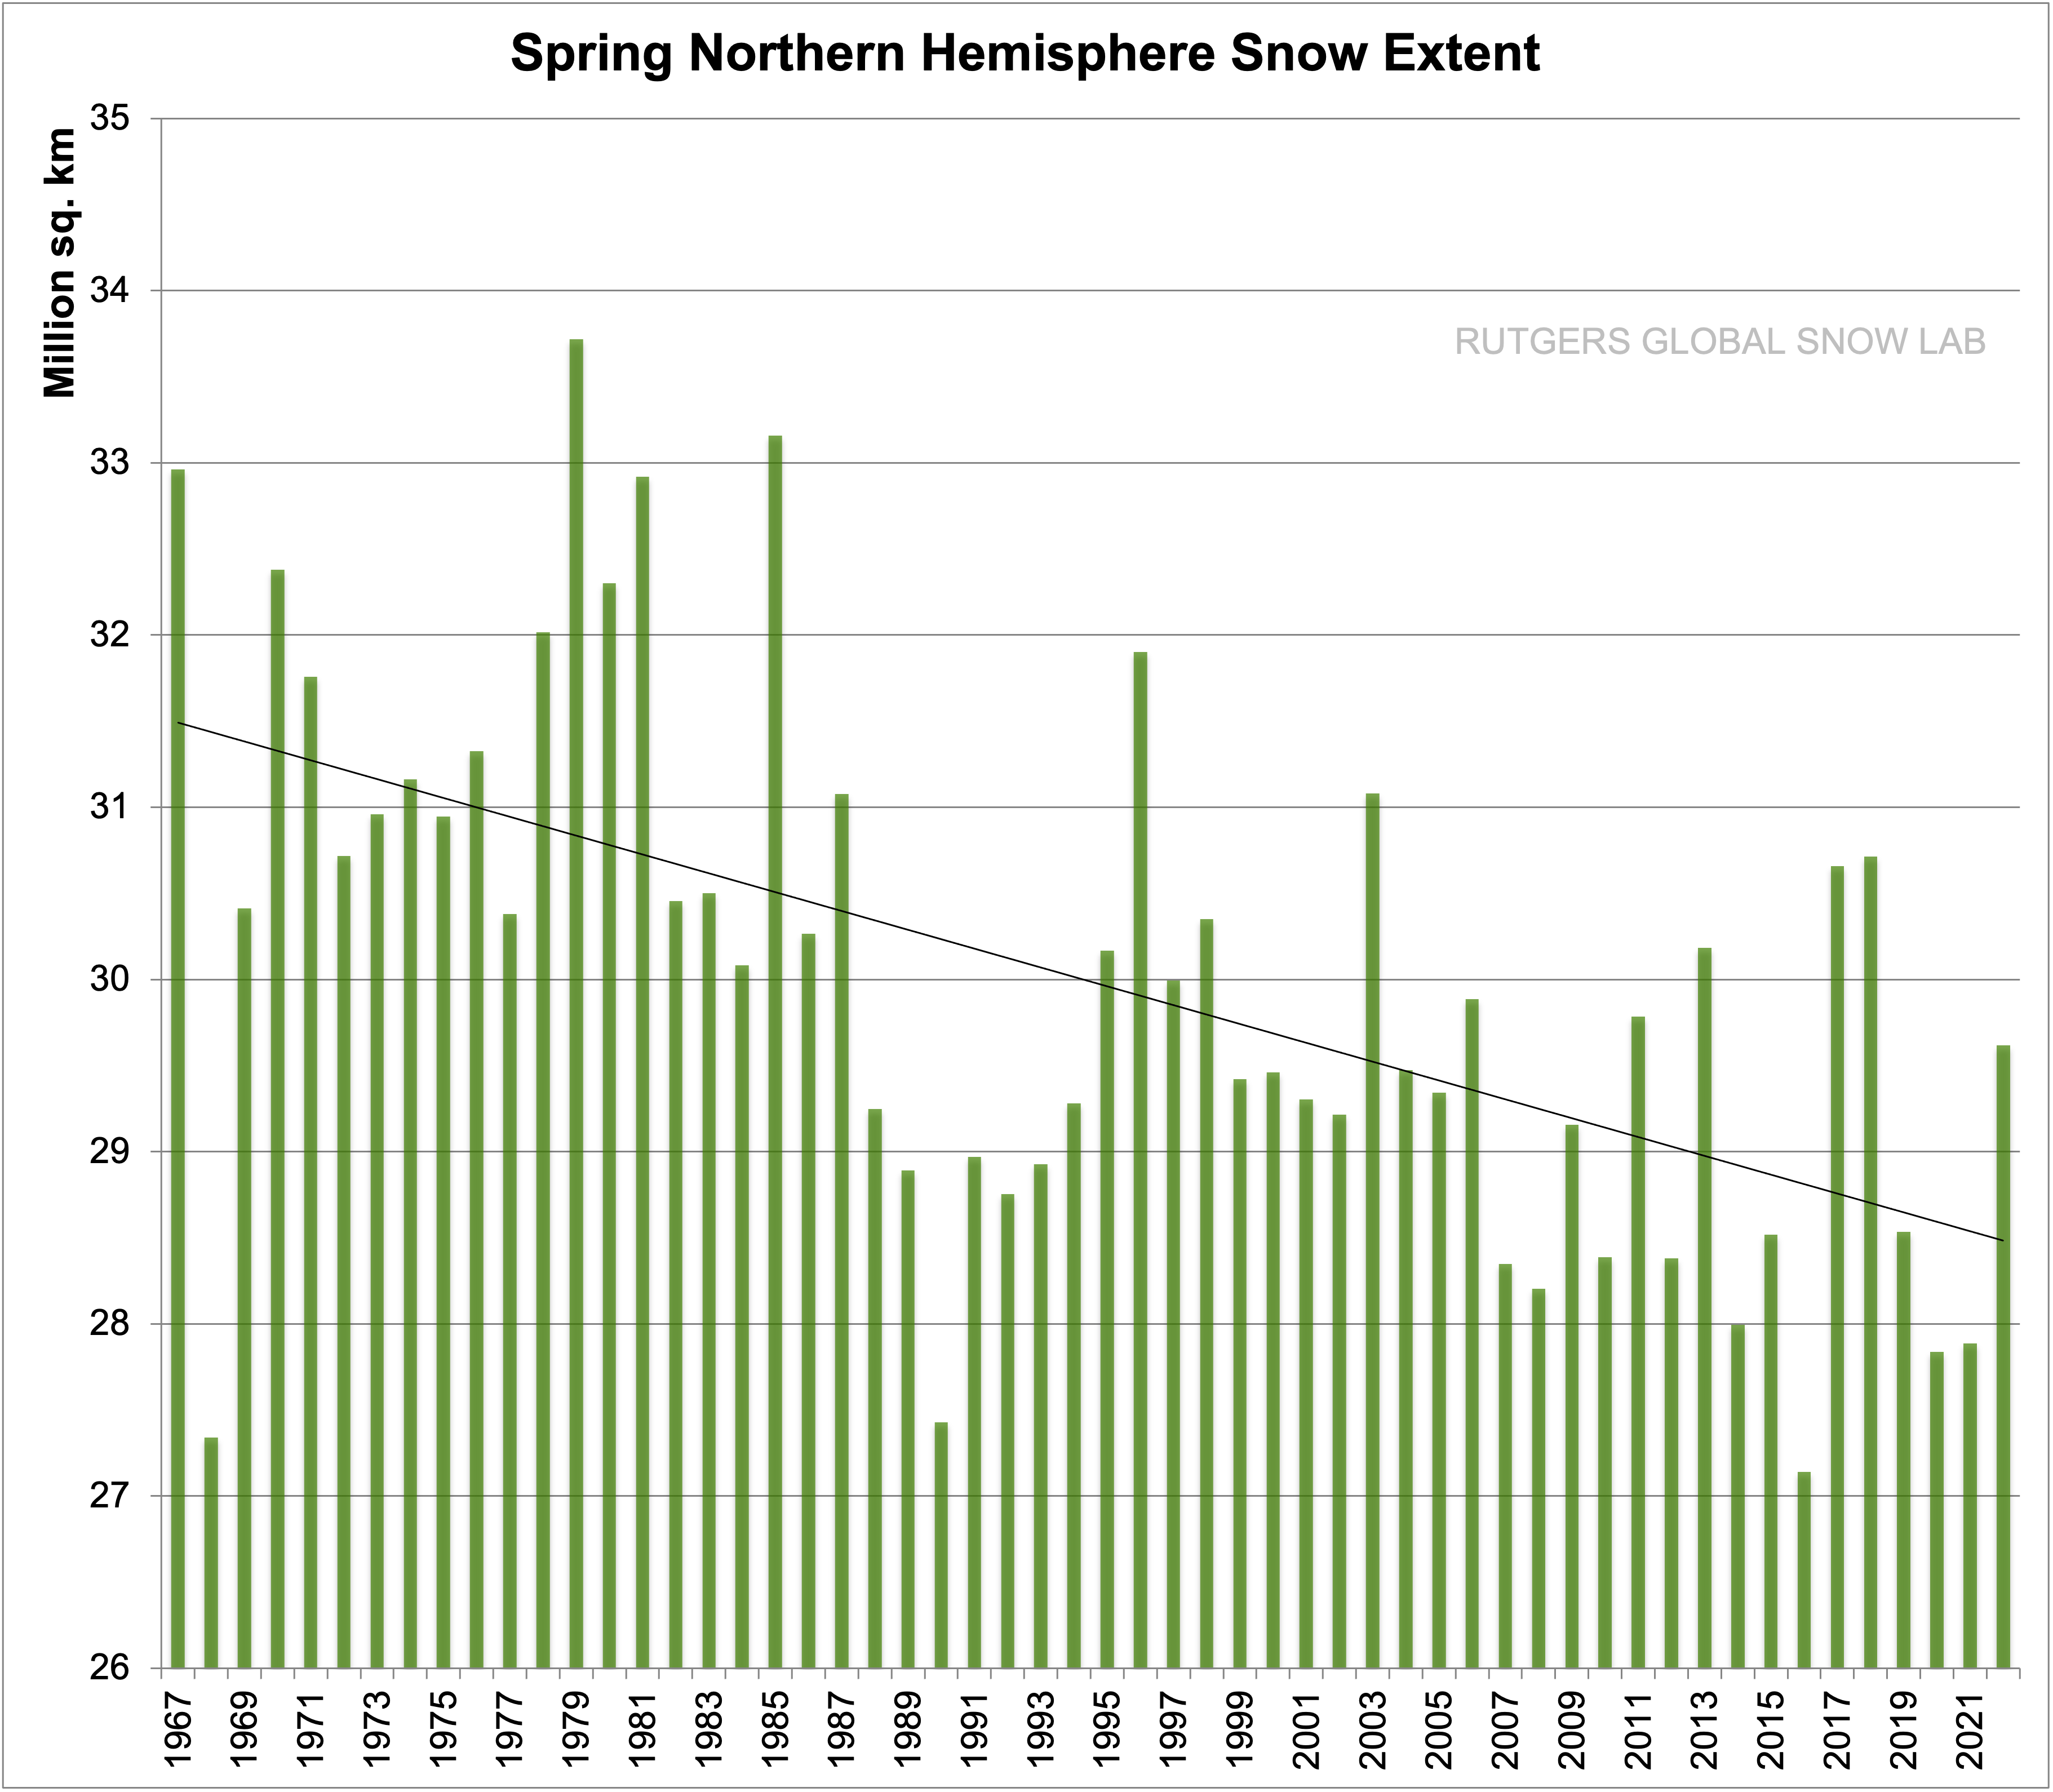
Let us see what the snow statistics show. These are from the Rutgers snow lab.
The fall snow extent is increasing, and has increased by more than 2 percent per year.
The winter snowfall has also increased but only by 0.04 percent per year. The snow covers all of Russia, Northern China, Mongolia, Tibet, Kashmir and northern Pakistan, Northern Afghanistan, Northern Iran, Turkey, most of Eastern Europe, Scandinavia, Canada, Alaska, Greenland and part of Western, Eastern and Northern United States.
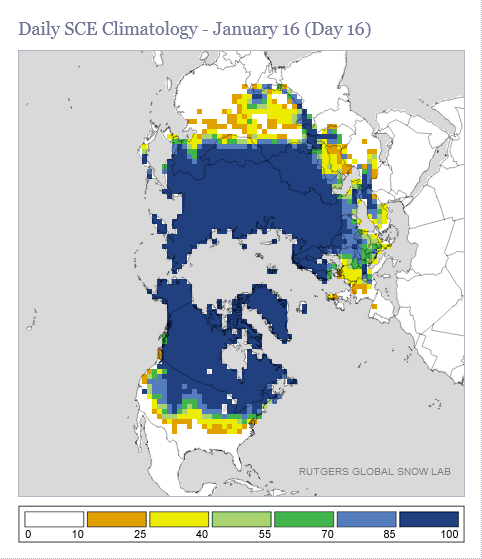
Jan 16,2022
In the spring on the other hand the snow pack is melting faster, about 1.6 percent less spring snow per year. One of the major reasons for an earlier snow melt is that the air is getting dirtier, especially over China, and to some extent Russia. The soot from burning coal, wood and peat, and from mining dust changes the albedo of the snow. The soot is visible on old snow all the way up to the North Pole. The other reason is that the North Pole is getting warmer. In the fall and winter it is mostly due to increased snowfall, but in the spring, as soon as the temperatures rise over the freezing point, melting occurs earlier. But it takes longer time to melt the increasing snow, so the Summer temperatures remain unchanged or lower.
So the warming of the North Pole, far from being an impending end of mankind as we know it, may even be beneficial. A warmer North Pole in the winter means less temperature gradient between the pole and the tropics, leading to less severe storms. They will still be there, but less severe.
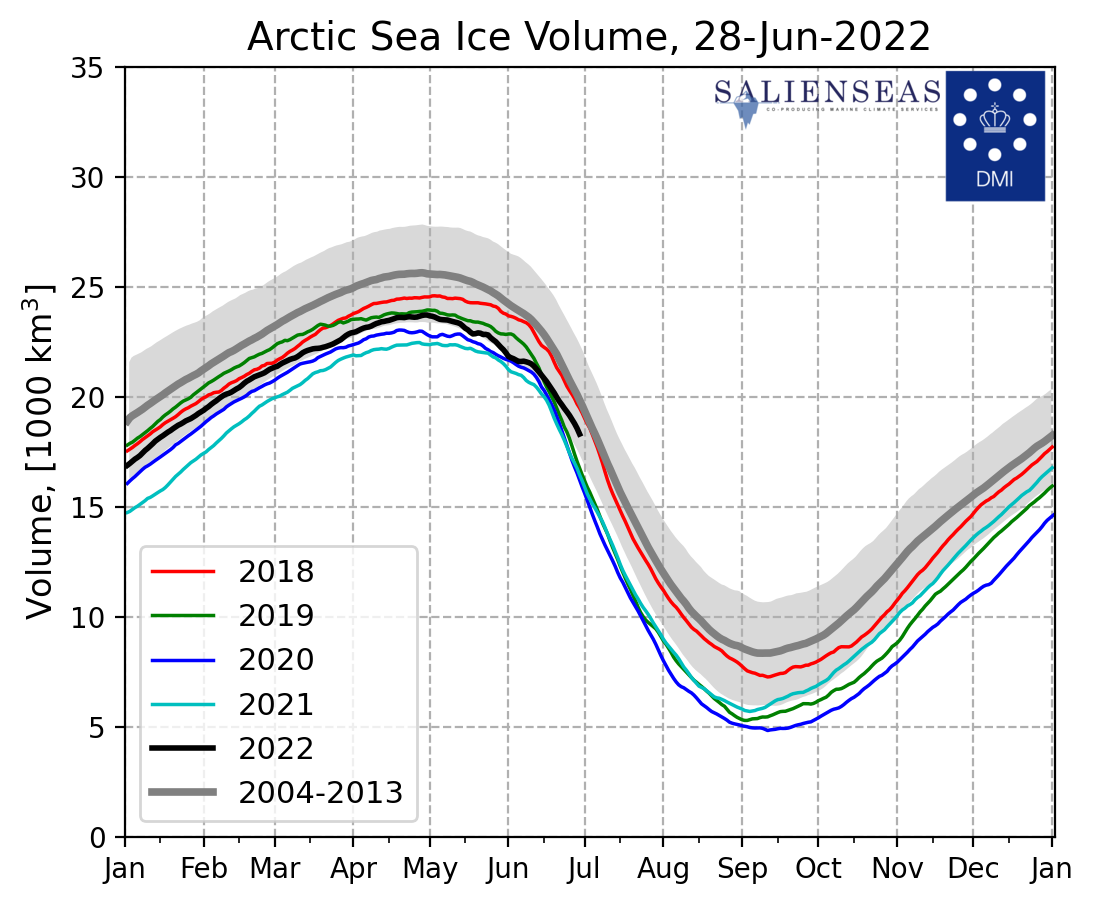
This year’s Arctic ice volume is greater ghan the previous 3 years. and the melting is slower. It is too early to tell if it is a real cooling of the climate, but it is worth noting
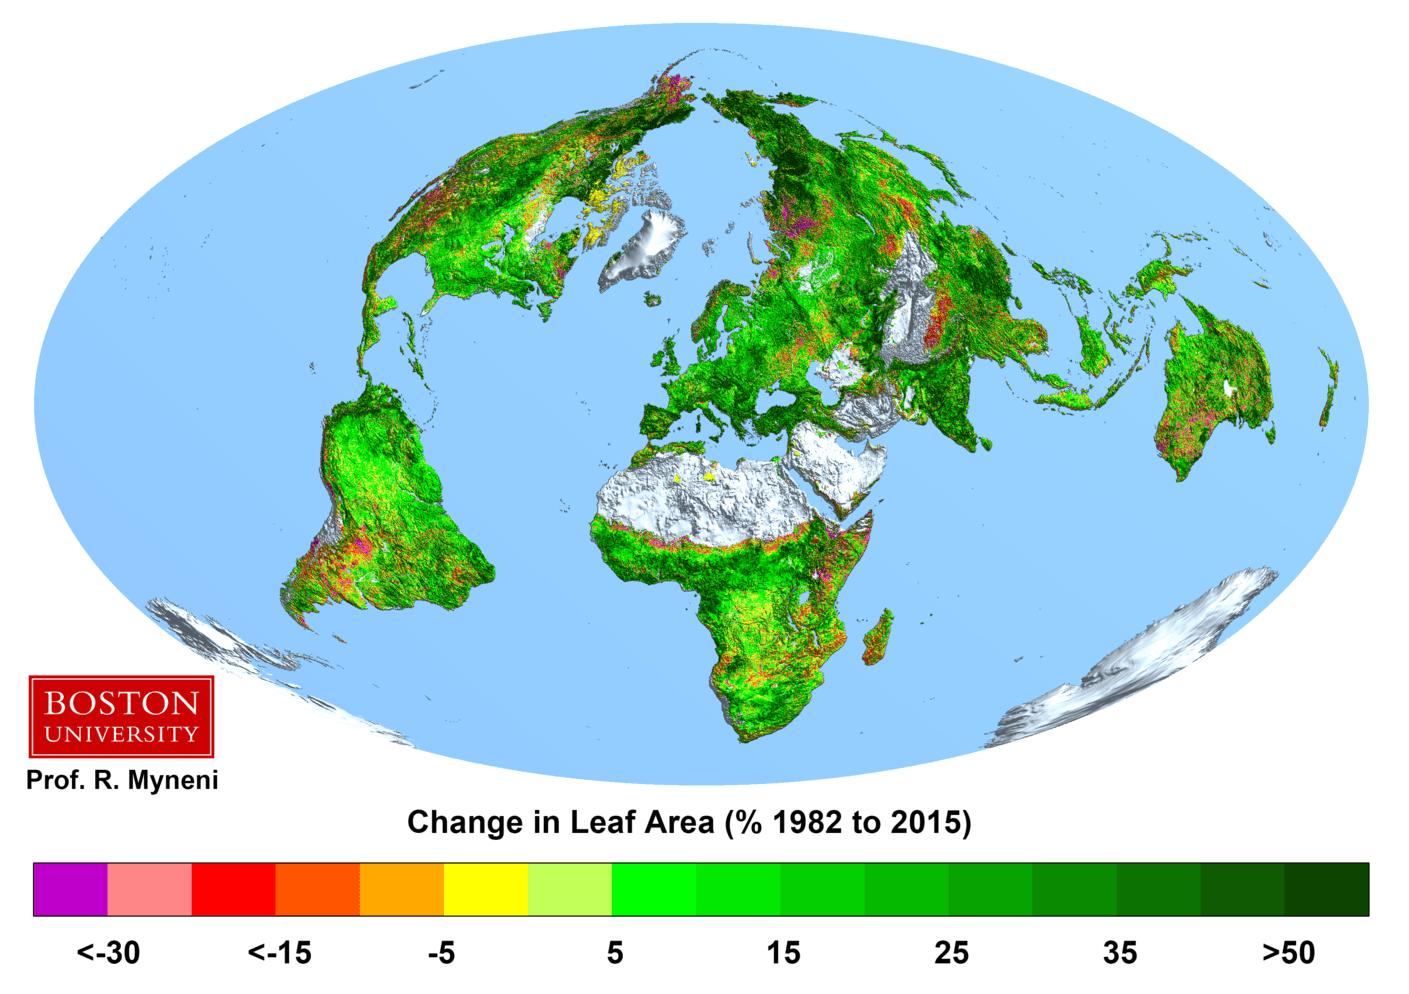
There is one great benefit of increased CO2, the greening of the earth!
Thanks to this greening, done with only the fertilizing effect of increasing CO2, the earth can now keep another 2 billion people from starvation, not to mention what good it does for plants and wildlife.
Increasing CO2 is not the cause of climate change.
The corona virus has given us all an education on why models fail. Everybody in any form of management have to make forecasts, plan for the future as they stare an uncertain future in the face. It is time to remember the old saying in the Army: “No plan ever survived contact with the enemy”. And so it is, the corona virus is the unseen enemy that will affect our future, and our plans will have to change on an almost daily basis as it initially worked by doubling every 3 days. No disease since smallpox or measles in the American Indian population has been that infectious. So it was time to panic when it broke out in the Wuhan city in China. The city was sealed off except for international flying which was allowed to continue. The SO2 over the city was strong from all the cremation ovens going full blast. Over 40000 cremations was paid for by the Chinese government if the descendant agreed to ask no further questions, so they were never counted. How many more cremations? Who knows, but the size of the SO2 clouds, which by the way was only over Wuhan and Chongqing indicates it could have been ten times as many. But back to the models. These rumors prompted Trump to close all air travel to all non U.S citizens that had recently been in China. The official line was that there was no human to human transmission. As the death toll mounted in Italy with a 10+ percent death rate among the infected, the models indicated that U.S would have 2.2 million deaths. The models have since been adjusted more than once a week, but has now stabilized at 60000 deaths or fewer. While this is good news, why did the models fail us so badly?
The answer is obvious. Models are only as good as the input data and the assumptive relationships. In this case the big unknown was the denominator, how many will have it and yet show no symptoms? They may even be carriers.
We now have some of the answers. The death rate will be between 0.2 and 0.3% and will affect the normal risk categories, the old, diabetes, asthma, smoking, marijuana use, other drugs, overweight, and a compromised or overactive immune system. Properly handled, early diagnosis, and protecting the most at risk will reduce the death rate even lower.
It is time to get back to work.
The other models hat has failed us badly are the climate models, but the time scale is decades, not days. The U.N. Intergovernmental Panel on Climate Change has given out projections five times, beginning in 1990 on what happens to global temperatures if the amount of the greenhouse gas CO2 released in the air is increased, held steady or decreased. The result is always alarming with predictions a high as a temperature increase of up to 8,5C globally by the year 2100. Every new assessment show a decreasing number with the IPCC5 prediction being that temperature increase will be 2.2 C or thereabout if all reductions proposed will be made. IPCC6 will show a larger increase, mostly because of the rapid increase of CO2 emissions by China, India and other developing countries (Yes China is considered a developing country by U.N.)
There is one major problem with all these models. The trends shown by the models do not match with reality. The increased CO2 already occurred since industrialization would show a substantial hot spot in the tropical troposphere. There is no such hot spot. What do IPCC do with that troublesome fact? They ignore it, because it is mostly politically, not scientifically driven. Yes the scientists are sincere and contribute their parts, but the conclusions are politically driven. Is climate change a hoax? Not at all, it is changing, and long term we will have another ice age, but until then the increasing CO2 will stop the oncoming ice age, and even increase it by as much as 7C in the arctic and antarctic, but only in the winter. In the summer there is no increase in temperature!
Why is that? To get the answer we must study molecular absorption spectroscopy and explain a couple of facts for the 97% of all scientists who have not studied molecular spectroscopy. IPCC and most scientists claim that the greenhouse effect is dependent on the gases that are in the atmosphere, and their combined effect is additive according to a logarithmic formula. This is true up to a certain point, but it is not possible to absorb more than 100% of all the energy available in a certain frequency band! For example: If water vapor absorbs 50% of all incoming energy in a certain band, and CO2 absorbs another 90% of the energy in the same band, the result is that 95% is absorbed, (90% + 50% * (100% – 90%)), not 140%, (90% + 50%).
Even in Barrow, Alaska water vapor is the dominant greenhouse gas. Only at the South Pole (And North Pole) does CO2 dominate (in the long winter).
All Climate models take this into account, and that is why they all predict that the major temperature increase will occur in the polar regions with melting icecaps and other dire consequences. But they also predict a uniform temperature rise from the increased forcing from CO2 and the additional water vapor resulting from the increased temperature.
This is wrong on two accounts. First, CO2 and H2O gas are nor orthogonal, that means they both absorb in the same frequency bands. There is three bands where CO2 absorb much more than H2O in the far infrared band, but other than that H2O is the main absorbent. If H2O is 80 times as common as CO2 as it is around the equator, water vapor is still the dominant absorbent.
And one more thing. Water vapor is a condensing gas, and it matters greatly whether it is in the atmosphere as a gas or in the form of a cloud. Clouds warm by night and cool by day and the cooling by day is much more than the warming by night, so it also matters greatly when clouds appear. People living in rural America know this instinctively even if they have not done the calculations. They look up and discern the sky and thank God for the clouds when they appear in the summer. In the winter that may mean even more snow. Clouds are the major temperature regulators of the earth. On the other hand people living in urban heat islands go from their air conditioned offices to their parked cars heated up in the sun so much that they get blisters when they touch the steering wheel. They are experiencing the worst of climate change, don’t look up and don’t thank God for the blisters.
We have immense environmental problems. CO2 is not one of them. There is a great need for a green new deal, but that involves cleaning up the earth, not destroying it even further. All of this takes a lot of energy. There is only one solution to this dilemma, renewables alone will not even begin to solve it, only Liquid Fluoride Thorium nuclear reactors, and in the future fusion power will have a chance to carry us through the next ice age, which will come when we have used up all available fossil fuels. We must save the bulk of it for our great grand-kids.
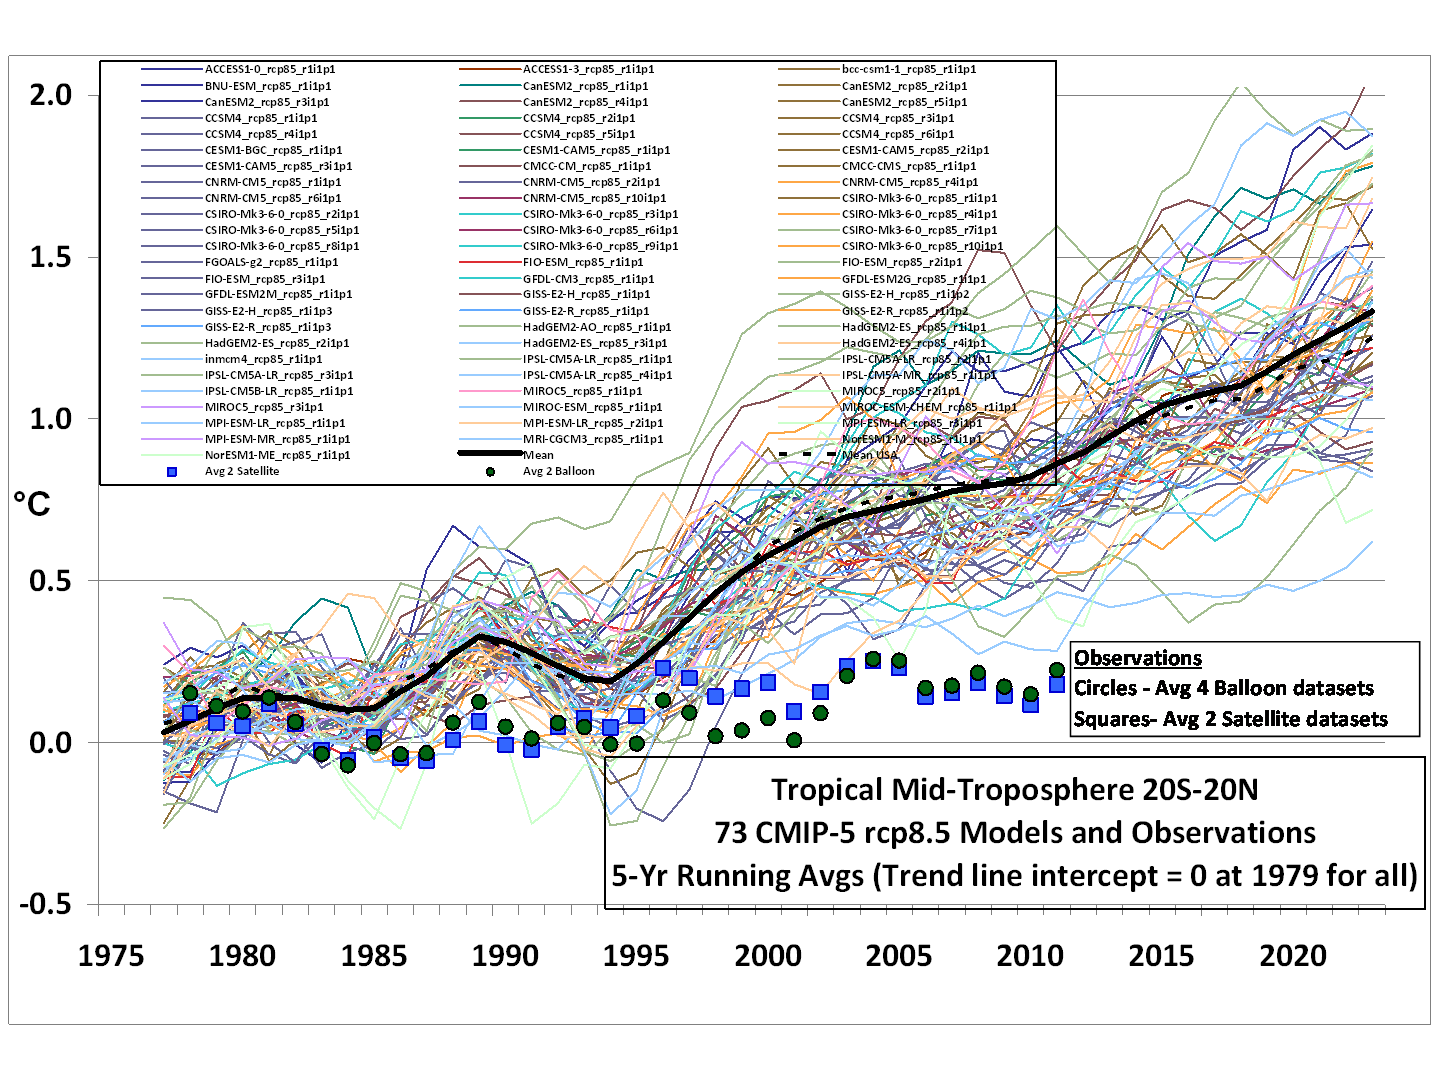
Justin Gillis answer to Question 9. Are the predictions reliable?
“They’re not perfect, but they’re grounded in solid science.
The idea that Earth is sensitive to greenhouse gases is confirmed by many lines of scientific evidence. For instance, the basic physics suggesting that an increase of carbon dioxide traps more heat was discovered in the 19th century, and has been verified in thousands of laboratory experiments.
Climate science does contain uncertainties, of course. The biggest is the degree to which global warming sets off feedback loops, such as a melting of sea ice that will darken the surface and cause more heat to be absorbed, melting more ice, and so forth. It is not clear exactly how much the feedbacks will intensify the warming; some of them could even partially offset it. This uncertainty means that computer forecasts can give only a range of future climate possibilities, not absolute predictions.
But even if those computer forecasts did not exist, a huge amount of evidence suggests that scientists have the basic story right. The most important evidence comes from the study of past climate conditions, a field known as paleoclimate research. The amount of carbon dioxide in the air has fluctuated naturally in the past, and every time it rises, the Earth warms up, ice melts, and the ocean rises. A hundred miles inland from today’s East Coast, seashells can be dug from ancient beaches that are three million years old, a blink of an eye in geologic time. These past conditions are not a perfect guide to the future, either, because humans are pumping carbon dioxide into the air far faster than nature has ever done.
My answer to Question 9. Are the predictions reliable?
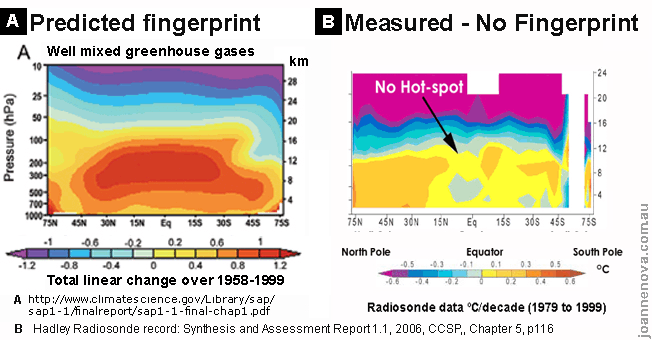
They are not perfect, for sure, but are they even grounded in solid science? For a model to have credibility it must be tested with measurements, and pass the test. There is important evidence suggesting the basic story is wrong. All greenhouse gases work by affecting the lapse rate in the tropics. They thus create a “hot spot” in the tropical troposphere. The theorized “hot spot” is shown in the early IPCC publications. (Fig A)
Fig. B shows observations. The hotspot is not there. If the hotspot is not there, the models must be wrong. So what is wrong with the models?
The models all assume greenhouse gases are additive. This is true for low concentrations and over short distances, such as is done in laboratory environments. Yet there is one truth bout heat absorption. Once all the energy in one frequency band is absorbed, that is it. If the water vapor has already absorbed the energy, no matter of added CO2 will change that. This is largely true in the tropics, where water vapor is dominant. As CO2 levels increased, no hotspot formed in the tropics. Near the poles the situation is different, more CO2 will lead to higher temperatures, but always less than what would have been predicted by separately adding the effects of water vapor and CO2.
[The amount of carbon dioxide in the air has fluctuated naturally in the past, and every time it rises, the Earth warms up, ice melts, and the ocean rises.]
This statement should read: Every time temperature rose in the past, the ice melted, and the oceans warmed up, causing carbon dioxide to be released from ice and oceans and rise with a 300 to 800 years delay, the amount of water vapor rose, increasing the earth’s cloud cover, stopping the temperature rise, and after a time delay CO2 also stopped rising, and ocean levels stabilized.
So CO2 is an effect of, not a cause for the observed temperature rise.
Al Gore’s movie An Inconvenient Truth used this very argument to show CO2 causes temperature rise. A British court found that this was one of the 9 errors of fact that appear in the movie. The court ruled that any theater showing the movie would need to inform the audience of these 9 errors. http://www.telegraph.co.uk/news/earth/earthnews/3310137/Al-Gores-nine-Inconvenient-Untruths.html
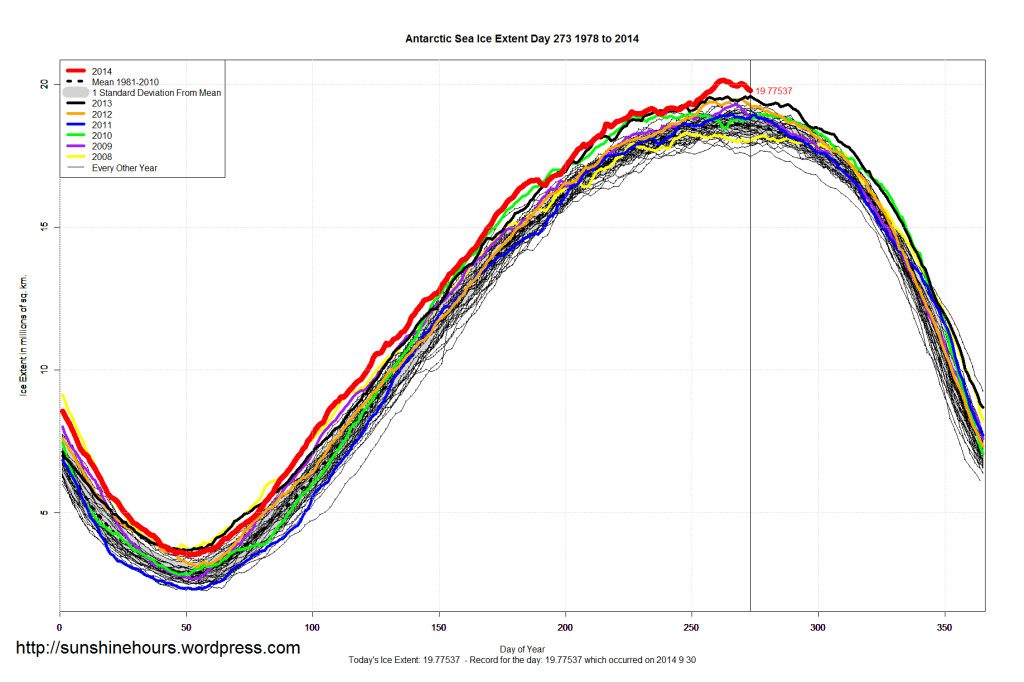
The results are in. New absolute record for ice in Antarctica since measurements begun was set in 2012. It was then broken in 2013, and in 2014 there was nine new absolute records, nineteen days in record territory and so far this year 190 daily records set. The Antarctic ice sheet is growing year by year. It is Climate Change, and it is getting colder. Last June was the coldest month ever recorded in Antarctica. The CO2 content keeps rising, the ice keeps growing. Time to reevaluate the climate models.
Here are the 35 iciest days recorded:
2014, 09, 20, 20.14215, Ninth and final absolute 2014 record
2014, 09, 19, 20.12703, Eighth 2014 record of Antarctic sea-ice.
2014, 09, 18, 20.11297,Seventh 2014 record of Antarctic sea-ice.
2014, 09, 21, 20.07814, 180th daily record for 2014
2014, 09, 22, 20.07057, 181th daily record for 2014
2014, 09, 17, 20.05401,Sixth 2014 record of Antarctic sea-ice.
2014, 09, 26, 20.02033, 185th daily record for 2014
2014, 09, 27, 20.01522,186th daily record for 2014
2014, 09, 23, 19.98593, 182th daily record for 2014
2014, 09, 24, 19.95473, 183th daily record for 2014
2014, 09, 28, 19.94967, 187th daily record for 2014
2014, 09, 25, 19.94174, 184th daily record for 2014
2014, 09, 16, 19.91462, Fifth 2014 record of Antarctic sea-ice.
2014, 09, 29, 19.84111, 188th daily record for 2014
2014, 09, 15, 19.81305, Fourth 2014 record of Antarctic sea-ice.
2014, 09, 30, 19.77537, 189th daily record for 2014
2014, 09, 14, 19.75260, Third 2014 record of Antarctic sea-ice.
2014, 09, 13, 19.73444, Second 2014 record of Antarctic sea-ice.
2014, 09, 12, 19.62641, First 2014 record of Antarctic sea-ice.
2014, 10, 01, 19.61080,190th daily record for 2014
2013, 09, 30, 19.57892, 2013 absolute record of Antarctic sea-ice.
2013, 09, 28, 19.57295,
2013, 10, 01, 19.57088,
2013, 09, 21, 19.56010,
2013, 09, 14, 19.55145, 2014, 09, 11, 19.54671,
2013, 09, 20, 19.53172,
2013, 09, 27, 19.51465,
2013, 09, 13, 19.50511,
2013, 09, 22, 19.50450,
2013, 09, 29, 19.50390,
2013, 09, 18, 19.50078,
2013, 09, 17, 19.49298, 2014, 09, 10, 19.48881,
2013, 09, 19, 19.48110,
2012, 09, 22, 19.47713, 2012 absolute record of Antarctic sea-ice.