The U.S. Supreme Court settled the issue: Whether, in 42 U.S.C. § 7411(d), an ancillary provision of the Clean Air Act, Congress constitutionally authorized the Environmental Protection Agency to issue significant rules — including those capable of reshaping the nation’s electricity grids and unilaterally decarbonizing virtually any sector of the economy — without any limits on what the agency can require so long as it considers cost, nonair impacts and energy requirements.
I have always been very interested in the environment. Nature teaches us so many lessons, the diversity of trees, birds, flowers and wildlife is breathtaking and giving cause to never cease to wonder. It would be a shame to destroy the beauty of it all. Yet we seem to make it worse by concentrating our effort by trying to limit CO2 emissions, rather than tackling the real and more urgent problems.
Let me first explain why I assert that rising CO2 levels, while real is only a minor player in the climate change equation.
The traditional way to approach this scientifically is making climate models. So far, nearly all, except the Russian model have failed to even remotely to predict future temperature changes. IPCC and all their climate models is still failing.
The other approach is to take measurements, and it so happens that we have really good global data for over 60 years. The Amundsen Scott – South Pole weather station, the average temperature of Winter season 2021 (April 2021 – September 2021) reached only -61,0°C / -78°F, and at this temperature CO2 is the dominant greenhouse gas by more than a factor of ten more important than water vapor. We have reliable measurements for the temperature change at the South Pole since 1957. During this time CO2 gas increased 31% to 413ppm, Methane increased 16% to 1.85 ppm and Nitrous oxide decreased, but this is a gas mostly confined to urban areas, and is now below 0.05 ppm worldwide. With CO2 increasing by 31% and water vapor negligible one would expect a temperature rise over 64 years of 0.65 C, or one degree Celsius warmer per century according to extrapolated lab measurements. This is the observed trend:
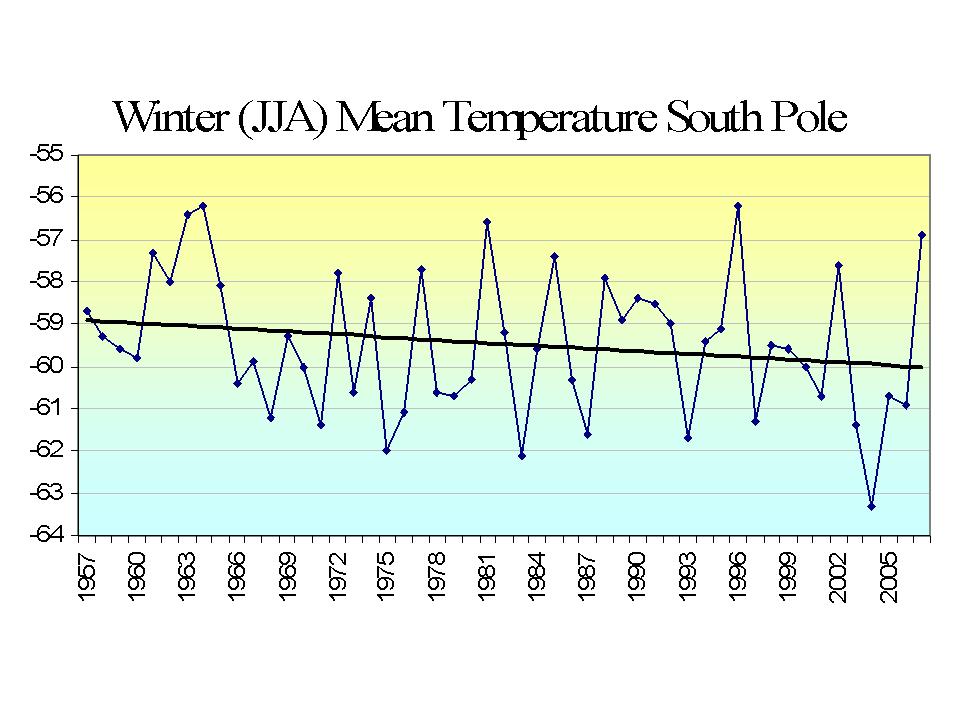
At the South Pole snowfall is negligible in the winter, and for the whole year it is only 1.3 inches. No model would have predicted the cooling trend, so there must be other factors that are are more important, since real measurements beat models every time.
Ignoring the South Pole, the climate models are from time to time adjusted, and as the urgency among the ruling class grew, they suddenly showed a much higher rate of future temperature increases, in this case what is supposed to happen to global temperatures for a doubling of CO2 from pre-industrial times, from 270ppm to 540ppm.
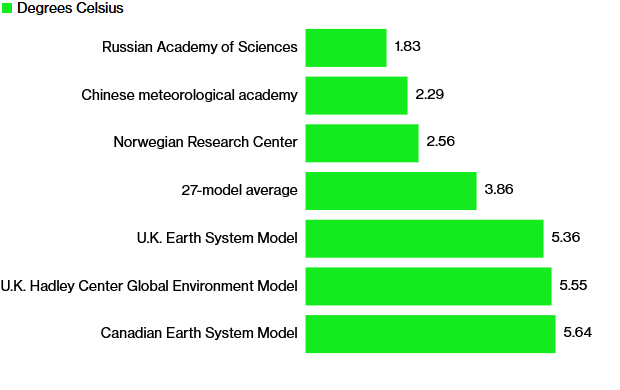
There are two ways to approach this problem. The models make certain assumptions about the behavior of the changing atmosphere and model future temperature changes. This is the approach IPCC has takenfor the last 34 years. These models all fail miserably when compared to actual future temperature changes.
The other way i to observe what is actually happening to our temperature over time as the CO2 increases. We have over 60 years of excellent global temperature data, so with these we can see where, when and by how much the earth has warmed.
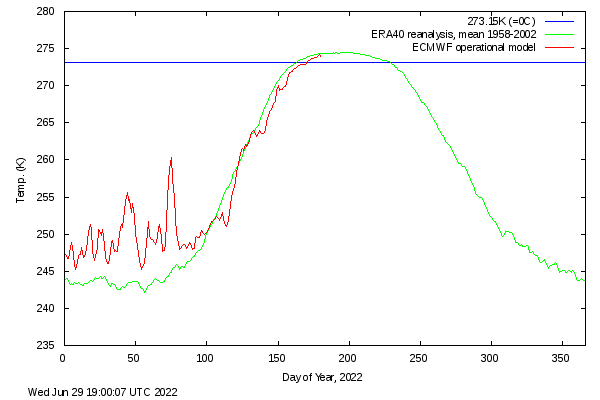
The most drastic temperature rise on earth has been in the Arctic above the 80th latitude. In the winter of 2018 it was 8C above the 50 year average. Since then it has come down to the more normal 4C increase. See charts from the Danish Meteorological Institute:
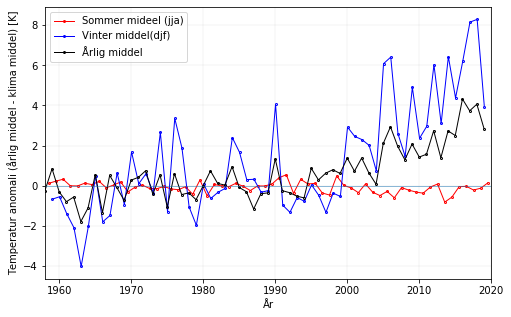
Note, there are no increase at all in the summer temperatures!
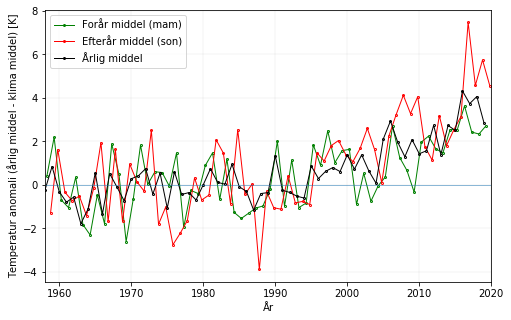
The fall temperature saw an increase of 4C and the spring temperature saw an increase of about 2.5C.
The 2022 winter saw an about 4c increase. The Spring temperatures have from the 10th of March were below or very close to the 1958 – 2002 average. Early Summer temperatures have so far been about 1C below normal. Source: DMI.
There seems to be no cause for immediate panic with the Arctic temperatures. If anything, they seem to moderate. In the Antarctic on the other hand temperatures have been decreasing! As we have seen before, the Amundsen Scott – South Pole weather station, the average temperature of Winter season 2021 (April 2021 – September 2021) reached only -61,0°C / -78°F, which is the coldest value in all-time history! This was 2,5°C /4.5°F degrees lower than the most recent 30-year average at this remote station.
Why are the temperatures not behaving like the models predict?
To get the answer we must study molecular absorption spectroscopy. IPCC and most scientists claim that the greenhouse effect is dependent on the gases that are in the atmosphere, and their combined effect is additive according to a logarithmic formula. This is true up to a certain point, but it is not possible to absorb more than 100% of all the energy available in a certain frequency band! For example: If water vapor absorbs 90% of all incoming energy in a certain band, and CO2 absorbs another 50% of the energy in the same band, the result is that 95% is absorbed, (90% + 50% * (100% – 90%)), not 140%, (90% + 50%).
The following chart shows both CO2 and H2O are absorbing greenhouse gases, with H20 being the stronger greenhouse gas, absorbing over a much wider spectrum, and they overlap for the most part. But it also matters in what frequency range s they absorb.

For this we will have to look at the frequency ranges of the incoming solar radiation and the outgoing black body radiation of the earth. It is the latter that causes the greenhouse effect. Take a look at this chart:

The red area represents the observed amount of solar radiation that reaches the earth’s surface. the white area under the red line represents radiation absorbed in the atmosphere. Likewise, the blue area represents the outgoing black body radiation that is re-emitted. The remaining white area under the magenta, blue or black line represents the retained absorbed energy that causes the greenhouse effect.
Let us now take a look at the Carbon Dioxide bands of absorption, at 2.7, 4.3 and 15 microns. The 2.7 and 4.3 micron bands absorb where there is little black body radiation, the only band that counts is at 15 microns, and that is in a band where the black body radiation has its maximum. However it is also in a band where water vapor also absorb, not as much as CO2,only about 20% to 70% as much. The important thing is that in the frequency band of 14.5 to 15.5 micron CO2 absorbs all the energy available in that spectral range, and it also did it before industrialization when CO2 levels were one third less than today!

From this we can see that increasing CO2 levels is not the cause of climate change, if anything, it is only a only a very minor player. How about Methane?
Methane has only two major absorption bands, one at 3.3 microns, and the other at 8 microns. The 3,3 micron band is where incoming radiation is negligible, and so is outgoing black-body radiation. The 8 micron band is where water vapor is dominant, so Methane turns out to be the don’t care gas.
Water vapor or absolute humidity is highly dependent on the temperature of the air, so at 30C there may be 50 times as much water vapor as CO2, at 0C there may be ten times as much water vapor, and at -25C there is more CO2 than water vapor. At those low temperatures the gases are mostly additive. In the tropics with fifty times more water vapor than CO2, increased CO2 has no influence on the temperature whatsoever. Temperature charts confirm this assertion:
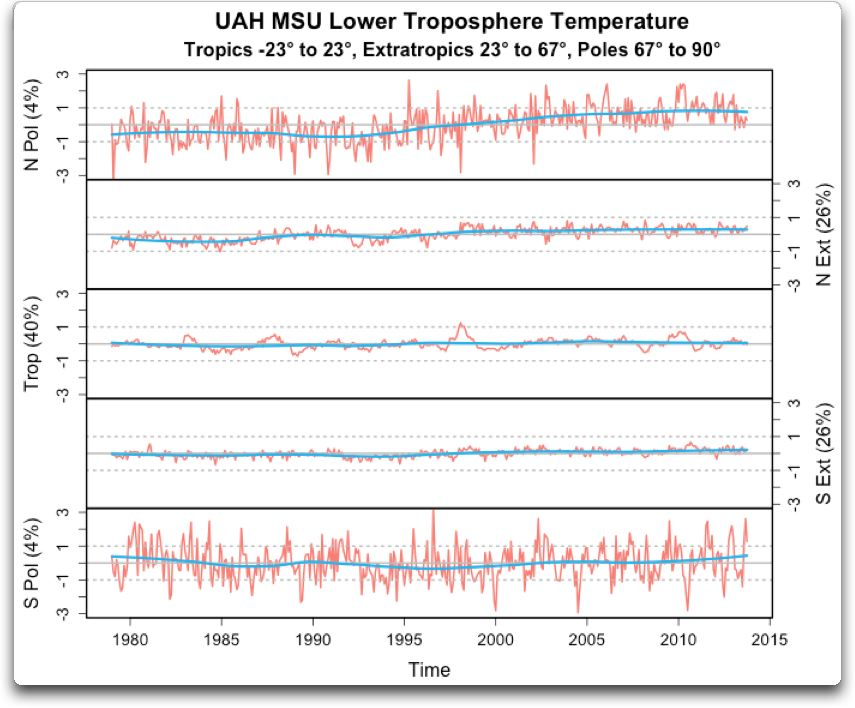
The temperature in the tropics displays no trend whatsoever. It follows the temperature of the oceans, goes up in an el niño and down in a la niña. The temperature in the southern hemisphere shows no trend. In the northern temperate region there is a slight increase, but the great increase is occurring in the Arctic. There is no increase in the Antarctic yet even though the increase in CO2 is as great in the Antarctic and the winter temperature in the Antarctic is even lower than in the Arctic. So CO2 increase cannot be the answer to the winter temperature increase in the Arctic.
There is an obvious answer. When temperatures increase the air can and will contain more moisture and transport this moisture from the tropics all the way to the arctic, where it ends up as snow. Is the snow increasing in the Arctic?
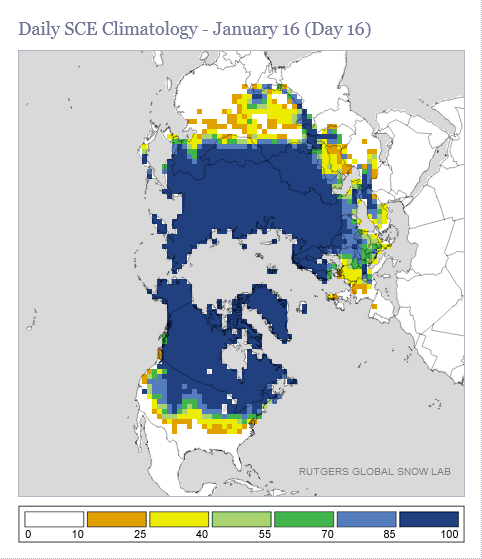
Let us see what the snow statistics show. These are from the Rutgers snow lab.
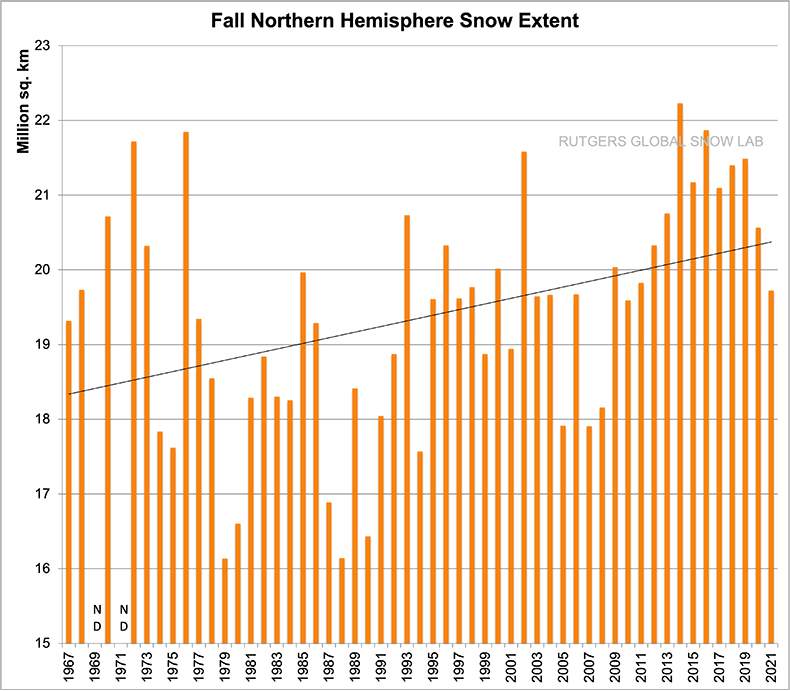
The fall snow extent is increasing, and has increased by more than 2 percent per year.
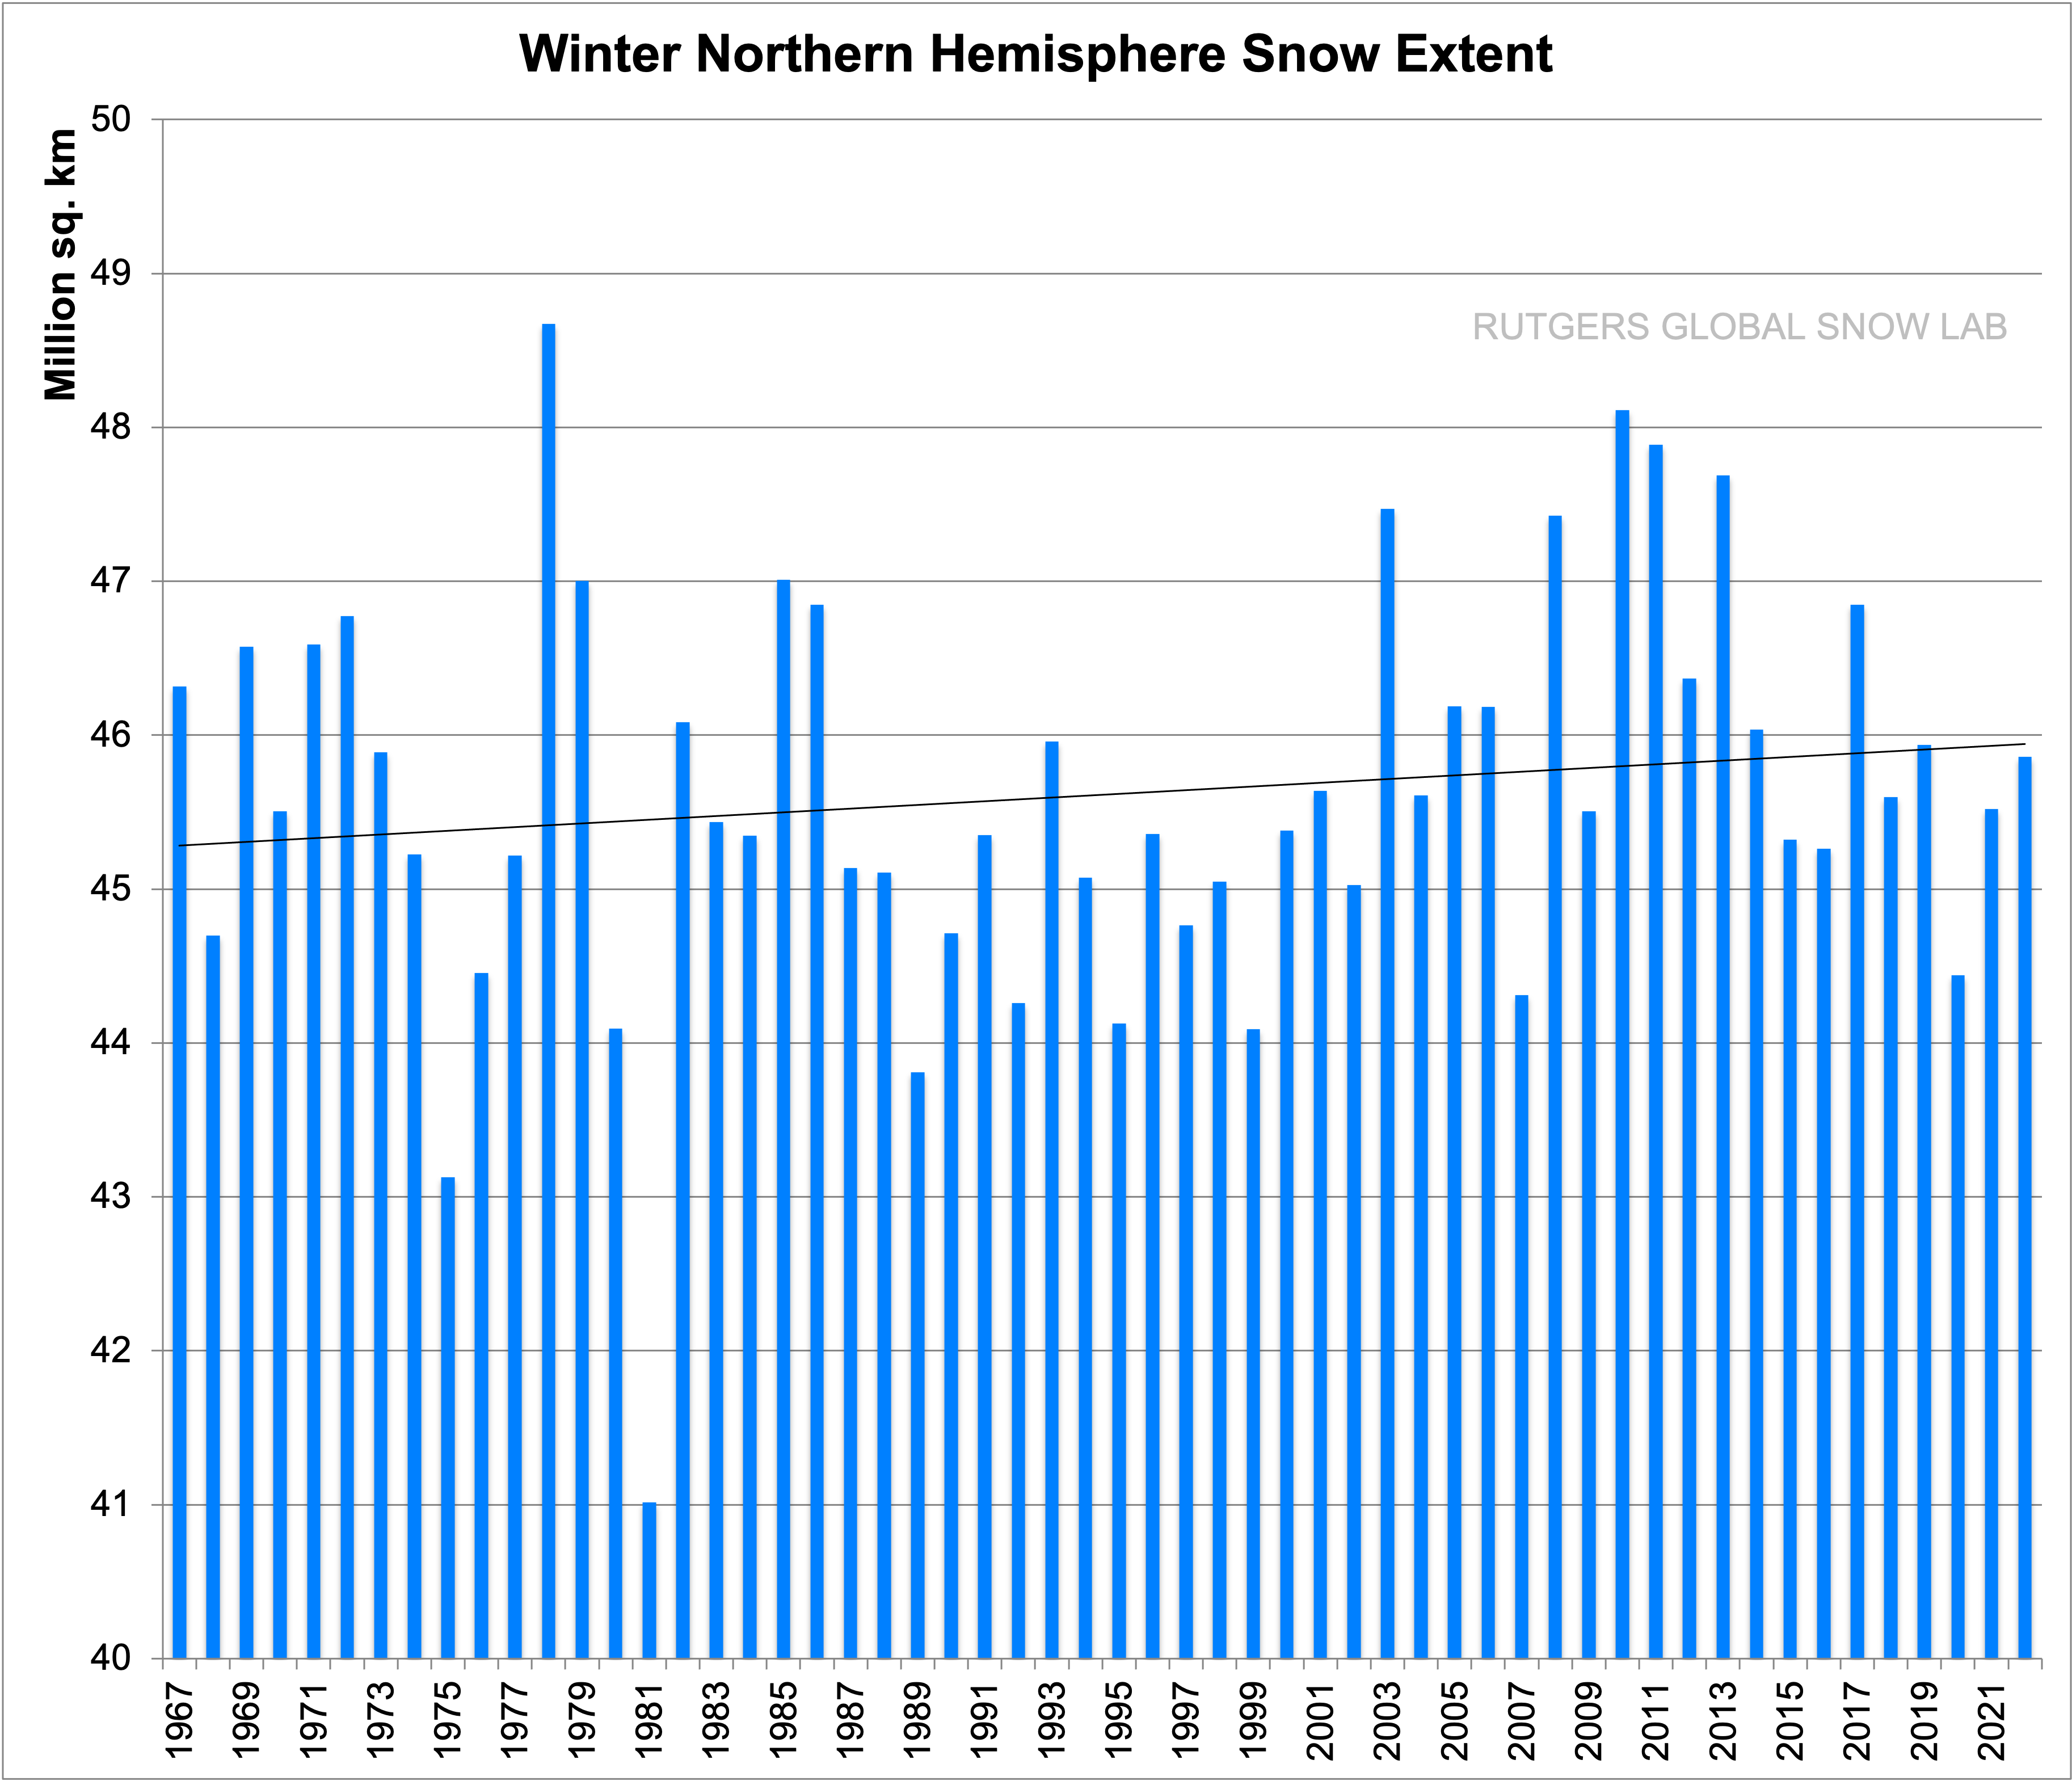
The winter snowfall has also increased but only by 0.04 percent per year. The snow covers all of Russia, Northern China, Mongolia, Tibet, Kashmir and northern Pakistan, Northern Afghanistan, Northern Iran, Turkey, most of Eastern Europe, Scandinavia, Canada, Alaska, Greenland and part of Western, Eastern and Northern United States.
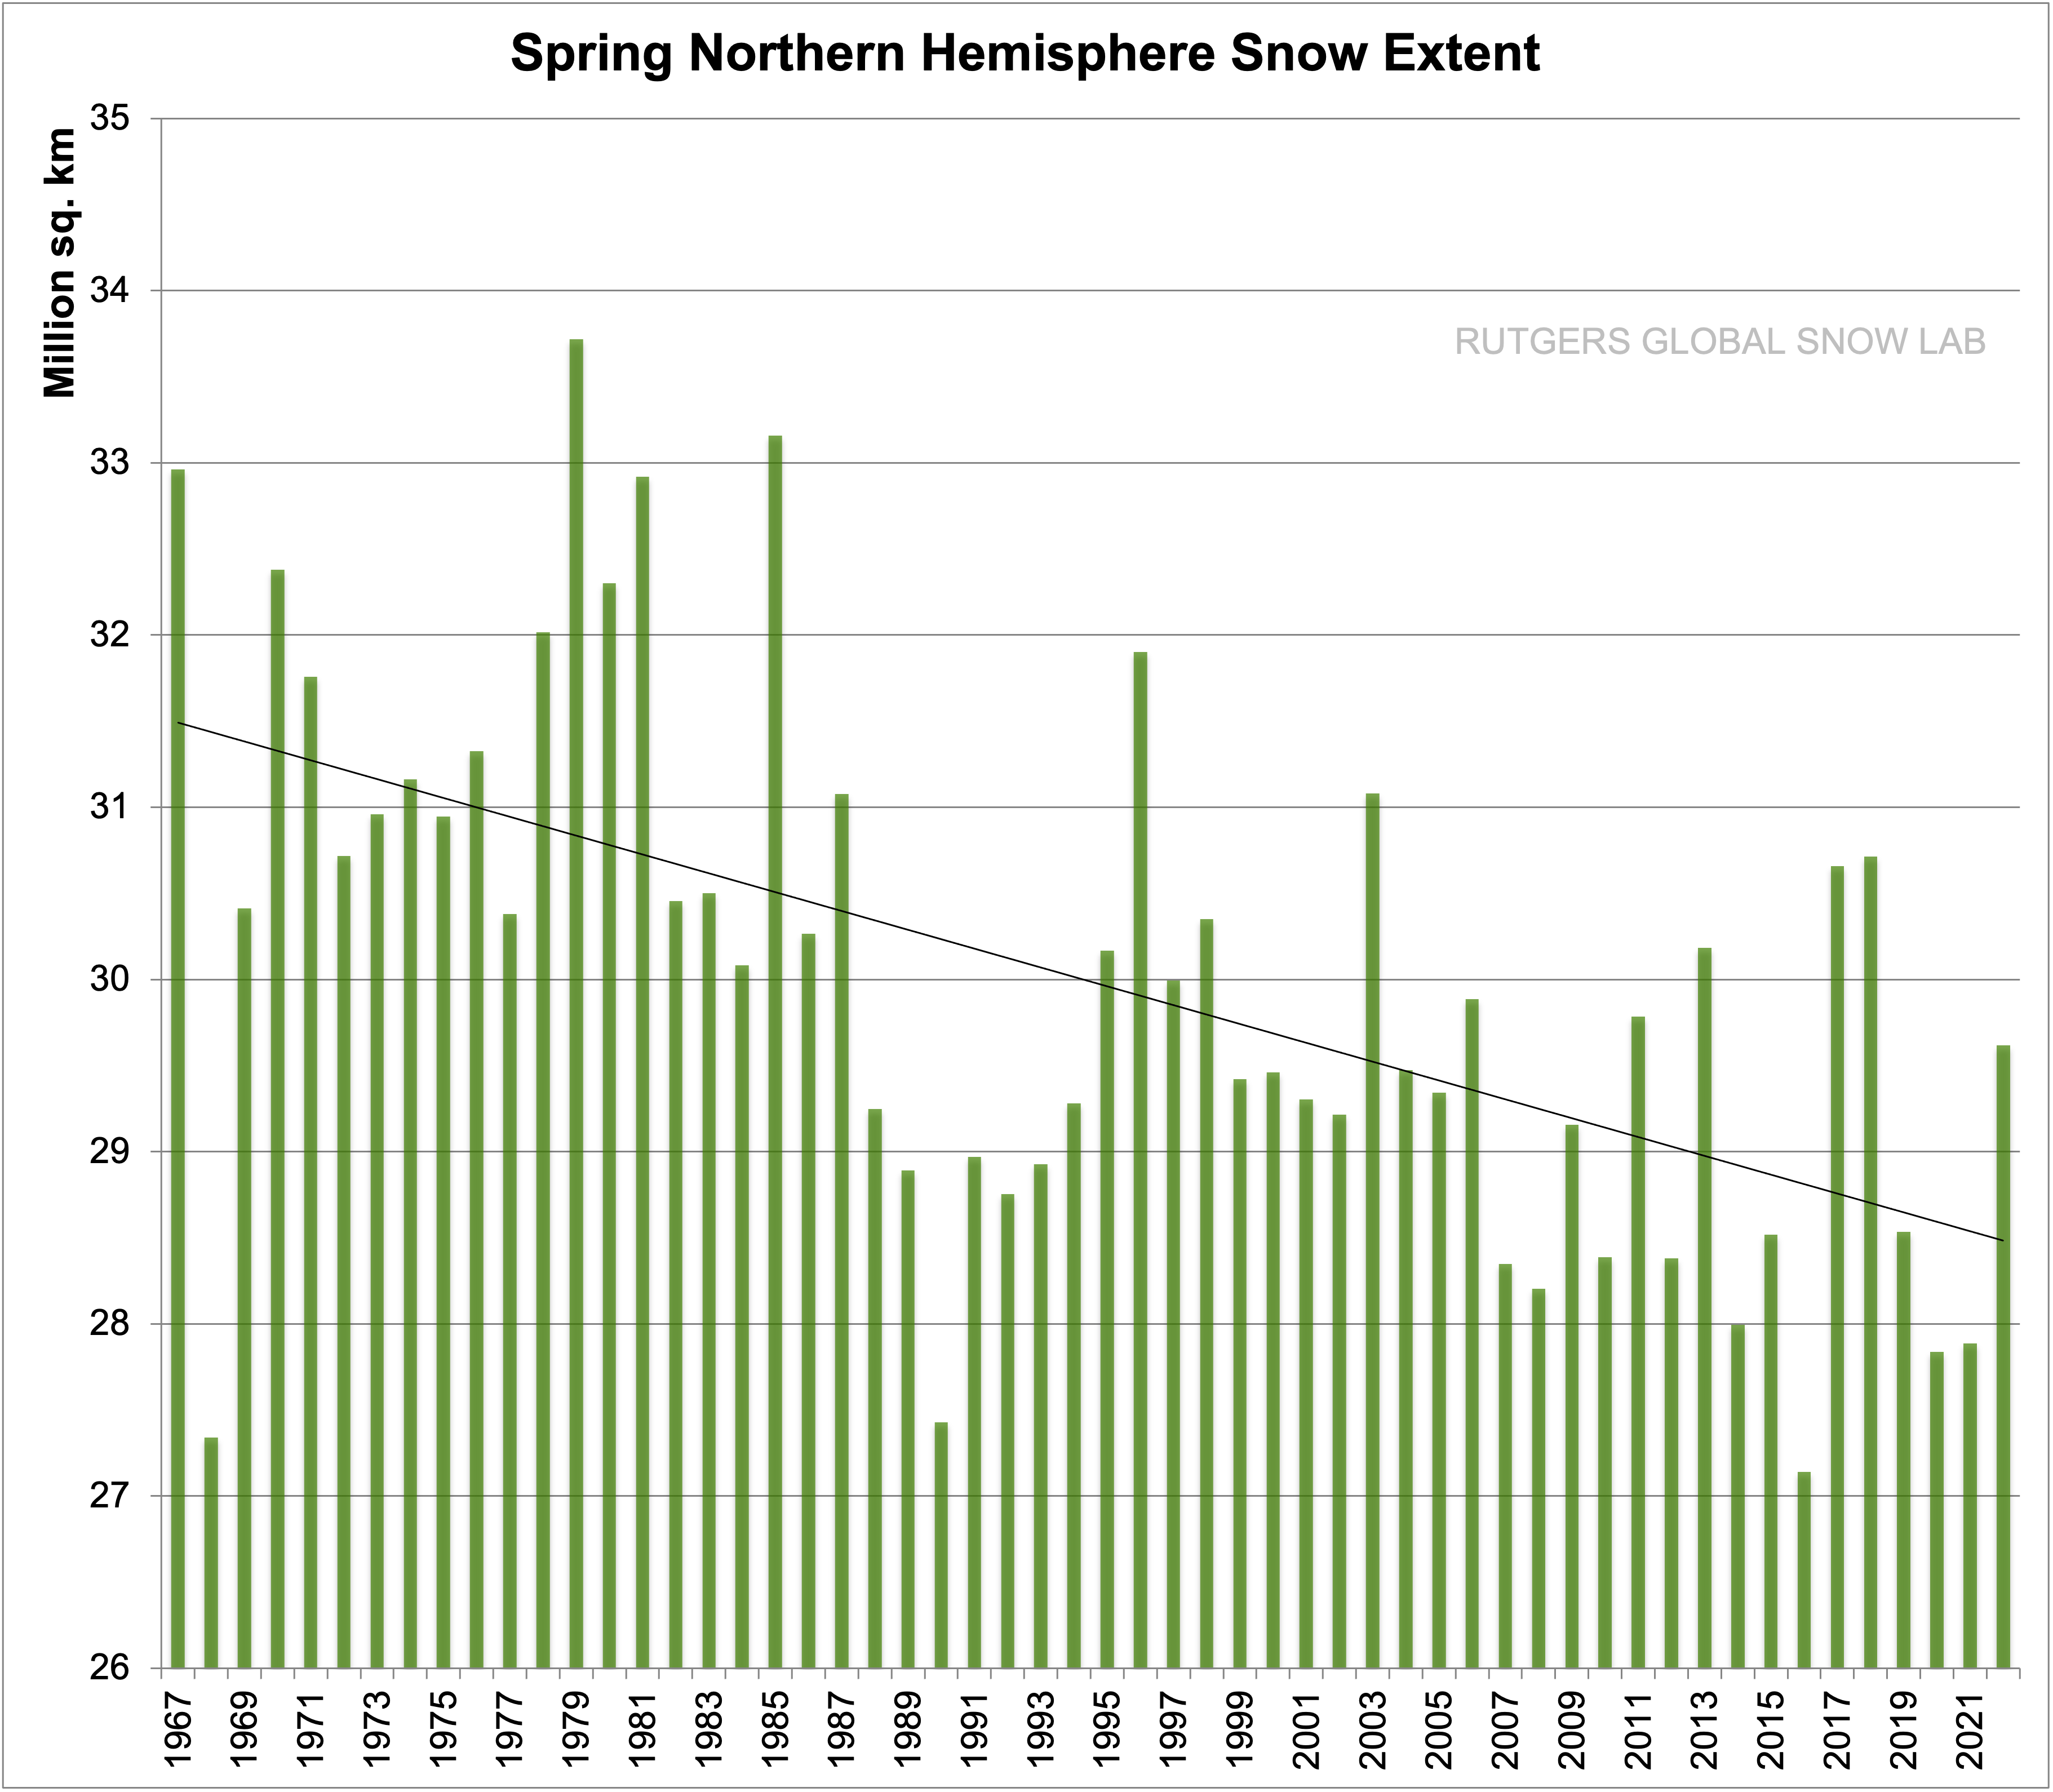
In the spring on the other hand the snow pack is melting faster, about 1.6 percent less spring snow per year. One of the major reasons for an earlier snow melt is that the air is getting dirtier, especially over China, and to some extent Russia. The soot from burning coal, wood and peat, and from mining dust changes the albedo of the snow. The soot is visible on old snow all the way up to the North Pole. The other reason is that the North Pole is getting warmer. In the fall and winter it is mostly due to increased snowfall, but in the spring, as soon as the temperatures rise over the freezing point, melting occurs earlier. But it takes longer time to melt the increasing snow, so the Summer temperatures remain unchanged or lower.
So the warming of the North Pole, far from being an impending end of mankind as we know it, may even be beneficial. A warmer North Pole in the winter means less temperature gradient between the pole and the tropics, leading to less severe storms. They will still be there, but less severe.
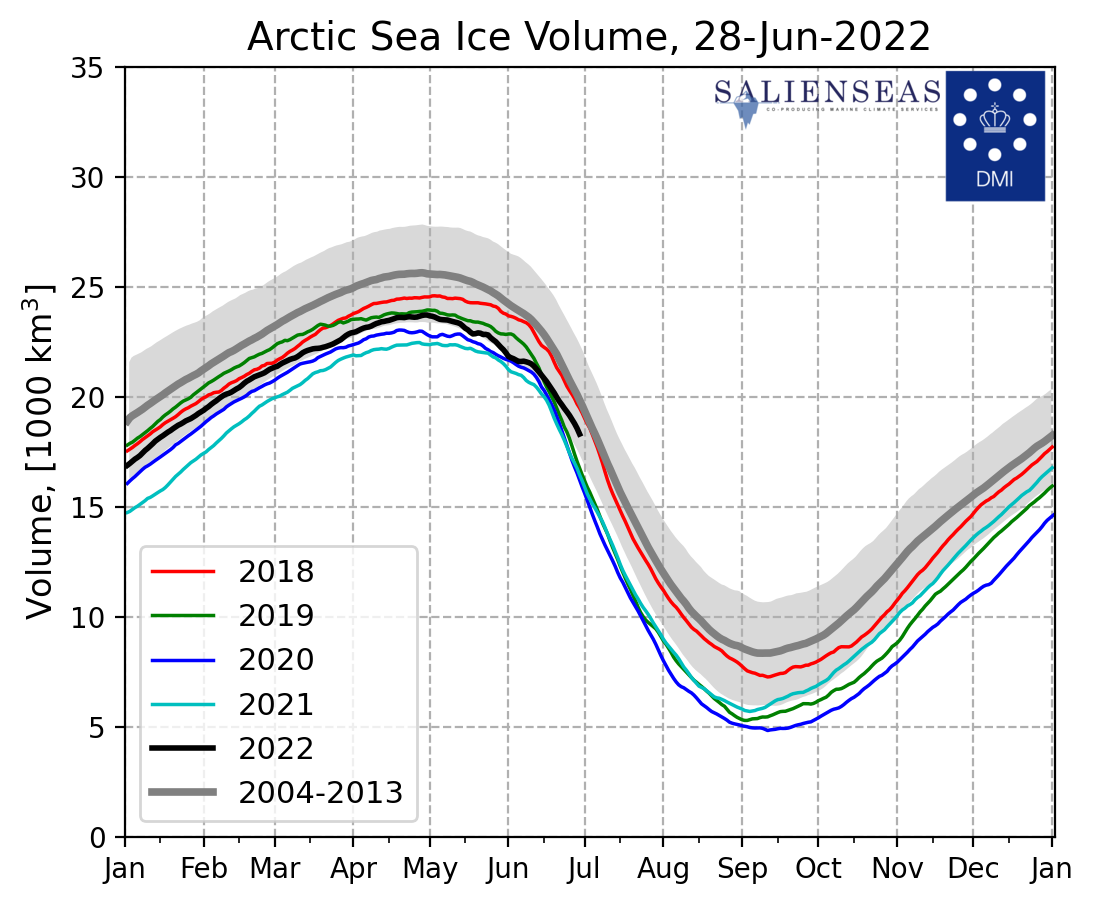
This year’s Arctic ice volume is greater ghan the previous 3 years. and the melting is slower. It is too early to tell if it is a real cooling of the climate, but it is worth noting
There is one great benefit of increased CO2, the greening of the earth!
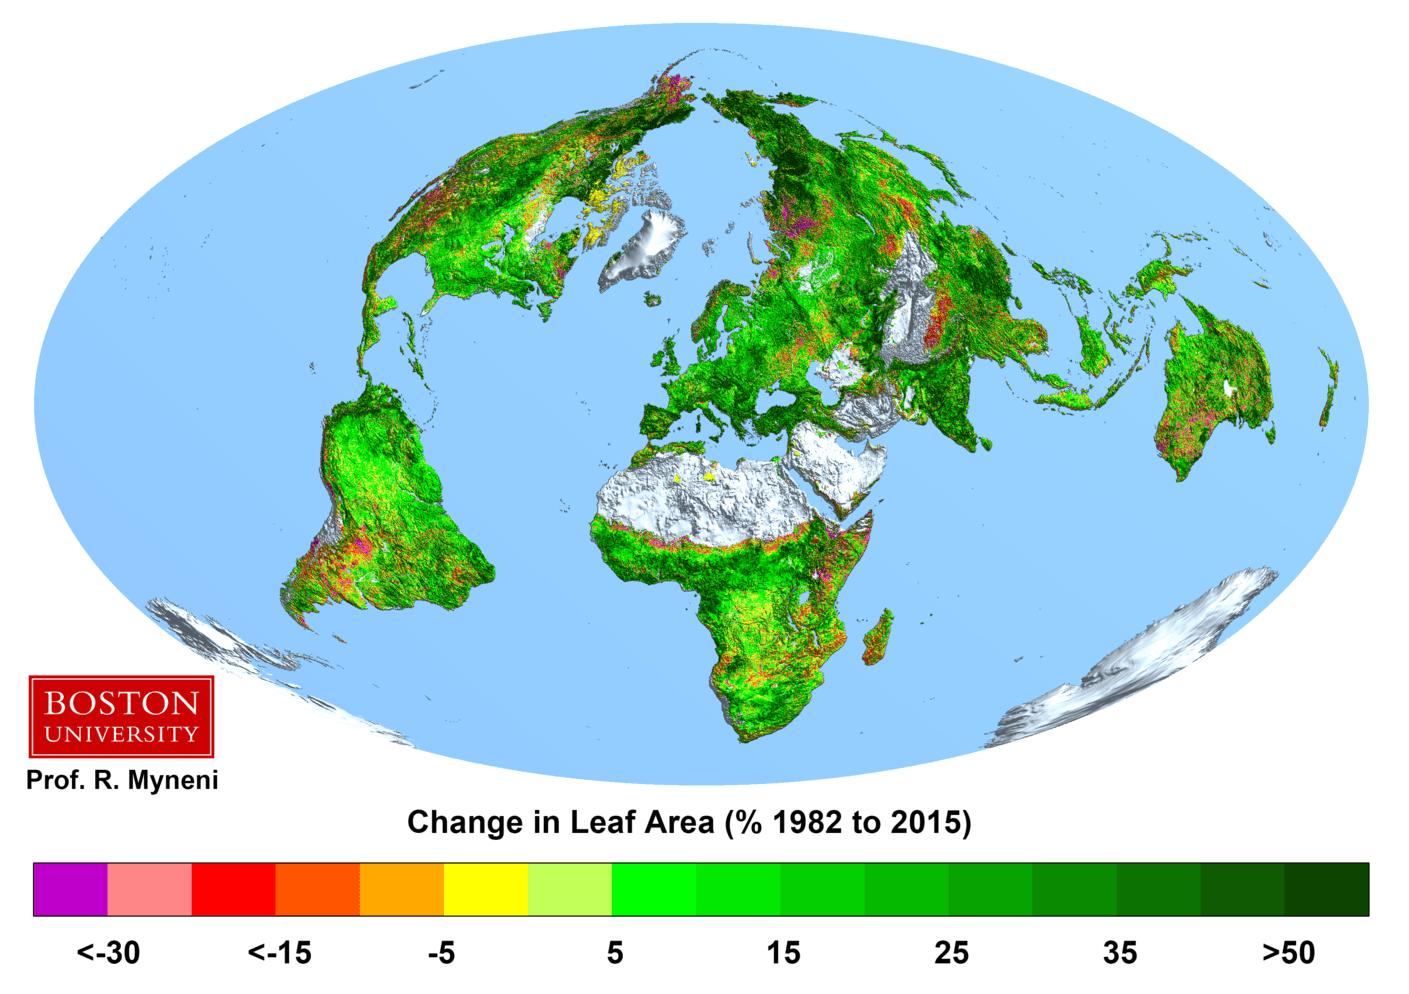
Thanks to this greening, done with only the fertilizing effect of increasing CO2, the earth can now keep another 2 billion people from starvation, not to mention what good it does for plants and wildlife.
