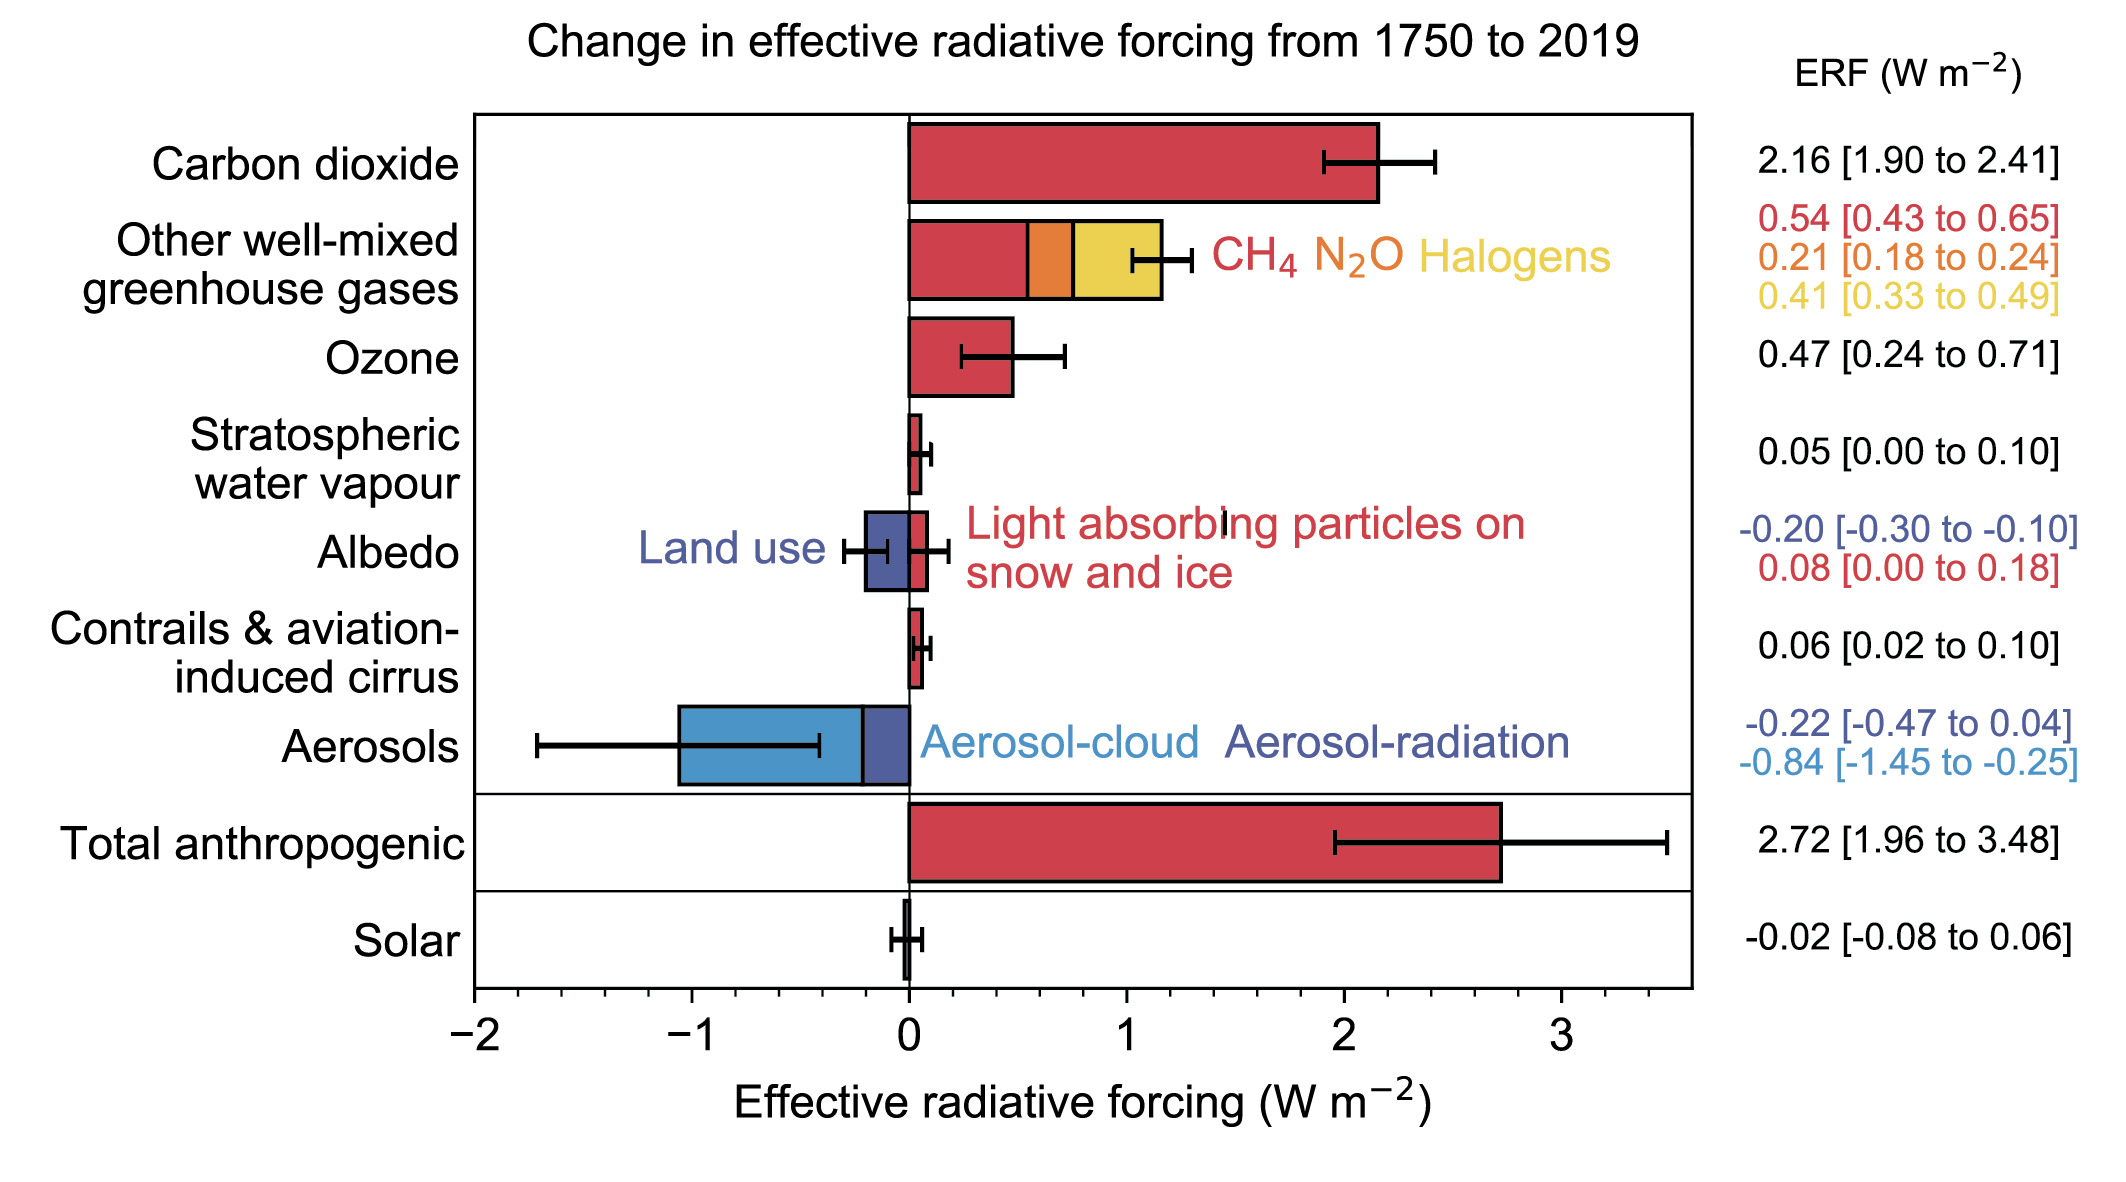
By far, the strongest greenhouse gas is water vapor, not because it is very strong of itself, but it absorbs nearly all outgoing energy in the infrared spectrum except in the so called atmospheric window, where it only partially absorbs. Yet water vapor is missing from the IPCC AR6 chart seen here:
IPCC has consistently treated the effect of greenhouse gasses as additive, but it is impossible to absorb more than 100% of all emitted energy for a given wavelength. This leads to an overestimation of absorption when 2 or more gasses are present. For example, if CO2 absorbs 90% of available energy at 13 μm and water vapor another 50%, the sum is 90% + (1 -0.9} * 0.5 = 95%, not 140%
This will change the relative importance of greenhouse gasses drastically so it must be tested against reality. We now have a good global satellite temperature record from 1980 to 2022 or 43 years:
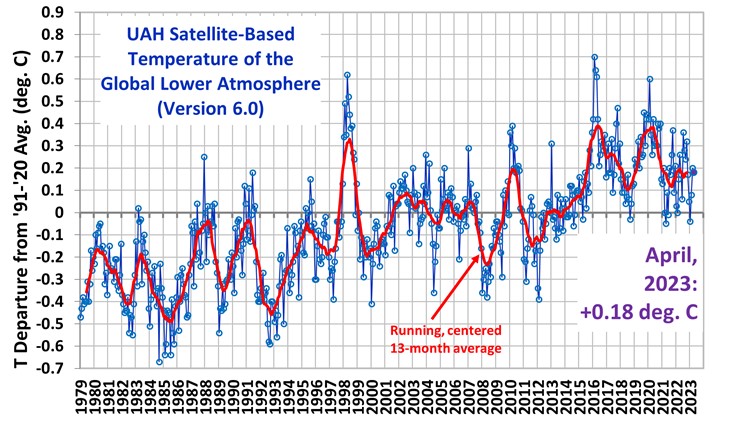
During this time the temperature rise was 0.5 C, which translates to 2.375 W/m2 ERF
Water vapor.
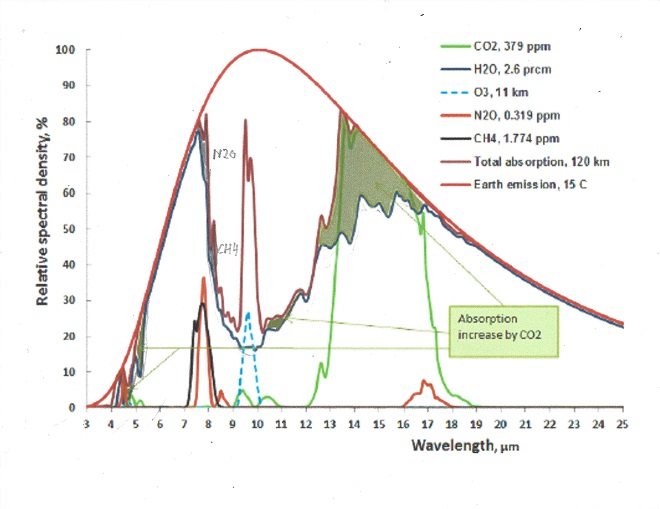
This is a good chart to see the relative importance of all major greenhouse gasses:
It is to be noted that water vapor also absorbs the incoming solar radiation in certain wavelengths, but solar influx is assumed to be constant.
When average temperature rises 0.5 C, the possible absorption rises by 2.375 W/m2 minus the energy that escapes through the atmospheric window.Water vapor through saturation: is responsible for all of this increase except where other gasses also absorb in the atmospheric window, and in the atmospheric window the absorption must be proportionally shared, subject to the 100% absorption limitation.The atmospheric window is about 26% of all the emitted radiation so net water absorption is 0.74 * 2.375 = 1.6 W.m2 or 0.34 C. However, the relative humidity is also decreasing, see picture:
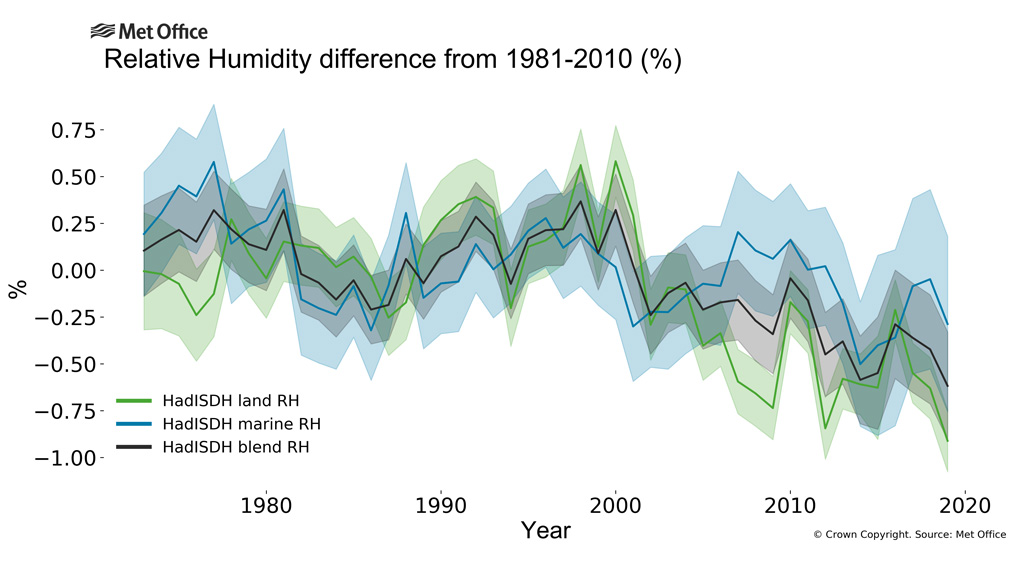
Between 1980 and 2022 the net humidity increase is 3.6% minus 0.75% relative humidity for a net increase of 3.54%. This increase only matters in the atmospheric window which is on average 25% saturated, so the total increase from water vapor is 0.26 * 2.375 * 0.25 * 0.9925 = 0.15 W/m2 or 0.03 C. This means that for a 0.5C temperature increase between 1980 and 2022 the total sensitivity to water vapor is 1.75 W/m2 or 0.37 C
Carbon dioxide
CO2 is the strongest greenhouse gas after water vapor. The only wavelength band that is meaningful is 13 to 17.4 μm and absorption occurs from both CO2 and water vapor. Since they exist together, the effect of each of them must be proportionally allocated, or the sum of them added would exceed 100%
Between 1980 and 2022 the CO2 levels rose from 335 ppm to 415 ppm or 24% increase. The temperature increase 0.5 C. The net temperature increase or ERF in the 13 to 17.4 μm band is 0.035C or +0.17 W/m2 for the water vapor and 0.04C or +0.19 W/m2 for the CO2. To see how the calculation was made, go to Appendix 1.
Methane.
Methane gas is created from a variety of sources, both man made and natural. See pie chart
The good thing about methane is that its lifetime in the atmosphere is only 10 to 15 years, and the real contribution to climate change is only 1/5th of what is commonly advertised, since iits absorption bands occur together with partly saturated absorption from water vapor. See appendix 2.
In 1980 the CH4 concentration was 1.6 ppm and will be 2.0 ppm in 2022 which results in an increase of the greenhouse effect of 0.035 C or 0.17 W/m2 ERF from rising levels of Methane since 1980.
N2O.
Atmospheric N2O levels averaged 336 ppb (parts per billion) during 2022, about and was 301 ppb in 1980. It is a 300 times stronger greenhouse gas than CO2 by itself, because its absorption is not saturated in the atmosphere. When water vapor is dominant it is diminished by over 70% since it is at the edges of the Atmospheric window. For calculations see Appendix 3.
In 1980 the N2O concentration was 0.3 ppm which results in an increase of the greenhouse effect of 0.0065 C or 0.031 W/m2 ERF from rising levels of N2O since 1980 .
Ozone.
Ozone occurs as stratospheric O3 which is good. It protects us from uv radiation. O3 in the troposphere is considered harmful if it is over 0.08% It is normally around 0,01% in the troposphere. For calculations and figures, see appendix 4.
When the earth’s temperature rises by 0.5C, from 1980 to 2022, the amount of tropospheric O3 probably rises by 2% (Lacking good data I am guessing wildly, in urban areas it may be much more, but this is global average). This comes to 0.0034C temperature increase or 0.016 W/m2 ERF from O3, from 1980 to 2022.
CFC gasses.
CFC’s are cheap and efficient gasses to use in refrigerators and air conditioners.Their use rose rapidly until it was discovered they destroyed the protective ozone layer in the stratosphere, so its use, got banned in 1994, later diminished including its use in inhalers. CFCs has since diminished slowly and is maybe already below the levels in 1980. See also Appendix 5.
HFC gasses.
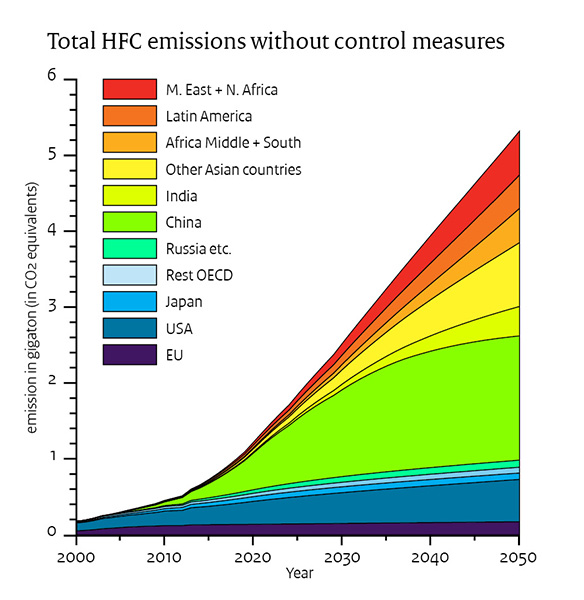
HFCs replaced CFCs and are rapidly growing in use, and the compressor seals still leak. For pictures on why they are a growing concern for the future, see Appendix 6.
The temperature increase from 1980 to 2022 was 0.0015 C or 0.007 W/m2 ERF.
The following are non greenhouse effect causes for climate change.
Clouds.
The cloud cover of the earth has decreased by 3.15% from 1980 to 2022 The total reflection from clouds and atmospheric scattering is 77 W/m2, of which 60 is from cloud reflection. A 3.15% loss of area of reflection leads to a decreasing of incoming energy of 60 * 0.0315 = 1.89 W/m2. This results in a temperature increase 0.39 C. See more at Appendix 7.
The warming of the Northern Arctic region.
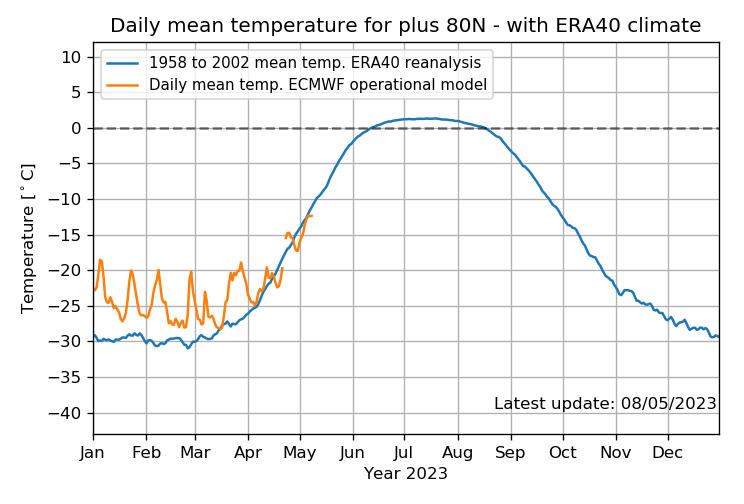
the Northern Arctic region is warming.This affects about 4% of the earth’s surface, so the total temperature increase from over-fertilizing the rivers is 0.04 * 2.5 = 0.1 C. or 0.475 W/m2. No such effect occurs in the Antarctic. To illustrate the current yearly temperature trend in the Arctic, see this current polar temperature chart: See more at Appendix 8a.
The effect of various air pollution.
If U.S is eliminating all remaining coal plants the CO2 will still be rising since China is planning to build another 1070 coal burning power plants by 2030. The effect of rising non cloud generating aerosols probably caused a temperature decrease of 0.1C or 0.5 W/m2 since 1980. The rapidly increasing air pollution led to the fear of the rapidly coming ice age in the 1970s. Discussion at Appendix 8b.
The effect of greening of most of the earth.
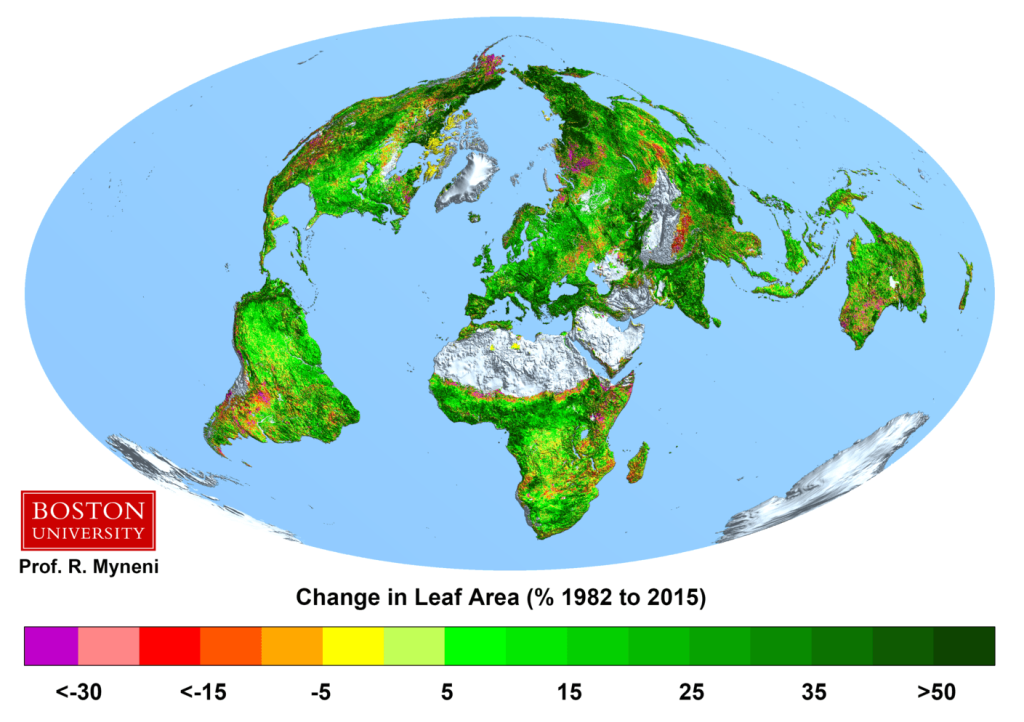
Thanks to this greening, about 15% more leaves and grass since 1982, done with only the fertilizer of CO2, the earth can now keep another 2 billion people from starvation, not to mention what good it does for plants and wildlife.
The total reflection of sunlight from the earth is 22.9 W/m2, so 0.13% of that is 0.030 W/m2,, or 0.0063 degree Celsius. See more at Appendix 8c.
The areas that are becoming more like a desert.
The area subject to desertification is about 0.6% of the world’s land area and rising the albedo by 0.05 leads to a cooling down. The average albedo of the earth is 30%, and before desertification the albedo was 25%, this rises the albedo of the earth by 0.03%. The total reflection of sunlight from the earth is 22.9 W/m2, so 0.03% of that is 0.007 W/m2, or a cool down of 0.0015 degree Celsius. See more at Appendix 8d.
Summary of all causes for climate change from 1980 until 2022:
Effect from rising CO2: 0.04C or 0.19 W/m2; 4,66% of total
Effect from increasing water vapor: 0.37 C or 1.75 W/m2; 42.9% of total
Effect from rising Methane: 0.036 C or 0.17 W/m2, 4.17% of total
Effect from rising N2O: 0.0065 C or 0.031 W/m2 0.8% of total
Effect from rising Ozone: 0.0034C or 0.016 W/m2 0.4% of total
Effect from rising HFCs : 0.0015 C or 0.007 W/m2 0.2% of total
Effect from decreasing cloud cover: 0.39 C or 1.89 W/m2. 46.4 % of total
Warming of the Northern Arctic: 0.1 C. or 0.475 W/m2; 11.6% of total
Cooling from pollution aerosols: 0.1 C or 0.475W/m2; – 11.6% of total
Temperature increase from greening of the earth 0.0063C or 0.030 W/m2; 0.7% of total
Temperature decrease from areas of desertification 0.0015C 0.007 W/m2; 0.2% of total
TOTAL TEMPERATURE CHANGE 1980 to 2022: 0.8522 C or 4.077 W/m2
Appendix 1, CO2
The following chart shows both CO2 and H2O are absorbing greenhouse gases, with H20 being the stronger greenhouse gas, absorbing over a much wider spectrum, and they overlap for the most part. But it also matters in what frequency ranges they absorb.

For this we will have to look at the frequency ranges of the incoming solar radiation and the outgoing black body radiation of the earth. It is the latter that causes the greenhouse effect. Take a look at this chart:

The red area represents the observed amount of solar radiation that reaches the earth’s surface. the white area under the red line represents radiation absorbed in the atmosphere. Likewise, the blue area represents the outgoing black body radiation that is not absorbed. The remaining white area under the magenta, blue or black line represents the retained absorbed energy that causes the greenhouse effect.
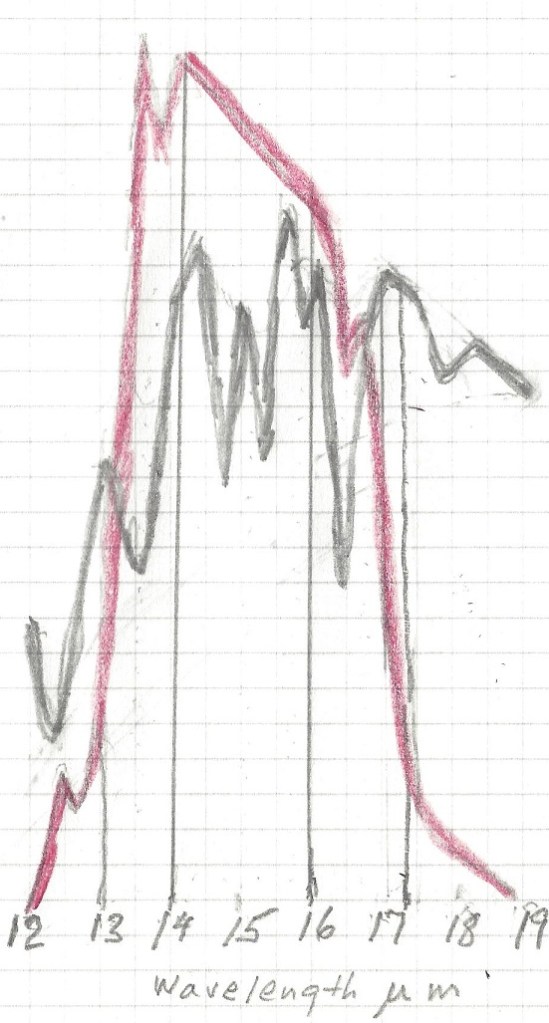
Let us now take a look at the Carbon Dioxide bands of absorption, at 2.7, 4.3 and 15 μm. Of them the 2.7 and 4.3 μm bands absorb where there is little black body radiation, the only band that counts is at 14.9 μm, and that is in a band where the black body radiation is near its maximum. Let us first consider the CO2 alone in a dry atmosphere, that is one with no water vapor at all. We will investigate the concentration of 335 ppm (in 1980) and 415 ppm (in 2022)

The very top line of the top black band represents total absorption at 415 ppm, the bottom of the black black band represents absorption at 335 ppm. Divide the frequency spectrum in 3 parts, below 14 μm, 14-16 μm, and above 16 μm, In the 13 to 14 μm band 66% of available energy is absorbed at 335 ppm, 70% at 415 ppm. in the 14 to 16 μm band 100% of available energy is absorbed at both 335 and 415 ppm. In the > 16 μm the numbers are also 66 and 70%. In addition, temperature is 0.5 C higher at 415 than at 335 ppm, so available energy is 0.7 % higher at 415 ppm.
The net result is greenhouse gas contribution for CO2 is 5.10 C at 335 ppm and 5.26 C at 415 ppm and 1.5C higher ambient temperature for a dry atmosphere.
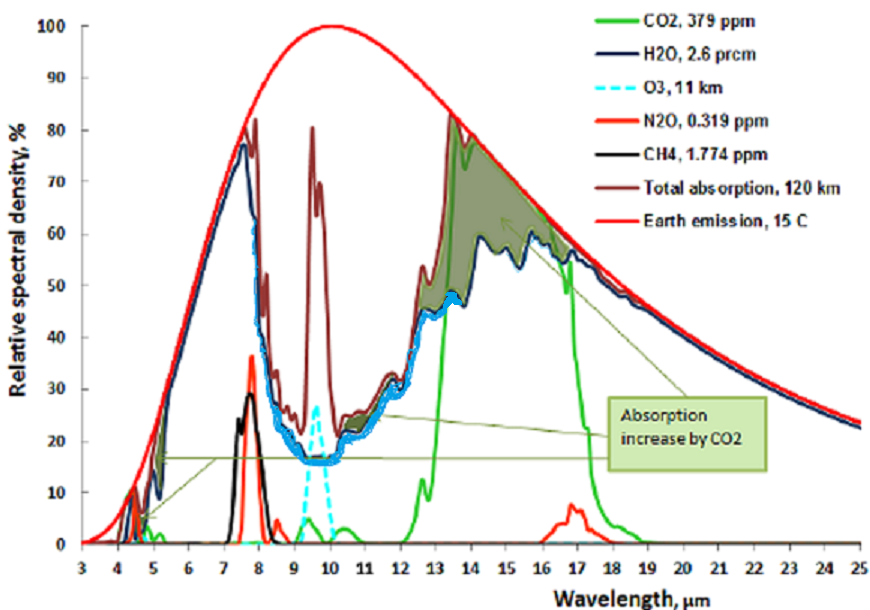
The normal way to account for greenhouse gasses contribution is to simply add together the CO2 contribution and the contribution from water vapor. This leads to the wrong result for in doing so, the total result is more than 100% for some energy band, because it is impossible to add more than 100% of all available energy for a given wavelength. Again, the spectrum of interest is 13 to 17.4 μm.
The first thing to notice is that no absorption exceeds 100% , so at 14.9 μm wavelength CO2 absorbed 100%, and water vapor absorbed another 75%, the total sum is still 100%. It is impossible to absorb more than 100% of the total energy available for that wavelength. Therefore between the wavelengths 14 and 16 μm all energy was absorbed regardless of CO2 concentration and water vapor concentration. The only fair way to allocate the absorption is proportionally, 57% to CO2 and 43% to water vapor. Likewise, the 13 to 14 μm band is not fully saturated, so the total absorption is 62% of available energy for CO2 and 33% for water vapor. In the 16 to 17.4 μm range the total absorption is 44% for CO2 and 55 % for water vapor. For CO2 at 335 ppm and average temp 13.5 C the total temperature rise, when proportionally allocated comes to 2.73 C for the CO2 and 2.30 C for the water vapor. For CO2 at 415 ppm and an average temp 0.5 C higher, at 14 C average the net temperature increase or ERF in the 13 to 17.4 μm band is 0.035C or +0.17 W/m2 for the water vapor and 0.04C or +0.19 W/m2 for the CO2.
Appendix 2, Methane
Atmospheric methane levels averaged 2.0 ppm (parts per million) during 2022, or around 25% greater than in 1980. It is a 28 times stronger greenhouse gas by itself unlike CO2, because its absorption is not saturated in the atmosphere. On the other hand the lifetime of Methane in the atmosphere is 10 to 15 years, some of the Methane eating bacteria will do its job. There is only one significant absorption band that absorbs in the atmospheric window at 7.7 μm, at the edge of the atmospheric window.
The picture shows a small peak at 7.7μm. This is because at lower wavelengths absorption from water vapor has nearly eliminated the CH4 contribution. Remember that total absorption can never exceed 100 %, so the maximum absorption from CH4 occurs at 7.7μm. At 1.6 ppm it amounts to a greenhouse effect of 0.68 C for a dry gas.
The only major absorption line at 7.7 μm has two side lobes, at 7.5 and 7.9 μm. In the 7.5 μm sideband water vapor already absorbs nearly all energy, so the NH4 is of little effect. In the 7.9 μm sideband water vapor is 50% saturated at that level and the NH4 net absorption is 20% the net greenhouse effect is one fifth of the effect for a dry gas, or 0.14 C. In 1980 the CH4 concentration was 1.6 ppm and will be 2.0 ppm in 2022 which results in an increase of the greenhouse effect of 0.035 C or 0.17 W/m2 ERF from rising levels of Methane since 1980
Appendix 3, N2O.
Atmospheric N2O levels averaged 336 ppb (parts per billion) during 2022, about and was 301 ppb in 1980. It is a 300 times stronger greenhouse gas than CO2 by itself, because its absorption is not saturated in the atmosphere. When water vapor is dominant it is diminished by over 70% since it is at the edges of the Atmospheric window. On the other hand the lifetime of N20 in the atmosphere is short and is typically greatest at 5 p.m. One of the major reasons for the N2O increase is the increase of fertilization with nitrates, the other is from diesel fumes from trains, boats, ships, trucks and mining equipment
The picture shows a double N2O peak at 7.4 and 7.8 μm. . At 0.336 ppm in 2022it amounts to a greenhouse effect of 0.325 C for a dry gas. In the 7.4 μm band water vapor is saturated, in the 7.8 μm band 80% is saturated by water vapor.In 1980 the N2O concentration was 0.3 ppm which results in an increase of the greenhouse effect of 0.0065 C or 0.031 W/m2 ERF from rising levels of N2O since 1980 .
N2O is commonly called laughing gas, and is hazardous in high concentrations, and should be limited in confined places, but in concentrations of under 1 ppm nobody laughs because of that.
Appendix 4, Ozone.
Ozone or 03 is good if it is in the stratosphere. There it helps to absorb the ultraviolet and cosmic rays from the sun and other cosmic radiation. Ozone is bad if it is near the ground. The total proportion of O3 in the troposphere is about 0.01 ppm, yet it is a substantial greenhouse gas because it forms by uv radiation in the stratosphere and mesosphere, and thus protecting us from uv damage. See figure:
The O3 in the troposphere on the other hand is bad. It is normally around 0.01 ppm, but is considered damaging if people are exposed to more than 0.08 ppm in an 8 hour period. This can happen in urban environments in warm and stagnant weather, typically through car traffic. It is a great greenhouse gas because its main absorption band is at 9.5 μm, right in the atmospheric window where the outgoing black body radiation is the greatest. See fig:
The dotted blue line at 9.5 μm represents the tropospheric absorption, the total absorption is between the brown and the solid blue line. The total greenhouse effect from O3 is 0.88C, but the stratosphere does not interact very much with the troposphere, so the stratospheric O3 does not count as a greenhouse gas, only tropospheric O3. The total contribution to the greenhouse effect from tropospheric O3 is about 1/5 of the total, because atmospheric O2 absorbs in the same band limits the temperature rise to 0.17C When the earth’s temperature rises by 0.5C, from 1980 to 2022, the amount of tropospheric O3 probably rises by 2% (Lacking good data I am guessing wildly, in urban areas it may be much more, but this is global average). This comes to 0.0035C temperature increase or 0.016 W/m2 ERF from O3, from 1980 to 2022.
Appendix 5, CFC gasses.
ChloroFluoroCarbon (CFC) gasses started to be manufactured at the beginning of the refrigeration age, replacing ice as the refrigerant. It soon appeared in the atmosphere, mostly due to leaks in the air conditioner compressor seals. It didn’t amount to much as a greenhouse gas even though it was five thousand times more efficient than CO2 as a greenhouse gas. It was discovered that CFCs ate up the Ozone in the stratosphere, and if it continued to increase it could deplete the protective Ozone layer faster than it could be produced. In fact it created an Ozone hole over Antarctica. So it got forbidden Jan 17, 1994, In 2020 even China stopped production. Since 1994 CFC are decreasing by about 1% per year, but cheating persisted, especially among poorer nations and China. By 2022 it will probably have a greenhouse effect of 0.01C or 0,05 W/m2 ERF.
Appendix 6, HFC gases.
CFC started to be phased out and replaced by HydroFluoroCarbons (HFC), less efficient and more expensive, but at least they do not deplete the Ozone layer that protects us from cancer. Some of the HFCs are even bigger greenhouse effect generators than CFC, but well worth it to protect the Ozone layer. Their biggest absorption bands are in the middle of the atmospheric window.
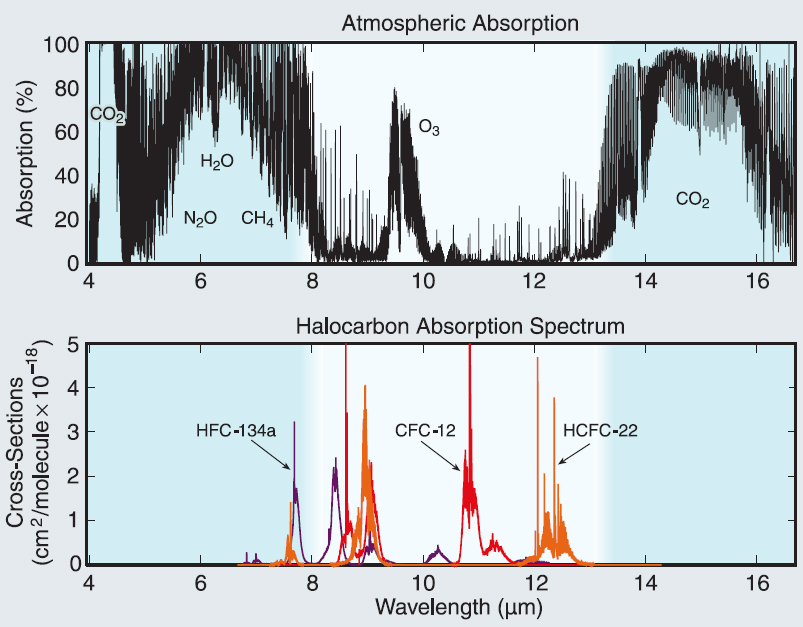
If nothing is done to control them they will increase from nothing in 1980 until 2022 and beyond. See fig: NOAA Research News
The temperature increase from 1980 to 2022 was 0.0014 C or 0.007 W/m2 ERF..
Appendix 7. The effect from decreasing cloud cover.
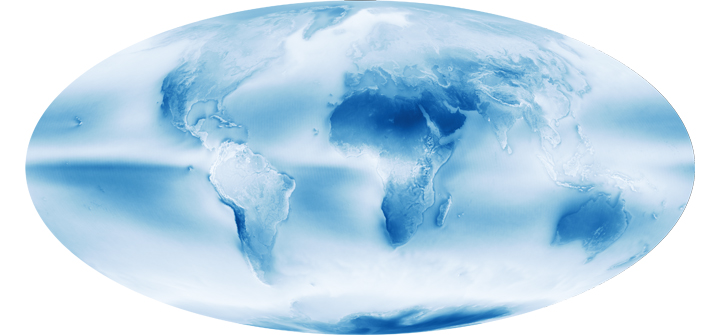
This is a world map showing the average cloud cover in August 2009. It shows the cloud free areas of the earth in blue. Another way to look at it is to see how much total water vapor there is in the atmosphere:
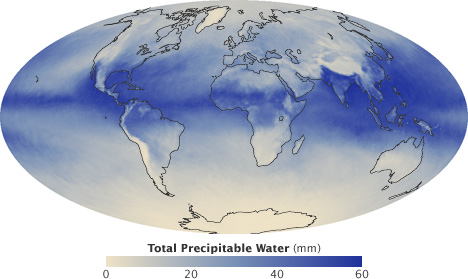
Nowhere on earth can it rain out more than two inches without more humidity being transported in from another place. Over the ocean humidity gets replenished by evaporation, over land only areas that has vegetation or swamps or lakes will replenish humidity by evaporation. Keep these charts in mind for later. For now concentrate on the decreasing average cloud cover. It has only been measured for the last 40 years, but here are the results:
There are many different clouds, low, mid-level and high clouds, and they have changed differently over the same time span:

Of these clouds, the low level clouds are reflecting the most, so the 2.4% loss in average cloud cover is an assumption on the low side on the loss of reflection.
In 1984 the average cloud cover was 63.7%, in 2019, 35 years later it was 61.1%, a loss of 2.6%. over 35 years or 0.075% /year. This amounts to a loss of 3.15% from 1980 to 2022 if the trend held for the extra years. The total reflection from clouds and atmospheric scattering is 77 W/m2, of which 60 is from cloud reflection. A 3.15% loss of area of reflection leads to a decreasing of incoming energy of 60 * 0.0315 = 1.89 W/m2. This results in a temperature increase 0.39 C.
Appendix 8. The effects from air and water pollution. a. The warming of the Northern Arctic region.
North America has great rivers, none greater than the mighty Mississippi. It used to be a meandering river with frequent floods that resulted in depositing its silt over large areas and thus fertilizing the land. The American Indians living by the river moved to its new location after the water receded, and they could use the newly fertilized land. After the Louisiana purchase river traffic grew rapidly, but shifting sandbars and the excessively winding river became a problem, so the Mississippi river was converted to be the main transportation artery of the middle USA, the river banks were reinforced and the course of the river straightened. This meant that more of the silt was transported out into the Mexican Gulf, some of the silt that used to fertilize the soil instead fertilized the Mexican gulf. In addition, the Mississippi river used to be very polluted, but is now clean enough that it can be used for drinking water after treatment all the way down to Louisiana. There remains elevated concentration of nitrogen compounds so the Mexican Gulf suffers from excessive algae blooms and even red tide from time to time. This leads to more cloud formation and more rain in the United States east of the 98th meridian. This also occurs in Northern Europe, especially in the North Sea; the rivers flowing into the North Sea are rich in nutrients. The Baltic Sea was near oxygen death, but after the Baltic countries and Poland joined the EU, their rivers got partially cleaned up. In the far East the Yellow Sea and the South China sea are suffering major pollution. All these regions produce more clouds, and through prevailing winds some end up in the Arctic, where they snow out, except in the Summer when they rain out except on Greenland where it snows 12 months of the year. This leads to increasing winter temperatures of about 5.5 C above the 80th latitude, 2.5 C in spring and fall and a decrease of about 0.5 C in the summer (it takes a long time to melt that extra snow). This affects about 4% of the earth’s surface, so the total temperature increase from over-fertilizing the rivers is 0.04 * 2.5 = 0.1 C. or 0.475 W/m2. No such effect occurs in the Antarctic. To illustrate the current yearly temperature trend in the Arctic, see this current polar temperature chart:
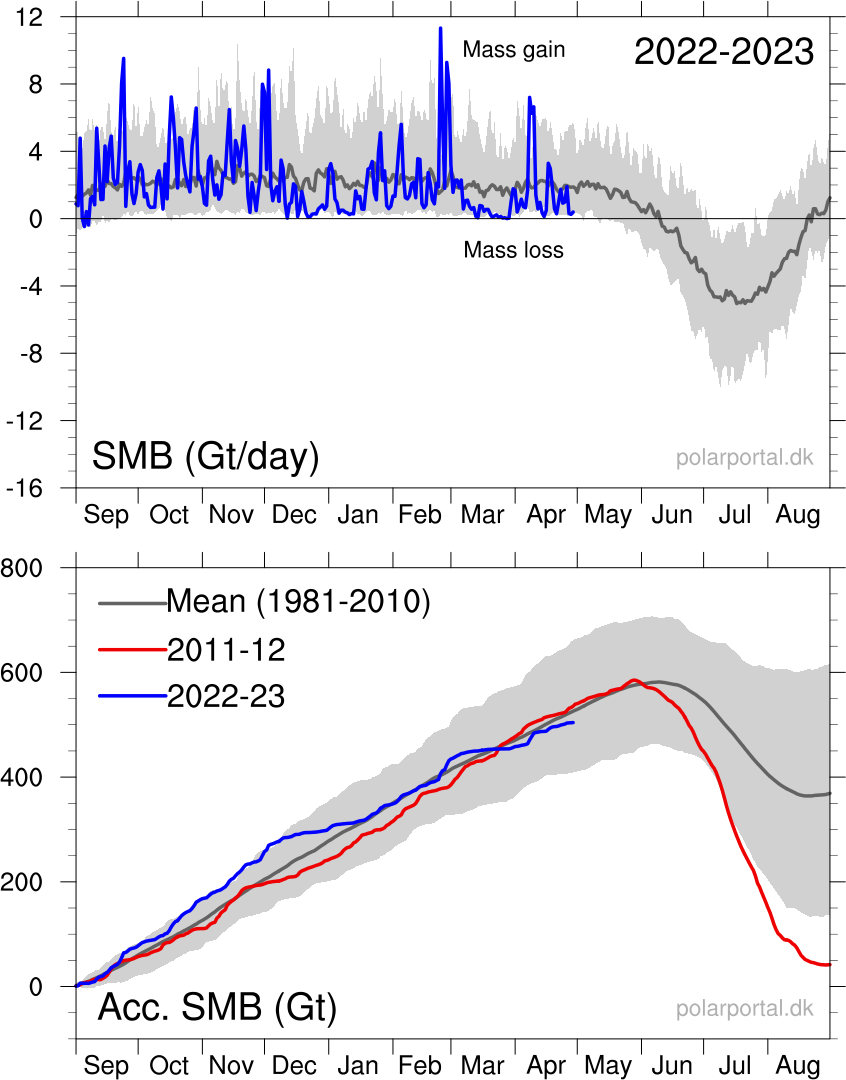
Even more illustrative is the development of ice on Greenland. In 2012 it looked like all of Greenland was going to melt in less than 1000 years, and the polar ice cap would be gone altogether in late summer of 2020. The ice over Greenland is now growing ever so slightly again:
Appendix 8b. The effect of various air pollution.
This is a picture from IPCC AR6

This are three interesting charts, trying to explain warming from anthropogenic greenhouse gasses and other pollutants such as aerosols. It is expressed as W/m2 and a 1W/m2 energy absorption results in. a 0.21C temperature rise. But the most important greenhouse gas of all, water vapor is missing from the calculations. IPCC has from the beginning omitted the influence of water vapor. it affects CO2 calculations the most, since CO2 is fully saturated in the most important range, water vapor also participates, and it is impossible to absorb more than all energy available in any given band. Methane and N2O also must be adjusted for water vapor presence. To compensate for the lack of water vapor calculations they assign a temperature runaway factor to the net result, but it depends how much each greenhouse gas is influenced by water vapors, so the net result will not be right.
The greenhouse effect rise for CO2 between 1750 and 2019 is according to IPCC AR6 is 2.16 W/m2 or 0.45C. From 1980 t0 2022 the corresponding result 1s half that, or 1.08 W/m2 or 0.23C According to my calculations the greenhouse effect from 0.035C or +0.17 W/m2 for the water vapor and 0.04C or +0.19 W/m2 for the CO2. For CH4 the same calculations yield 0.5 W/m2 or 0.105 C from IPCC6, and 0.26 W/m2 or 0.055 C plus 0.22 W/m2 or 0.05C from water vapor. This means the real climate sensitivity for CO2 is only 33% of what is given in IPCC AR6. For CH4 the real climate sensitivity is 20% of what is given in IPCC AR6
The major effect from air pollution is that it generates aerosols that act as condensation points for cloud formation if the air is oversaturated with moisture. In the last 40 years the air has gotten cleaner in the industrial west, not so in China, India and Africa. The net result was a 3.15 % drop in cloud cover and the resulting temperature rise is already accounted for. There are no good worldwide analyses of ancient cloud cover, but air pollution was rising rapidly until the clean air act, enacted in 1963 was beginning to show results in the 70’s. However, ancient method of heating with coal, wood, peat and dried cowdung was far more polluting and harmful to your lungs. If U.S is eliminating all remaining coal plants the CO2 will still be rising since China is planning to build another 1070 coal burning power. The effect of rising non cloud generating aerosols probably caused a temperature decrease of 0.1C or 0.5 W/m2 since 1980. The rapidly increasing air pollution led to the fear of the rapidly coming ice age in the 1970s.
Appendix 8c. The effect of greening of most of the earth.
There is one great benefit of increased CO2, the greening of the earth.

Thanks to this greening, about 15% more leaves and grass since 1982, done with only the fertilizer of CO2, the earth can now keep another 2 billion people from starvation, not to mention what good it does for plants and wildlife.
The greening of the earth will cause a temperature to increase, thanks to the lowering of the albedo of green leaves and grass rather than desert sand. In addition, with rising CO2 levels the leaves need less water to perform the photosynthesis, so the net result from lowering the albedo by 15% of 0.05 over 17% of the world leads to a warming of the earth. The average albedo on land is 30%, and 17% of the earth lowers the albedo by 15% of 0.05 this lowers the total albedo of the earth by 0.13%.
The total reflection of sunlight from the earth is 22.9 W/m2, so 0.13% of that is 0.030 W/m2,, or 0.0063 degree Celsius.
Appendix 8d. The areas that are becoming more like a desert.
Most of the earth displays an increase of leaf area, but there are areas in red that are becoming less green. The areas are: The American Southwest, The Pampas area of South America, a 100 mile band in Southern Sahara, part of East Africa, Madagascar, South East Africa, Western Australia, Part of the Volga region, Kazakhstan east of Lake Aral and various parts of China, and the Mekong river. These areas have this in common, the aquifers ate being depleted, the rivers are diminishing and some of them no longer reach the ocean, lakes are almost disappearing, but people still move to those areas “for the good climate”.
The areas so affected are about 900,000 sq miles of the American Southwest and about 3 million square miles total to suffer from becoming more like a desert. The common theme of all these areas is depletion of the aquifers, rivers diminishing, lakes drying up and soil erosion.
The only part of the world US can control directly is The American Southwest. It can expect more frequent and longer droughts, since there is no amplification of clouds from the relatively cool and clean Pacific ocean, and the long term temperature trend is cooling. The Colorado River no longer feeds the Gulf of California with nourishment. The Colorado river used to all the water allocation for all the participating states, but around 2000 the water use had caught up with supply, and since then it has become much worse with demand far outstripping supply.

In addition the Great Salt Lake is now less than a third of the size it was in the 1970’s. A second level water shortage has been issued and for example Arizona will get a million Acre-feet lass per year from the river. The aquifers will be further depleted leading to less rainfall and the few remaining springs will dry out. If nothing is done, the American southwest will become desertified.
Ironically, deserts have a higher albedo than green soil, so letting the American Southwest become a desert would have a cooling effect by the increasing albedo, but the effect from the disappearing clouds would have a far greater heating effect, so letting the American Southwest become a desert is not a solution to the problem.
However, the area subject to desertification is about 0.6% of the world’s land area and rising the albedo by 0.05 leads to a cooling down. The average albedo of the earth is 30%, and before desertification the albedo was 25%, this rises the albedo of the earth by 0.03%. The total reflection of sunlight from the earth is 22.9 W/m2, so 0.03% of that is 0.007 W/m2, or a cool down of 0.00015 degree Celsius.
