In a previous blog (see here) I investigated the importance of greenhouse gasses and their influence from 1980 to 2022, a time period from which we have good satellite data, and found that the two greenhouse gases mentioned most, CO2 and methane together contributed to less than 20% of the total temperature increase of 0.5 degree Celsius. The greenhouse gases total contributed 0.4544C or 2.164 W/m2, or well within the margin of error. However there are many more interesting causes for climate change other tnas greenhouse gases, as they occurred in the last 42 years.
My quest is by no means complete, and there are known events yet to happen that are not included, but here are the component:
1. The sun is getting warmer and will explode, but before that there will be a thermal runaway on earth.
Believe it or not, this is how Dr. James Lovelock started trying out to find when the earth’s self regulating ability would come to an end. This eventually lead to the GAIA hypothesis. It turns out that the sun gets brighter at a rate of just over 1% every 100 million years—Earth would suffer this “runaway greenhouse” in 600 million to 700 million years. In the past 42 years the warming trend would amount to a temperature increase of 0.0000003C or 0.0000014 W/m2
2. The sun has 11 year sunspot cycles with varying activity
The sun reverses its magnetic field every 11 years or so. and the sunspot intensity varies with time. 1980 was a year with maximum solar activity and 2022 was a year with less than 1/3 of the 1980 sunspot activity. The energy output from the sun at maximum sunspot activity is 1360 W/m2, but the sun only shines on half the earth at any time, and at less than 90 angles, so the net energy is 340 W/m2. The difference between solar maximum and solar minimum is about 0.07%, so the net energy decrease from the sun in 2022 from 1980 is 340 * 0.07% * 1/3 = 0.08W/m2, or 0.02C

3. The effect of the Milankovitch cycles.
We are near the end of the interglacial period, and from now on we will slowly enter a new ice age at a rate of – 1C per 2000 years.This means we were cooling down another 0.021C or 0.1 W/m2 from 1980 to 2022

4. The effect from decreasing cloud cover.
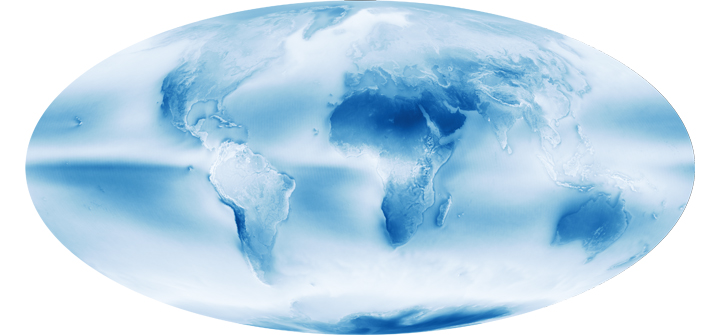
This is a world map showing the average cloud cover in August 2009. It shows the cloud free areas of the earth in blue. Another way to look at it is to see how much total water vapor there is in the atmosphere:
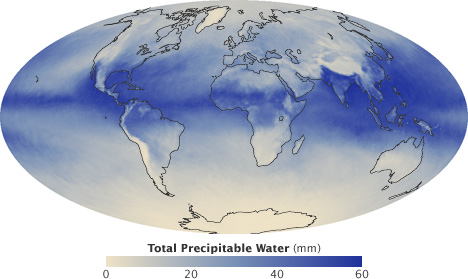
Nowhere on earth can it rain out more than two inches without more humidity being transported in from another place. Over the ocean humidity gets replenished by evaporation, over land only areas that has vegetation or swamps or lakes will replenish humidity by evaporation. Keep these charts in mind for later. For now concentrate on the decreasing average cloud cover. It has only been measured for the last 40 years, but here are the results:
There are many different clouds, low, mid-level and high clouds, and they have changed differently over the same time span:

Of these clouds, the low level clouds are reflecting the most, so the 2.4% loss in average cloud cover is an assumption on the low side on the loss of reflection.
In 1984 the average cloud cover was 63.7%, in 2019, 35 years later it was 61.1%, a loss of 2.6%. over 35 years or 0.075% /year. This amounts to a loss of 3.1% from 1980 until 2022now until 2050 The total reflection from clouds and atmospheric scattering is 77 W/m2, of which 60 is from cloud reflection. A 3.1% loss of area of reflection leads to a decreasing of incoming energy of 60 * 0.031 = 1.8 W/m2 or 0.38 degree Celsius increase
Since clouds diminished, reflection and radiation from the earths surface increased by the 3.1%, which comes to 31% of 10% o f the earth’s radiation of 340 W/m2 = 1.05 W2 or 0.22 C decrease.
Total effect of clouds diminishing between 1980 and 2022 is a temperature increase of 0.16C or 0.75 W/m2.
There is a caveat to this calculations. It has so far taken only into account cloud averages, but it matters greatly if clouds appear at day or night, what time of day and what time of the year. Here is a picture from the equatorial Pacific:

The day starts out with no clouds, about 8:30 A.M. clouds start to appear, and the temperature drops while the sun is still rising. This means clouds have a negative feedback effect minimizing the temperature effect from the sun-cloud cycle. Much more could be said about that, but as an assumption the changing cloud effect reduced the temperature rise from diminishing clouds. My estimate is that the diminishing cloud effect was only two thirds of what would be expected without the negative feedback, or from 1980 to 2022 of a temperature increase of 0.11C or 0.50 W/m2.
5. The effects from air and water pollution not related to cloud formation. a. The warming of the Northern Arctic region.
North America has great rivers, none greater than the mighty Mississippi. It used to be a meandering river with frequent floods that resulted in depositing its silt over large areas and thus fertilizing the land. The American Indians living by the river moved to its new location after the water receded, and they could use the newly fertilized land. After the Louisiana purchase river traffic grew rapidly, but shifting sandbars and the excessively winding river became a problem, so the Mississippi river was converted to be the main transportation artery of the middle USA, the river banks were reinforced and the course of the river straightened. This meant that more of the silt was transported out into the Mexican Gulf, some of the silt that used to fertilize the soil instead fertilized the Mexican gulf. In addition, the Mississippi river used to be very polluted, but is now clean enough that it can be used for drinking water after treatment all the way down to Louisiana. There remains elevated concentration of nitrogen compounds so the Mexican Gulf suffers from excessive algae blooms and even red tide from time to time. This leads to more cloud formation and more rain in the United States east of the 98th meridian. This also occurs in Northern Europe, especially in the North Sea; the rivers flowing into the North Sea are rich in nutrients. The Baltic Sea was near oxygen death, but after the Baltic countries and Poland joined the EU, their rivers got partially cleaned up. In the far East the Yellow Sea and the South China sea are suffering major pollution. All these regions produce more clouds, and through prevailing winds some end up in the Arctic, where they snow out, except in the Summer when they rain out except on Greenland where it snows 12 months of the year. This leads to increasing winter temperatures of about 5.5 C above the 80th latitude, 2.5 C in spring and fall and a decrease of about 0.5 C in the summer (it takes a long time to melt that extra snow). This affects about 4% of the earth’s surface, so the total temperature increase from over-fertilizing the rivers is 0.04 * 2.5 = 0.1 C. No such effect occurs in the Antarctic. At the South Pole in the winter the air is clean, there is almost no water vapor and the winter temperature at the Amundsen–Scott South Pole Station between April and September 2021, a frigid minus-78 degrees (minus-61 Celsius), was the coldest on record, dating back to 1957, and the trend is 1 C colder per century. In the summer the trend is increasing temperatures.To illustrate the current yearly temperature trend in the Arctic, see this current polar temperature chart:

Even more illustrative is the development of ice on Greenland. In 2012 it looked like all of Greenland was going to melt in less than 1000 years, and the polar ice cap would be gone altogether in late summer of 2020. The ice over Greenland is now growing ever so slightly again:

b. The effect of various air pollution.
Yes, there is rising air pollution in the world. Some result in clouds, some don’t. Here is the cloud over China:

Heavy smog has shrouded much of eastern China, and air quality levels have been dropped to extremely dangerous levels. The heavy smog is caused by industrial pollution, coal and agricultural burning, and has been trapped by the mountains to the west and wind patterns. The thick haze of smog is clearly visible as the murky gray color in this true color satellite image. NASA/NOAA
The major effect from air pollution is that it generates aerosols that act as condensation points for cloud formation if the air is oversaturated with moisture. In the last 42 years the air has gotten cleaner in the industrial west, not so in China, South Asia and Africa. The net result was a 3.1 % drop in cloud cover and the resulting temperature rise is already accounted for. There are no good worldwide analyses of ancient cloud cover, but air pollution was rising rapidly until the clean air act, enacted in 1963 was beginning to show results in the 70’s. However, ancient method of heating with coal, wood, peat and dried cowdung was far more polluting and harmful to your lungs. If U.S is eliminating all remaining coal plants the CO2 will still be rising since China is planning to build another 1070 coal burning power plants by 2030. The cloud of aerosol pollution from Pakistan to Korea did cause a temperature decrease of 0.4 W/m2 or 0.1 C.
c. The effect of greening of most of the earth.
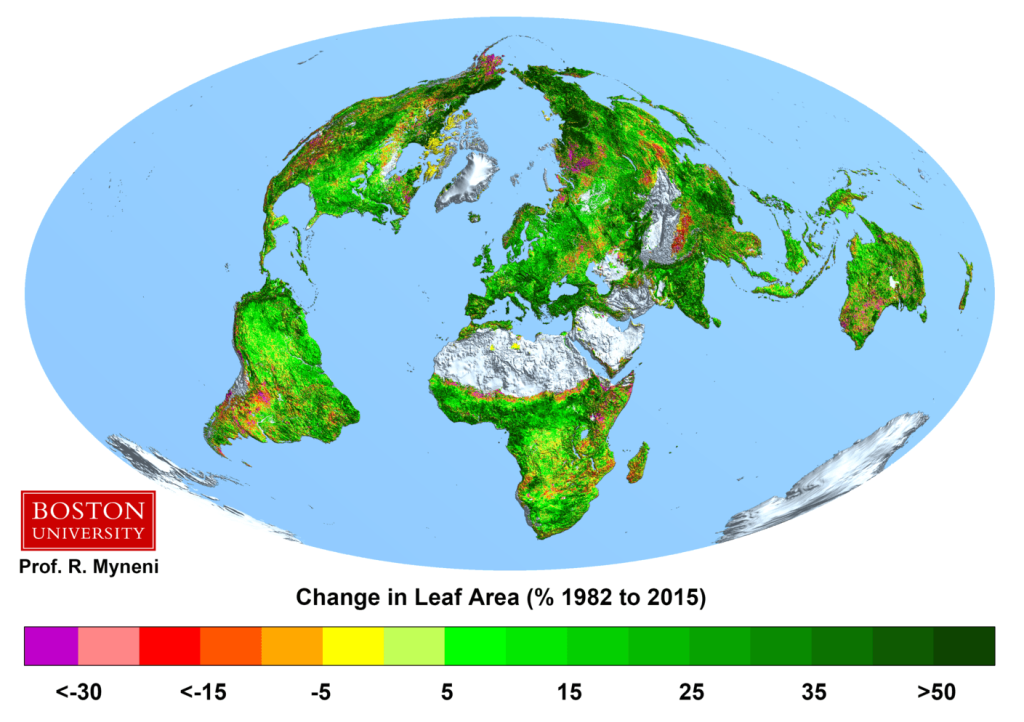
There is one great benefit of increased CO2, the greening of the earth.

Thanks to this greening, about 15% more leaves and grass since 1982, done with only the fertilizer of CO2, the earth can now keep another 2 billion people from starvation, not to mention what good it does for plants and wildlife.
The greening of the earth will cause a temperature to increase, thanks to the lowering of the albedo of green leaves and grass rather than desert sand. In addition, with rising CO2 levels the leaves need less water to perform the photosynthesis, so the net result from lowering the albedo by 15% of 0.05 over 17% of the world leads to a warming of the earth. The average albedo on land is 30%, and 17% of the earth lowers the albedo by 15% of 0.05 this lowers the total albedo of the earth by 0.13%.
The total reflection of sunlight from the earth is 22.9 W/m2, so a lowering of the albedo of that of 0.13% leads to a temperature increase of 0.030 W/m2, or 0.0063 degree Celsius.
d. The areas that are becoming more like a desert.
Most of the earth displays an increase of leaf area, but there are areas in red that are becoming less green. The areas are: The American Southwest, The Pampas area of South America, a 100 mile band in Southern Sahara, part of East Africa, Madagascar, South East Africa, Western Australia, Part of the Volga region, Kazakhstan east of Lake Aral and various parts of China, and the Mekong river. These areas have this in common, the aquifers ate being depleted, the rivers are diminishing and some of them no longer reach the ocean, lakes are almost disappearing, but people still move to those areas “for the good climate”.
The areas so affected are about 900,000 sq miles of the American Southwest and about 3 million square miles total to suffer from becoming more like a desert. The common theme of all these areas is depletion of the aquifers, rivers diminishing, lakes drying up and soil erosion.
The only part of the world US can control directly is The American Southwest. It can expect more frequent and longer droughts, since there is no amplification of clouds from the relatively cool and clean Pacific ocean, and the long term temperature trend is cooling. The Colorado River no longer feeds the Gulf of California with nourishment. The Colorado river used to all the water allocation for all the participating states, but around 2000 the water use had caught up with supply, and since then it has become much worse with demand far outstripping supply.

In addition the Great Salt Lake is now less than a third of the size it was in the 1970’s. A second level water shortage has been issued and for example Arizona will get a million Acre-feet lass per year from the river. The aquifers will be further depleted leading to less rainfall and the few remaining springs will dry out. If nothing is done, the American southwest will become desertified.
Ironically, deserts have a higher albedo than green soil, so letting the American Southwest become a desert would have a cooling effect by the increasing albedo, but the effect from the disappearing clouds would have a far greater heating effect, so letting the American Southwest become a desert is not a solution to the problem.
However, the area subject to desertification is about 0.6% of the world’s land area and rising the albedo by 0.05 leads to a cooling down. The average albedo of the earth is 30%, and before desertification the albedo was 25%, this rises the albedo of the earth by 0.03%. The total reflection of sunlight from the earth is 22.9 W/m2, so 0.03% of that is 0.007 W/m2, 0.0015 degree Celsius.
Summary of all non-greenhouse effect causes for climate change from 1980 to 2022:
Long term warming of the sun: 0.0000005C
Temperature decrease from the Milankovitch cycle: – 0.021 C or 0.1 W/m2
Temperature decrease from changing solar spot activity – 0.021 C or 0.1 W/m2
Temperature rise from decreasing cloud cover of 0.10 C or 0.48 W/m2.
Change from temperature rise of the Arctic 0.1 C or 0.48 W/m2
Pollution aerosols cause a temperature decrease of – 0.1 C or 0.48 W/m2
Temperature increase from greening of the earth 0.0063C or 0.030 W/m2
Temperature decrease from areas of desertification – 0.0015C or 0.007 W/m2.
TOTAL TEMPERATURE RISE FROM OTHER THAN GREENHOUSE GASES FROM 1980 to 2022: 0.0628 C or 0.363 W/m2
What will be the temperature in 2050 if all pledges by the Paris accord were fulfilled?
The sum of all Paris accord pledges means a 15% reduction in the RISE of C02 between now and 2030, leading to a reduction in temperature rise from rising CO2 of 0.006 C. The aspitational goal of reducing the signing countries.portion of anthropological Methane output by 50% will reduce the rise from methane by 0.0003 C In addition it will reduce the amount of temperature rise from the greening of the world by 0.0009 C. the total temperature rise will be 0.0072 C less by 2030 than if no action is taken.

