The ice keeps growing and growing: The freezing point of ice is a constant, so it must be getting colder. Are we looking at the beginning of a new “little ice age”?
Here are the amounts of sea-ice for 2014, 2013 and 2012 in millions of square kilometers.
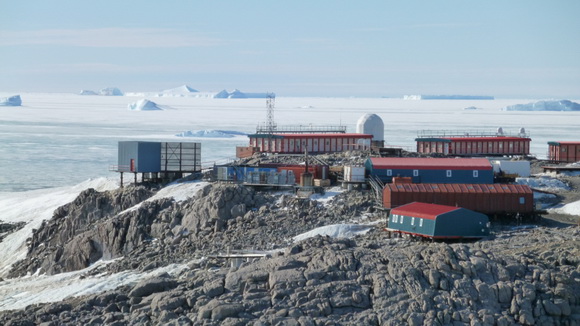
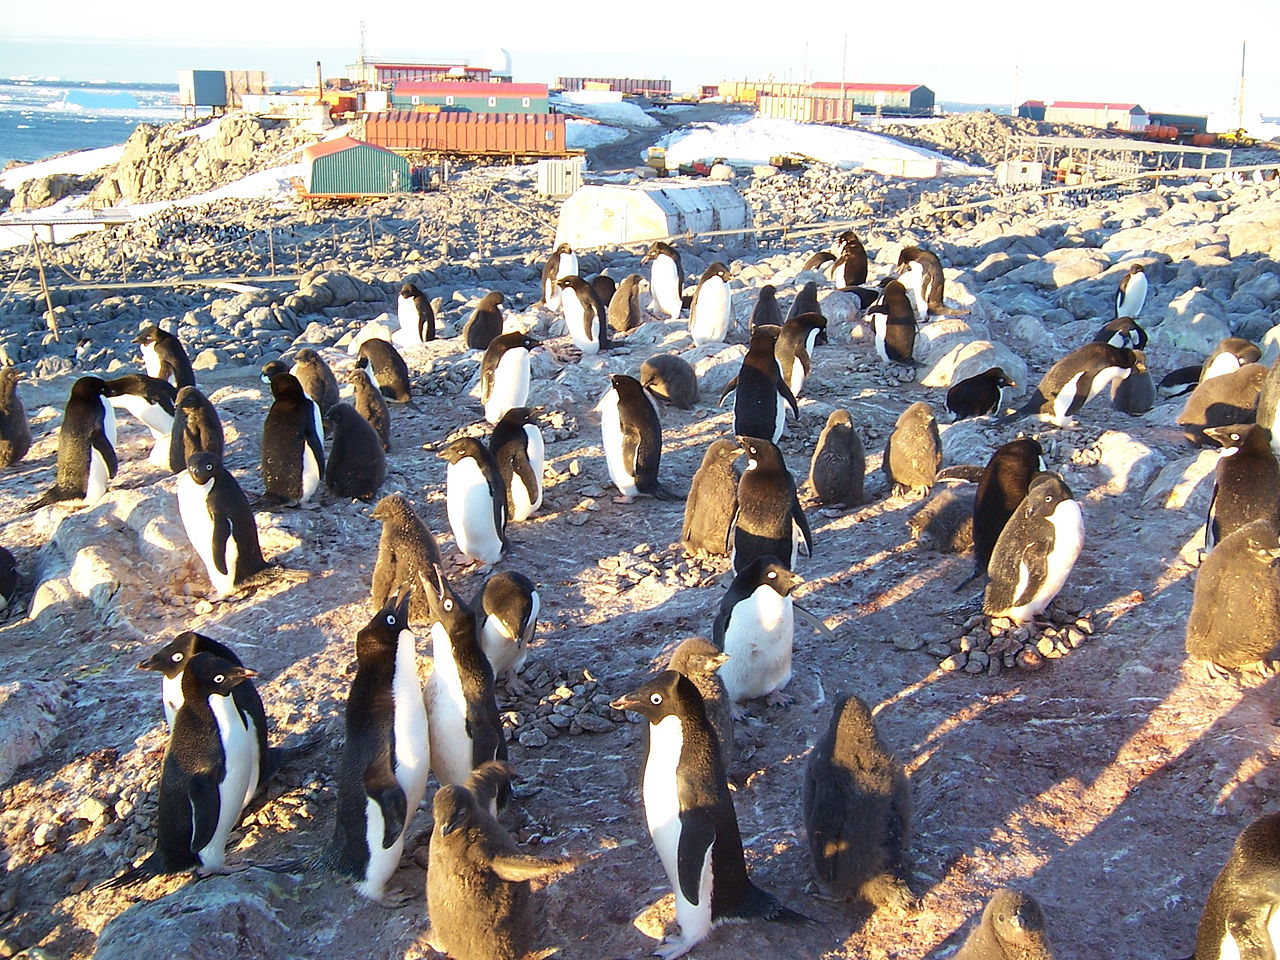
The French Antarctic Dumont d’Urville Station, on the Antarctic coast due South of Melbourne, Australia, made famous by the award-winning documentary, “The March of the Penguins” has experienced its coldest June ever.
According to a press release from Meteo France, during June this year the average temperature was -22.4c (-8.3F), 6.6c (11.9F) lower than normal. This is the coldest June ever recorded at the station, and almost the coldest monthly average ever – only September 1953 was colder, with a recorded average temperature of -23.5c (-10.3F).
June this year also broke the June daily minimum temperature record, with a new record low of -34.9c (-30.8F).
Other unusual features of the June temperature record are an unusual excess of sunlight hours (11.8 hours rather than the normal 7.4 hours), and unusually light wind conditions. This also lead to a new record for ice anomaly, the ice extent was nearly the size of Greenland larger than normal.
Eleven signs of cooling. A new little Ice Age coming? (Updated 6/6/2015)
Sometimes regional newspapers in faraway countries can produce articles that are newsworthy all over the world. Such is the case with the major Danish newspaper “Jyllandsposten” which acquired worldwide fame for publishing the “Muhammad Cartoons.” There had been a Muslim honor killing, and the case was publicized incessantly by the paper. The public was outraged, and when the case went to court the Danish court, known for Scandinavian leniency broke with tradition and gave all six defendants hard sentences, including the taxi driver, who just drove the getaway car. This outraged the Muslim community, so they threatened the reporters with reprisals. The editorial board decided they would not be intimidated, so they decided to run a competition “Who could make the best Muhammad cartoon”. So far more than 200 people has been killed because of the cartoons from adherents to “the religion of peace”
Aug 8 2013 Jyllandsposten posted a two page article “The behavior of the sun can trigger a new “Little Ice age”.
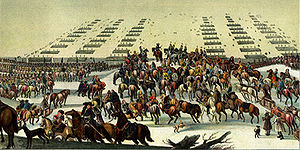
They should know. During the last little ice age the Swedes, with their whole army went over of the Great Belt on ice and sacked Copenhagen. The year was 1648.
Nowadays the Great Belt is rarely even frozen over.
Jyllandspostens argument is that we are headed for a new solar minimum of either the Daulton or the Marauder minimum, both leading to significantly colder winters, more storms, and diminished harvests. Above is their front page:
The Paper Warns: “Globe May Be On Path To Little Ice Age…Much Colder Winters…Dramatic Consequences”!
Could they possibly be right? Some say that global warming “deniers” are the scum of the earth worthy of extinction. Obama suggests we belong to the “flat earth society.” In Jyllandspostens view that is beside the point. They were not cowed by the Muhammad cartoons, neither will they be silenced on exposing the fallacies of the religion of global warming.
Since the main street media never report on these facts I have put together 11 reasons why I believe we are entering a new ice age.
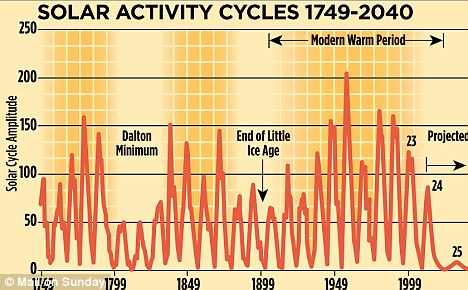
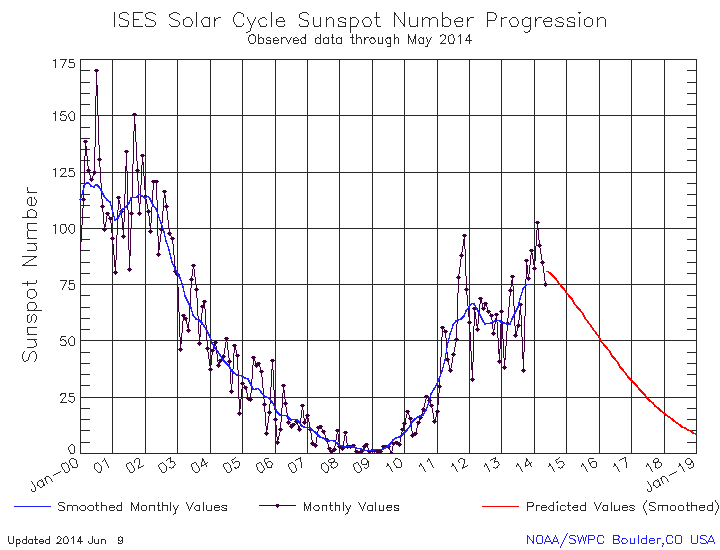
#1. It all depends on the sun. The sunspots and its accompanied solar activity goes in cycles. When there are lots of sunspots the sun is more active than when there are few. We are now at a solar maximum and this is the lowest maximum in over a hundred years and less than half of the most recent solar cycles. The next solar cycle is projected to be almost nonexistent. The last time this happened was during the little ice age.
It is to be noted that the actual behavior of the sun is even quieter than predicted. This means colder winters for the next 33+ years.
#2. A new record time for no major hurricanes hitting the U.S. mainland is set every day.
Hurricane Wilma, the last major hurricane to strike the United States, made landfall on Oct. 24, 2005.
#3. The number of tornadoes are still way below average in spite of early May 2015 activity.
#4. The arctic temperature over 80 degree latitude was below average every day since from May through August in 2013. This was unprecedented since measurements started. This pattern is repeated in 2014.
{Source Danish Meteorological Institute)
2014 the pattern continues with warmer winter temperatures due to more snowfall than normal and colder summer temperatures due to the extra melting of last years snow.
And again in 2015 the switch from a 5F warmer winter to a cooler spring summer happened early May.
#5 Arctic ice content for 2013 was at a 6 year high. Ice is a lagging indicator. If the ice is increasing, temperature has been decreasing for some time. This year will have a higher minimum since there is much more multi-year ice northwest of Greenland.
#6. Arctic melt is larger than the 30 year average, but that is due to soot from China, not higher temperatures.
China consumes more than 45% of all the coal burned in the world every year. It is mostly low grade lignite. Even with scrubbers, which are often down for “service” (it costs money to operate scrubbers) there is substantial soot pollution. This soot cloud hangs in the air, and some of it makes its way up to the arctic, carried on by the prevailing westerly winds. Note the soot in the bottom of the ice-lake in figure at right.
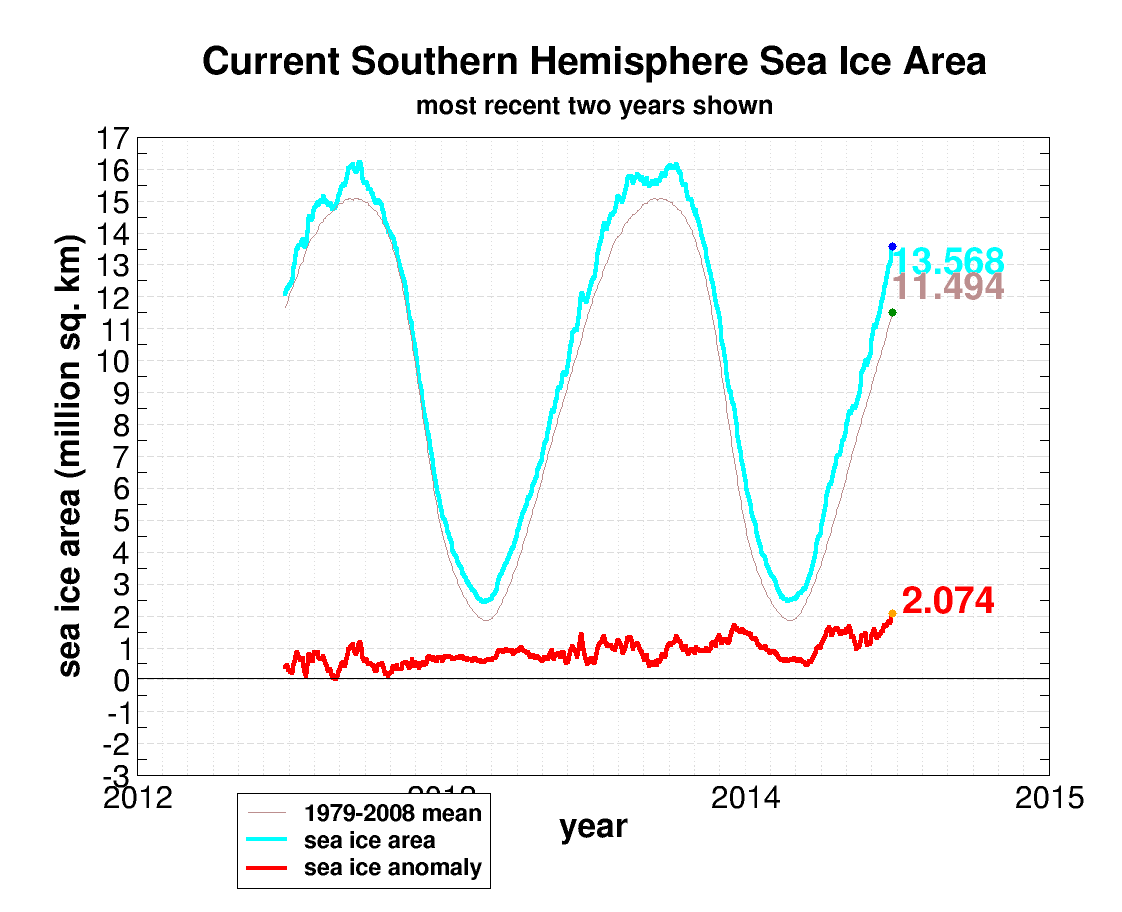
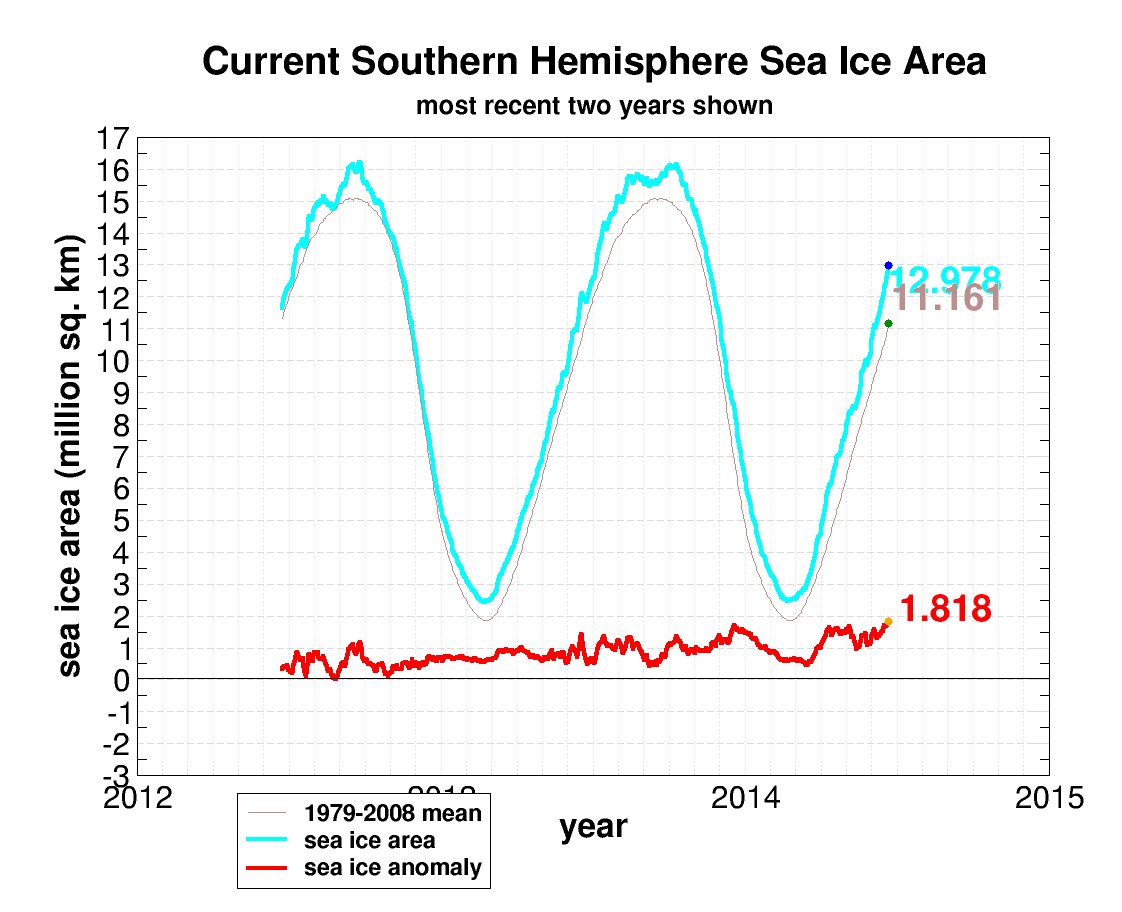
#7. Last two years the Antarctic ice cover hit consecutive record highs since measurements started.
#8. Antarctic ice is running well above average, setting another record in 2013, and is on its way for another record in 2014. The picture above shows we are setting a new all time record for ice anomaly with more than 2 million square kilometer ice than normal for this time of the year. This ice is around the 60th latitude which means the change in albedo from ocean to ice is highly cooling leading to even more ice growth.
The picture below shows an accelerating trend to greater ice anomaly.
#9. The continental U.S. temperature records are misleading. Many weather stations are located near airport runways. This is a proper location to give runway information to the pilots but is not well suited for climatological reporting since they report the airport runway microclimate, not true overall conditions. This tends to skew temperature data. If airport data is taken out of the reporting, temperatures now are well below the records set mostly in the early 1900’s. A snapshot from the last week of July:
Even with the suspect temperature measurements there has been no significant global temperature increase the last 18 years 6 months:
#10. Northern Hemisphere snow cover is increasing.
#11. Sandy. Contrary to popular reporting of the unprecedented storm surge during hurricane Sandy there has been two hurricanes with higher storm surges. They both occurred in the 1600’s, during the little ice age and can be explained by a late hurricane coming up the East coast being drawn inland by an early outbreak of cold arctic air.
The jury is out. Who are the scum of the earth, members of the “flat earth society?” Who looks at the facts and who is ideologically motivated.
On a brighter note, it may be time to return to good, old-fashioned romance
And one thing more. Increasing CO2 levels will delay the onset of the next ice age. In the meantime we can enjoy the fruits of increased CO2 levels: Greater harvests, a greener earth, less temperature differences between the equator and the poles, less hurricanes, fewer tornadoes, less large storms, and a more resilient nature feeding more animals and enabling more biodiversity. The colder weather will finally catch up with us, and that will mean widespread famine unless CO2 is increased substantially.
Why am I not worried about the greenhouse effect from CO2?
If CO2 is doubled, global temperatures will increase less than 2 degree F if no gain is in the system. Water vapor increases with about 4% per degree F temperature rise, and so a gain is assumed. The models predict a hotspot in the troposphere over the tropics because of CO2 coupled with water vapor. No hotspot has been found. In fact there is a barely perceptible cold spot where the hotspot was expected. This is because of the great thermostat of the earth called thunderstorms. When the air is hot and humid enough thunderstorms form and this mechanism controls tropical temperatures to be rarely above 95 degrees F. In desert regions it can be substantially hotter, like in northern India, where it is routinely 115 degree F until the monsoons start, when the thunderstorms keep temperatures below 100.
No such control mechanism exists on the cool side. It will get as cold as the solar output dictates, and the coming cooling is inevitable. It will delay the onset of the new little ice age by maybe a few years.
I am an engineer and look at the earth as an organism that responds to impulses. The Sun gives two types of impulses: day and night, and summer and winter. We can take a look at the seasonal response in temperatures and notice the difference between now and when we had 14% less CO2 in the atmosphere. Fairly simple calculations will yield a 0.4 degree F rise for doubling CO2 levels over water, and about 1.2 degree F rise over land. The land increase has much higher variability between coastal and inland climate, but that is a ballpark number. This is not enough to offset the influence from a less active sun. The imbalances manifests itself in shrinking and growing ice and snowcaps. The trend is for increasing ice and snow, which means we are already well into the cooling phase.
To continue to thrive in an ever cooling climate we will have to find additional energy sources. There simply is not enough coal, oil and gas to sustain us in a quality of living to which we are accustomed, unless we expand the base for energy production. The only viable source of energy left would be expansion of nuclear energy. U235 and Plutonium based energy production have serious drawbacks with nuclear waste lasting for millenia.
May I suggest Thorium based Nuclear power. Here are 22 reasons to switch to Thorium based energy production:
The cause of Climate Change is still up in the air.
Sherlock Holmes: “It is a capital mistake to theorize before one has data. Insensibly one begins to twist facts to suit theories instead of theories to suit facts”. From: “Scandal in Bohemia” by Arthur Conan Doyle.
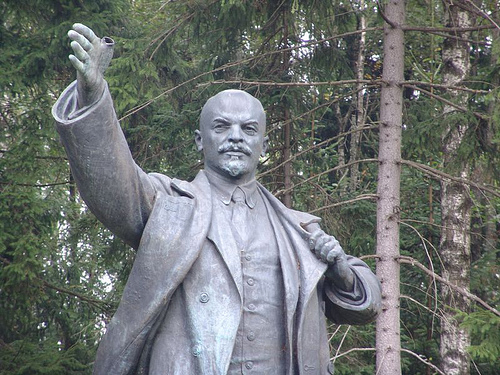
The very first Earth Day was celebrated April 22 1970, on the 100 year anniversary of the birth of Vladimir Lenin (Владимир Ильич Ленин). True green environmentalists keep telling me it is just a coincidence. I think not.
.
.
.
.
The first Earth Day in Philadelphia 1970 featured Ira Einhorn (The Unicorn Killer) as master of Ceremonies. The big environmental scare of the day was the threat of a new Ice Age. The clarion call was: “In the year 2000 temperatures will have fallen 10 degrees”, the culprit was pollution, especially acid rain. The acid rain was so bad in the Adirondacks, Canada, Norway and Sweden that the Rainbow Trout died in droves, and even the oceans were in danger of getting too acid. Regulations were enacted to add Sulfur scrubbers to power stations, waste water was purified, and – wouldn’t you know it, the cooling trend reversed itself and was followed by warming. Since the cooling trend was “obviously man-made” they had to find a similar reason for the sudden warming.
Never mind that around the year 1200 there was at least one farm on South West Greenland that exported, among other things, cheese. How do we know that? They have excavated the ruins of a farm, “Gården under Sanden”, buried under permafrost for five centuries. During these five centuries the Northern Hemisphere experienced what is called “the little ice age” a time when the winters could be so cold that in 1658 the Swedish army, cavalry and artillery crossed the Belts in the southwestern Baltic over ice and sacked Copenhagen.
Picture left: Gården under sanden excavation.
Picture right: The crossing of the Great Belt 1658.
To predict future climate changes many computer models have been developed dealing with how the earth responds to changes in atmospheric conditions, especially how it responds to changes in CO2 levels. Most were developed in the 1970 to 2000 time frame, a time of rapid temperature rise and as such they were all given a large factor for the influence of rising CO2. Since 1998 we have had a cooling trend, so the models cooperate less and less and are given more and more unreliable predictions. It is no wonder then that they all have failed to model the past. None of them have reproduced the medieval warm period or the little ice age. If they cannot agree with the past there is no reason to believe they have any ability to predict the future. The models are particularly bad when it comes to predict cloud cover and what time of day clouds appear and disappear. Below is a chart of a number of climate models and their prediction of cloud cover versus observed data. Note especially to the right where they completely fail to notice the clear skies over Antarctica.
Is there a better way to predict future temperature trends? When you go to the doctor for a physical, at some point and without warning he hits you under the knee with a hammer and watches your reaction. He is observing your impulse response. Can we observe impulse responses for the earth? One obvious case is volcanic eruptions. Sometimes the earth burps a lot of carbon dioxide or methane. But the most interesting response would be how the earth responds to a solar flare with a sudden change in the amount of cosmic radiation hitting the earth. That would give the best indication how the sun and cosmic radiation affects cloud formation. A couple of solar flares lately have been giving us a hint how the cloud cover responds to changes in cosmic radiation, and they are consistent with the latest results from the CLOUD project conducted using the CERN particle accelerator, a confirmation of a theory forwarded by the Danish Physicist Henrik Svensmark. He first presented the theory in 1997 and finally got the results verified and published in 2007, but the prevailing consensus has been slow to accept the theory that the sun as the primary driver of climate change.
We have many reasons to be concerned about the well-being of the earth, but rising levels of CO2 is not one of them. In fact, CO2 is our friend. Rising CO2 levels increases crop yields, makes the impact of land use changes less pronounced and the photosynthesis process more efficient, using less water and allowing us to grow crops on land once deemed unprofitable.
Picture right: The CERN Cloud apparatus in 2009.
James Hansen, a world famous climate science activist/NASA physicist writes in one of his publications, called “Earth’s Energy Imbalance and Implications“. It contains a quote that ties nicely in with Sherlock Holmes observation: The precision achieved by the most advanced generation of radiation budget satellites is indicated by the planetary energy imbalance measured by the ongoing CERES (Clouds and the Earth’s Radiant Energy System) instrument (Loeb et al., 2009), which finds a measured 5-year-mean imbalance of 6.5 W/m2 (Loeb et al., 2009). Because this result is implausible, instrumentation calibration factors were introduced to reduce the imbalance to the imbalance suggested by climate models, 0.85 W/m2 (Loeb et al., 2009). (Picture shows James Hansen arrested outside White House fence during one of his demonstrations.)
There we have it. The observed data does not fit the climate models. Change the observed data! Then use that data to validate the climate models! How convEEnient, as the SNL Churchlady used to say. Shenanigans like this have been exposed in what has been named “Climategate1.0”, followed by “Climategate2.0” This is what happens when politicians take over science and make further funding contingent on obtaining desired results.
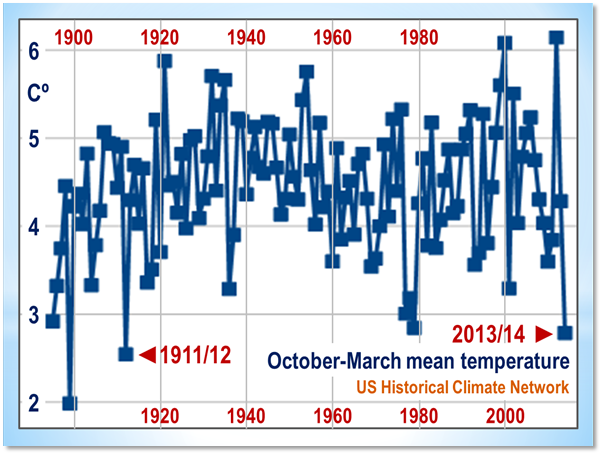
The coldest winter half-year in over a century!! It’s climate change all right. More CO2, please!!
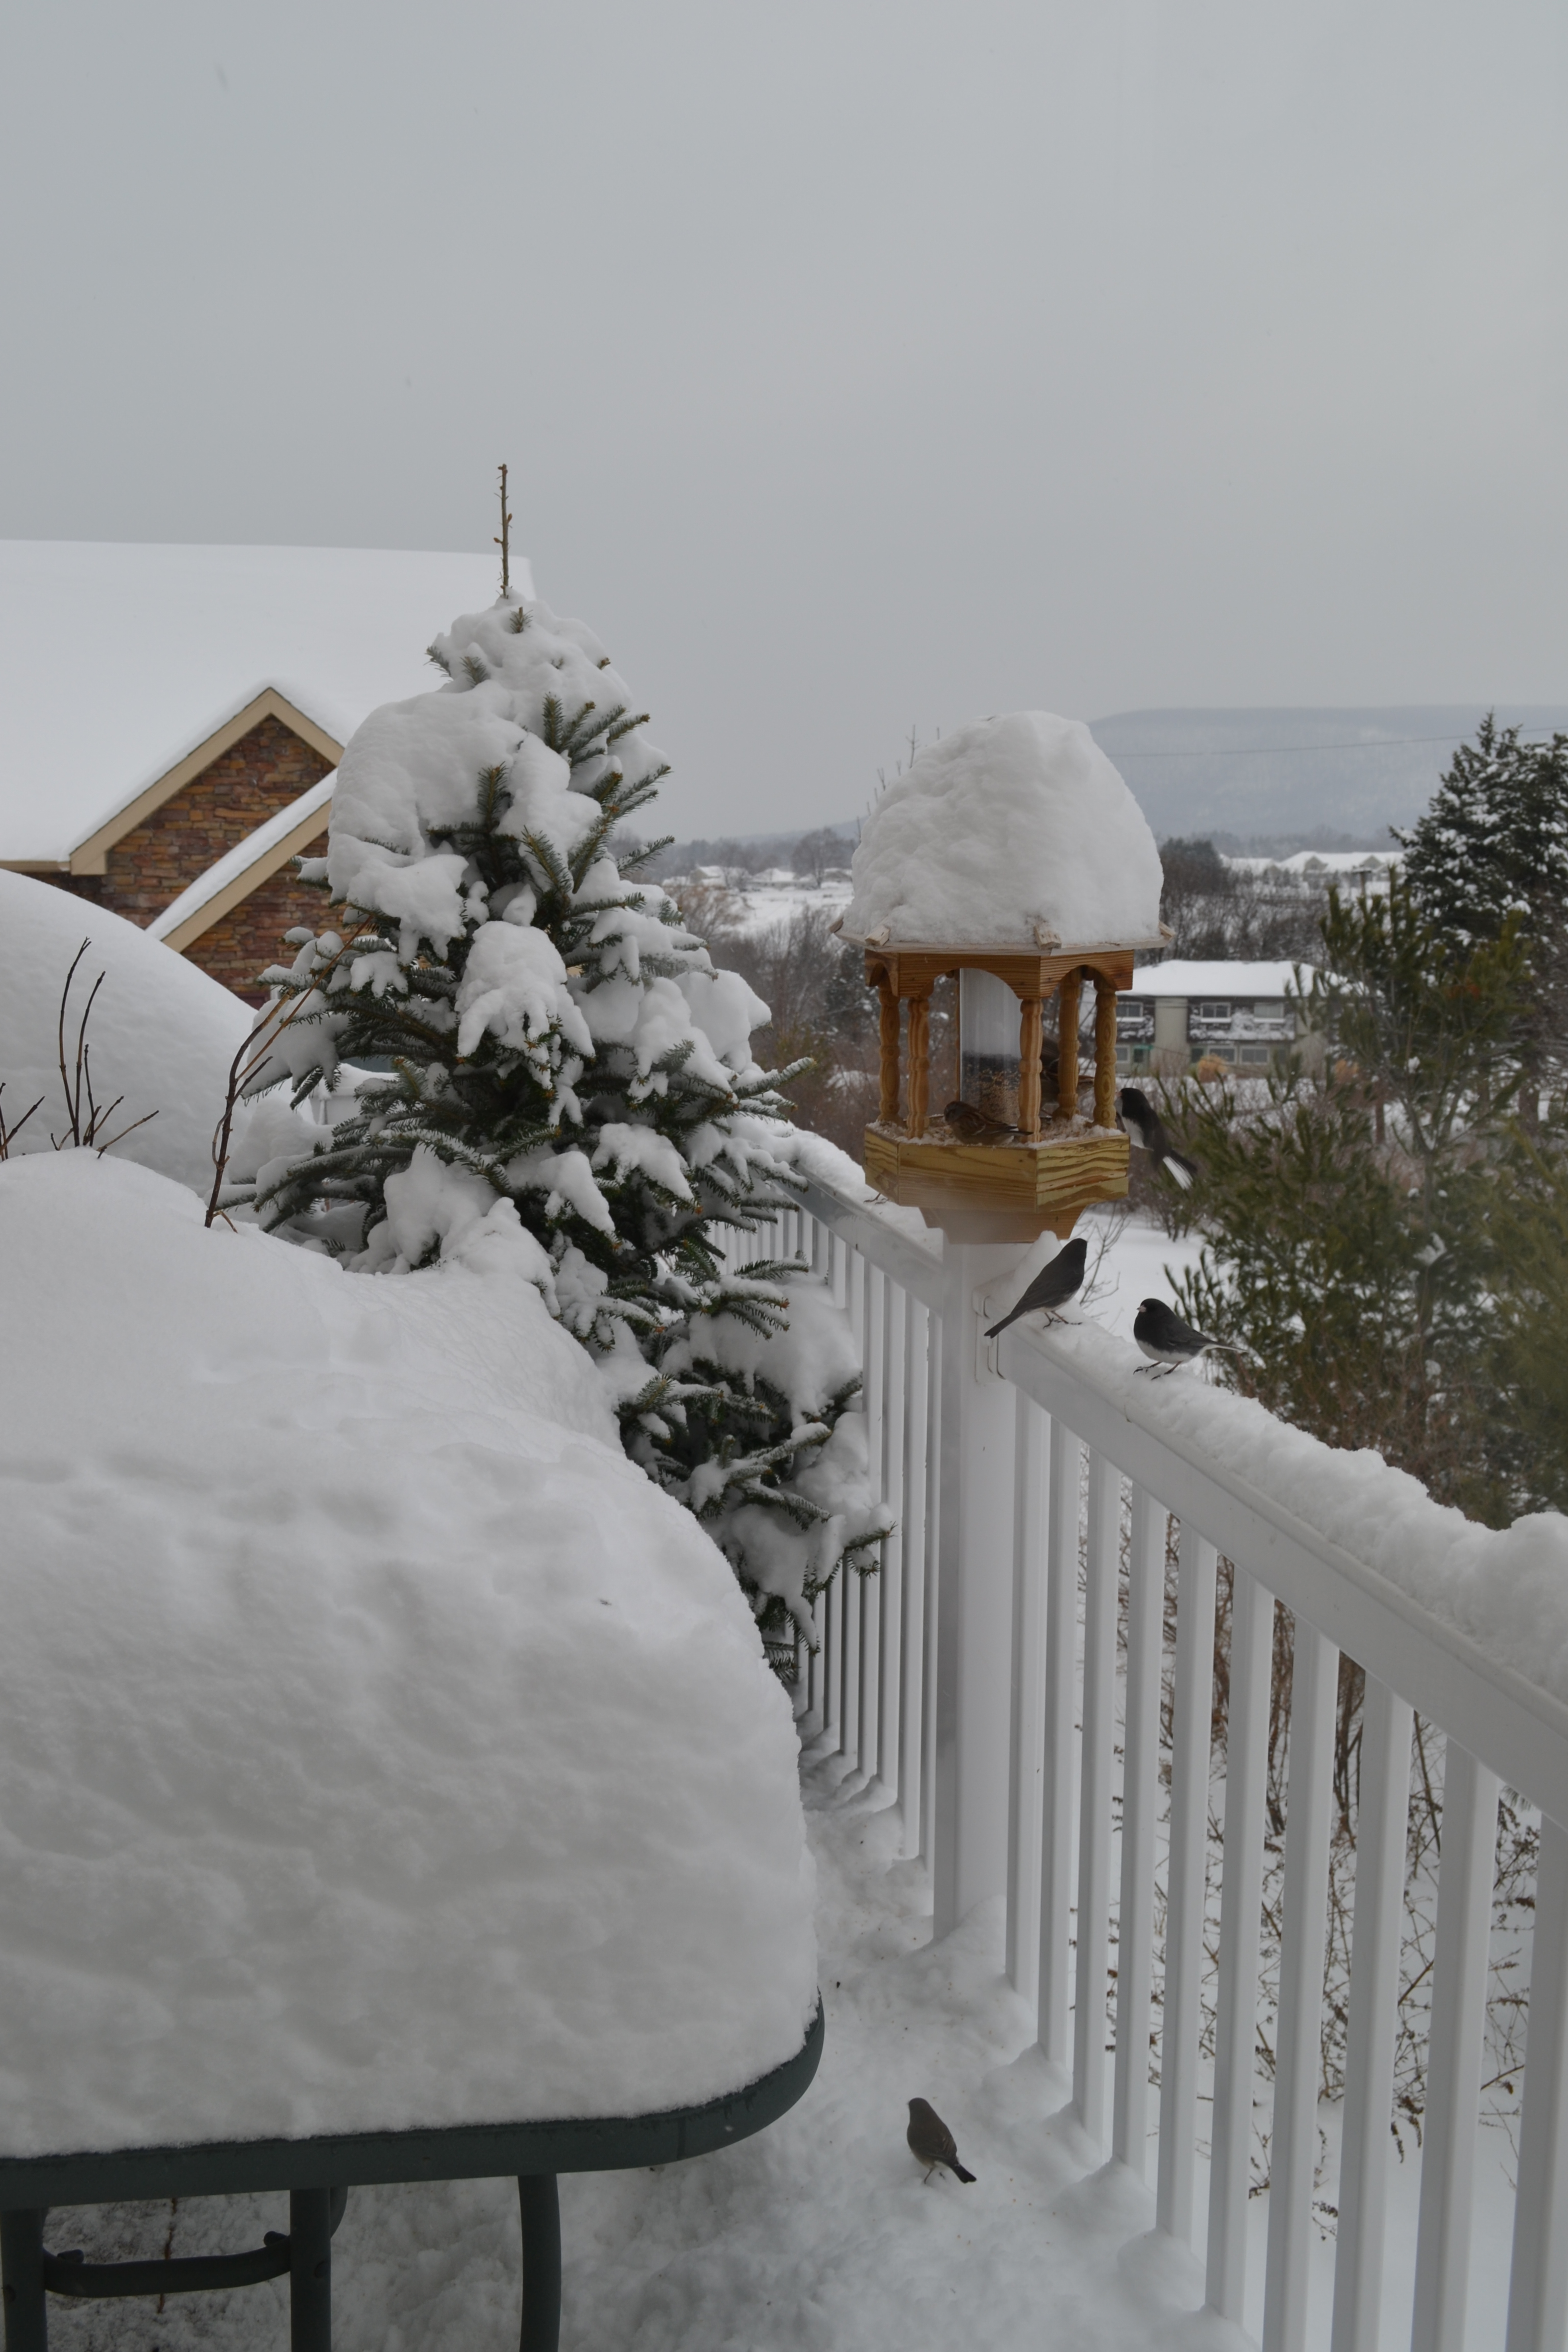
I am sitting in my office in Boalsburg, Pa. looking at the bird feeder. The birds are as busy as ever feeding. It is 15 degrees F so they need the food. Some song birds have come, the Robins are bobbing, but where is the spring? Last night the report on the satellite data came out via CFACT and it showed we had the coldest winter half-year (equinox to equinox) in over a century! Only two years ago we had the warmest winter ever. This was well publicized. Will this be equally treated?
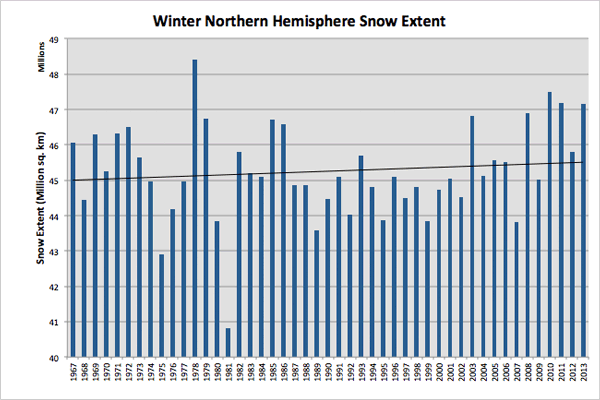
The other figure is the maximum snow cover for the season in the Northern Hemisphere. It has been growing in the last 50 years. This year was no exception with total snow well above the trend line.
I take more stock in snow totals than temperature measurements. The freezing point of water doesn’t change. Many temperature stations are placed in airports near the runways. This is fine and good for the pilots that must rely on the micro climate of the runways to make proper take-off and landing calculations, but they do not show the true temperature away from the airport.
I maintain we are more likely to have a new little ice-age than a temperature run-away because of CO2 rise.
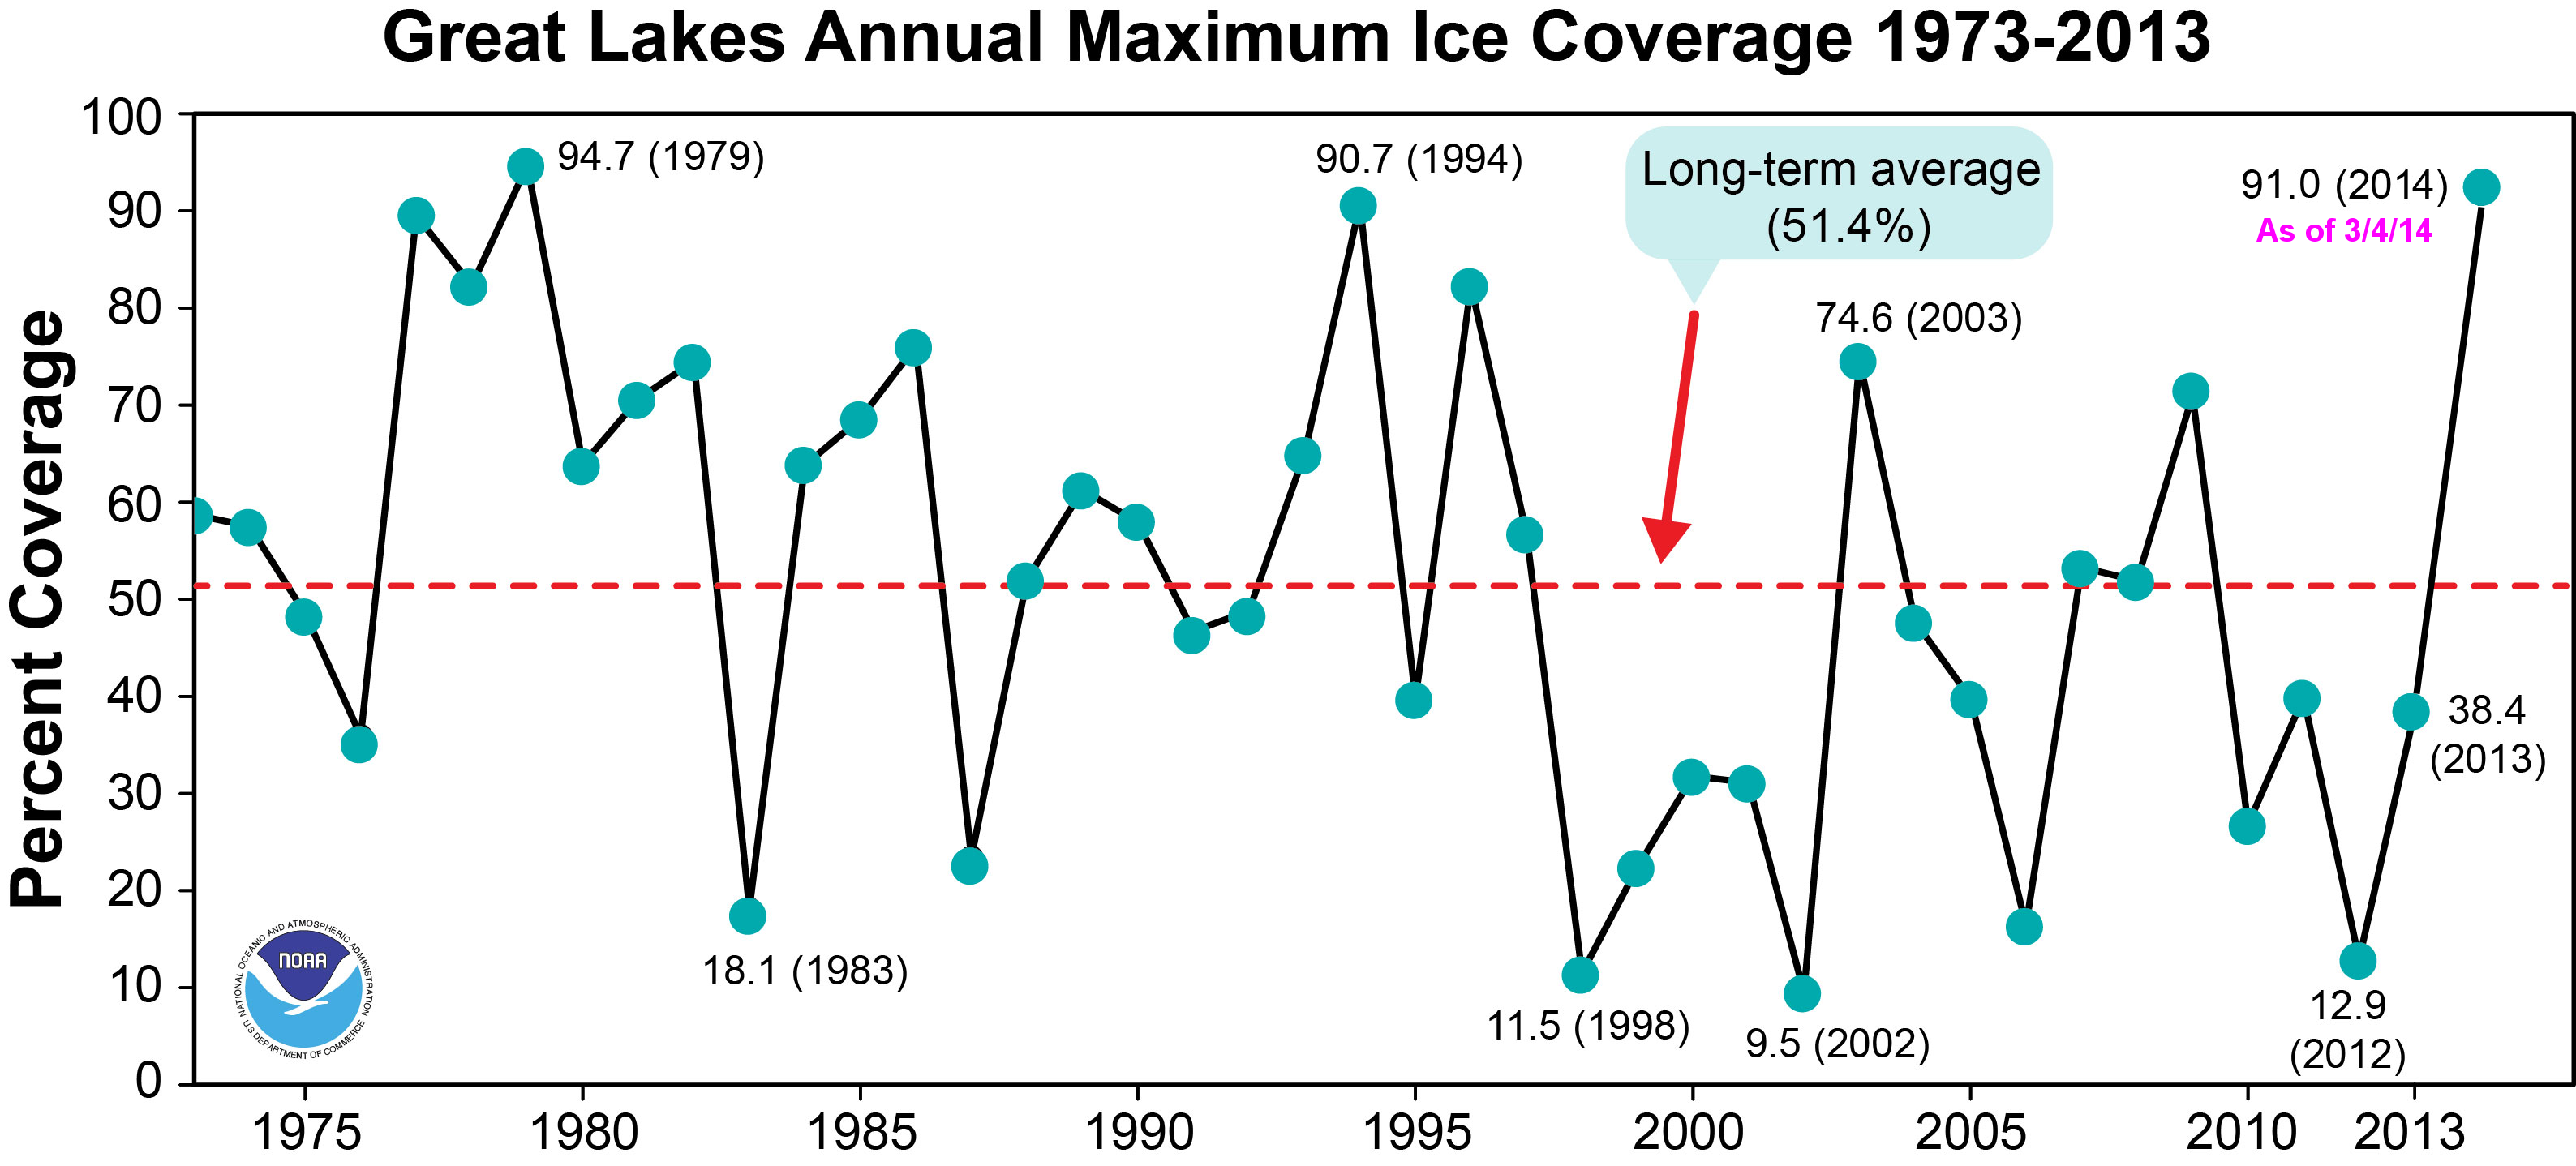
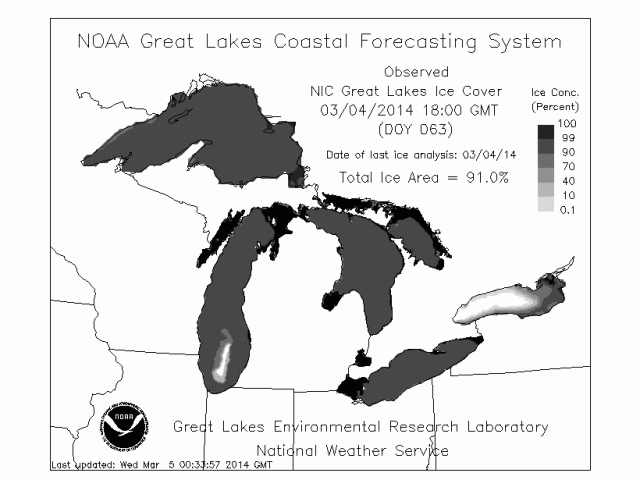
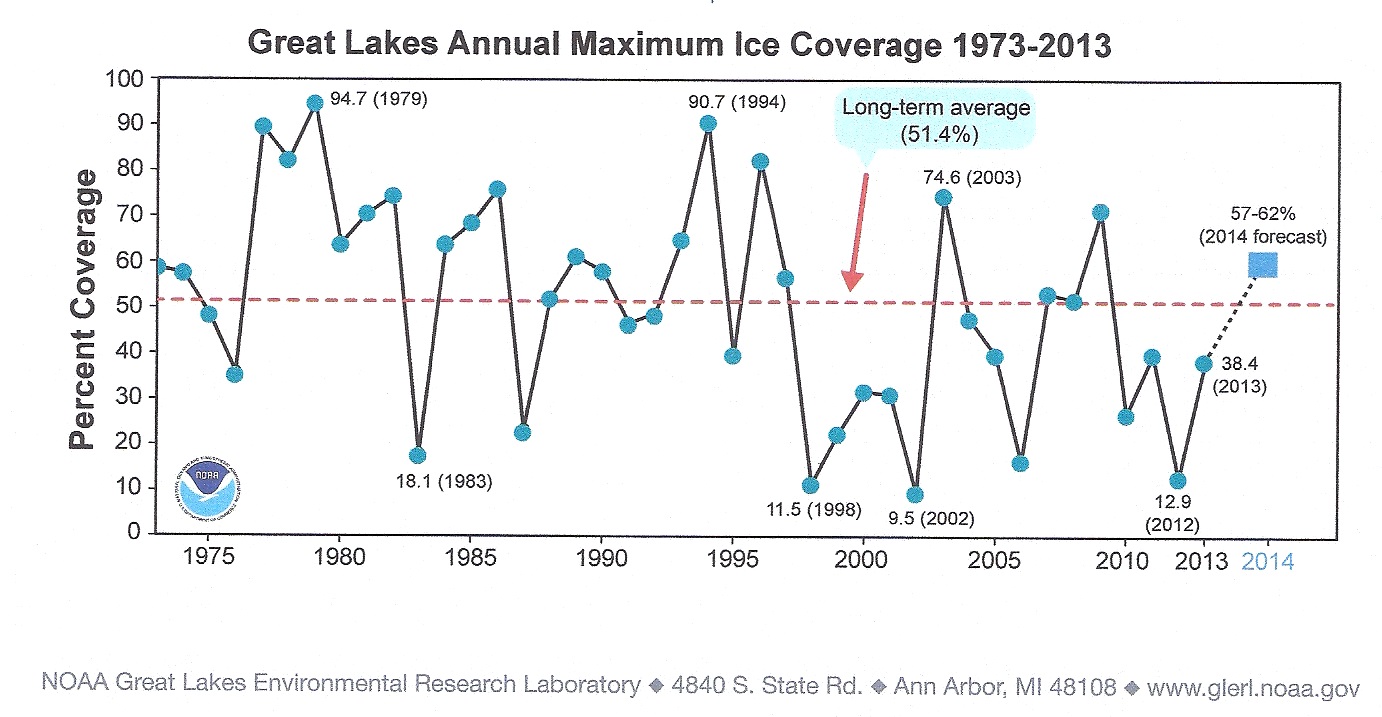
The Great lakes had the greatest ice cover in over 35 years:
The "vortex" has chilled the Great Lakes.
Keep shov'ling those "Climate Change" flakes!
For new records are set
Warmers losing their bet.
It's cold on our yearly "Spring Breaks".


The values for ice coverage on the Great Lakes as of Mar 4:
Lake Superior 95.2889%
Lake Michigan 92.4497%
Lake Huron 95.9375%
Lake Erie 95.8338%
Lake Ontario 31.9431%, the weighted average 91,0% (data from http://coastwatch.glerl.noaa.gov/statistic/ice/ice_stat_2013_2014.txt )
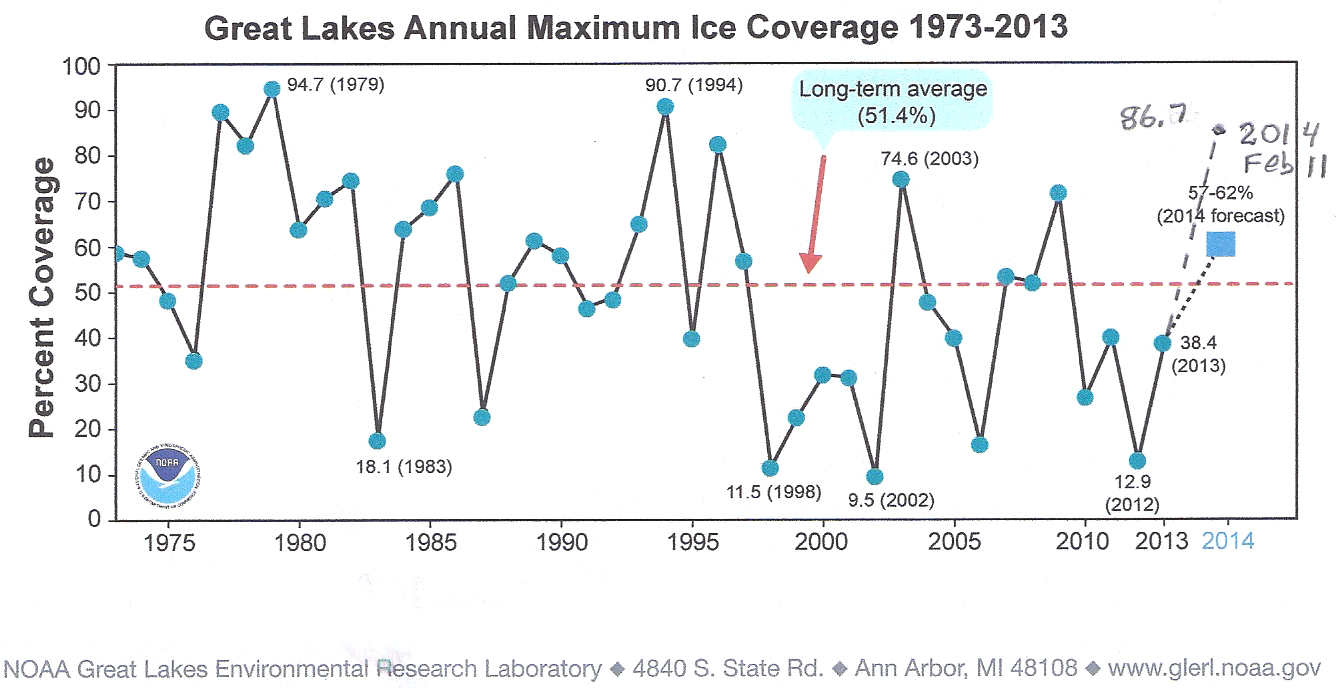
The forecast from NOAA was for 58 to 62% maximum ice-cover for 2014. We are now at the greatest ice cover since 1979, the second highest value since accurate records are kept with a couple of cold nights left to go. The average for the last 40 years is an ice maximum of 51.4%. See fig:
There is still an arctic blast ongoing. Detroit had a new snow record for January. It will take a long time to melt all this ice and snow come spring. It takes 80 calories to melt one gram of ice, but only twenty to heat it from zero to 20 degrees C (68 F) . This may affect the length of the growing season.
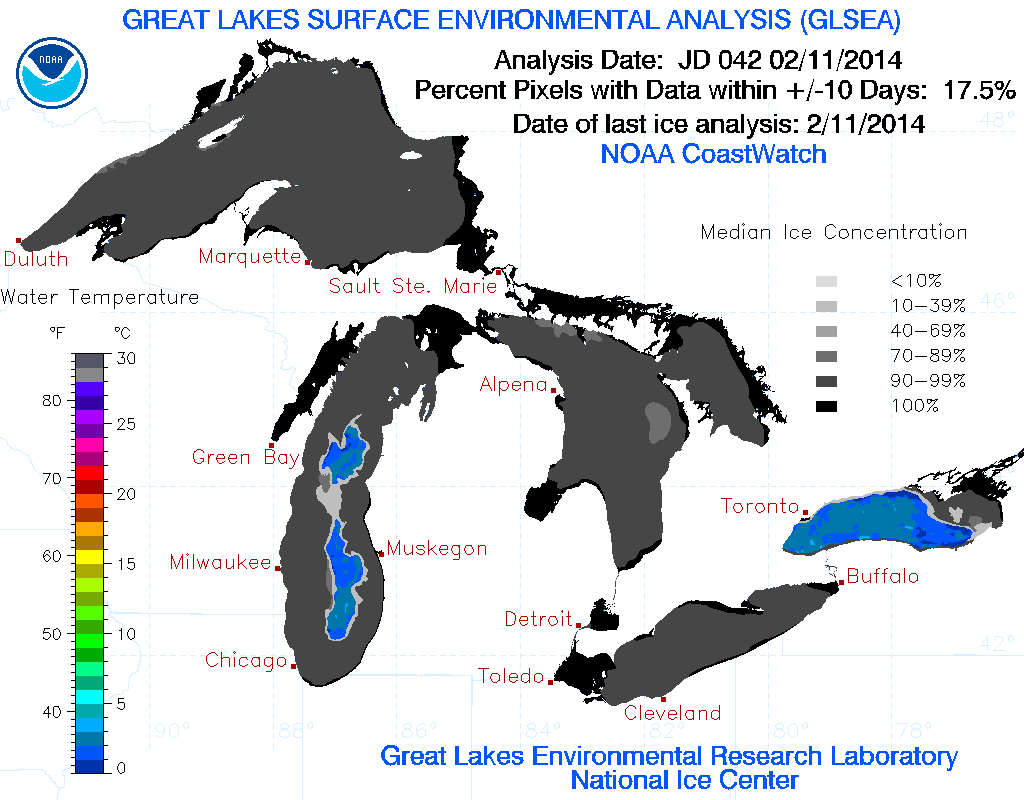
The Great Lakes are freezing over at a rapid rate. These are the numbers for the ice cover as of Feb. 11 (Feb 12)
Lake Superior 95.2793% (94.5851%)
Lake Michigan 79.9828% (82.3368%)
Lake Huron 94.7123% (95.4659%)
Lake Erie 95.8686% (95.773%)
Lake Ontario 31.9431%, the weighted average 86.7% (88%) (data from http://coastwatch.glerl.noaa.gov/statistic/ice/ice_stat_2013_2014.txt )
The forecast from NOAA was for 58 to 62% maximum ice-cover for 2014. We are already at the greatest ice cover since 1994 with a good part of the winter still left to go. The average for the last 40 years is an ice maximum of 51.4%. See fig:
There is still an arctic blast ongoing. Detroit had a new snow record for January. It will take a long time to melt all this ice and snow come spring. It takes 80 calories to melt one gram of ice, but only twenty to heat it from zero to 20 degrees C (68 F) . This may affect the length of the growing season.
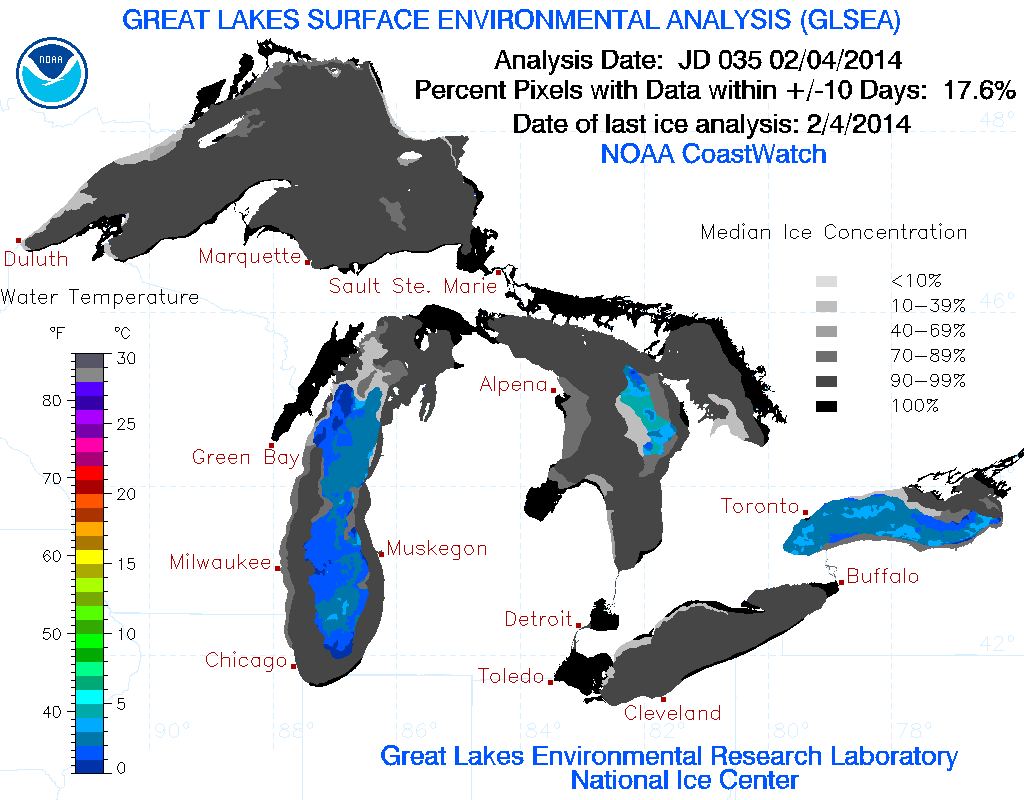
The Great Lakes are freezing over at a rapid rate. These are the numbers for the ice cover as of Feb. 4:
Lake Superior 91.6753%
Lake Michigan 56.3514%
Lake Huron 84.5919%
Lake Erie 92.6251%
Lake Ontario 30.7342%, the weighted average 76.93%
The forecast from NOAA was for 58 to 62% maximum ice-cover for 2014. We are already at the greatest ice cover since 1996 with a good part of the winter still left to go. The average for the last 40 years is an ice maximum of 51.4%. See fig:
Here is a picture of the ice cover for Feb 4. Brr, and arctic blasts keep coming!! It will take a long time to melt all this ice come spring. It takes 80 calories to melt one gram of ice, but only twenty to heat it from zero to 20 degrees C (68 F) so you can take a dip.
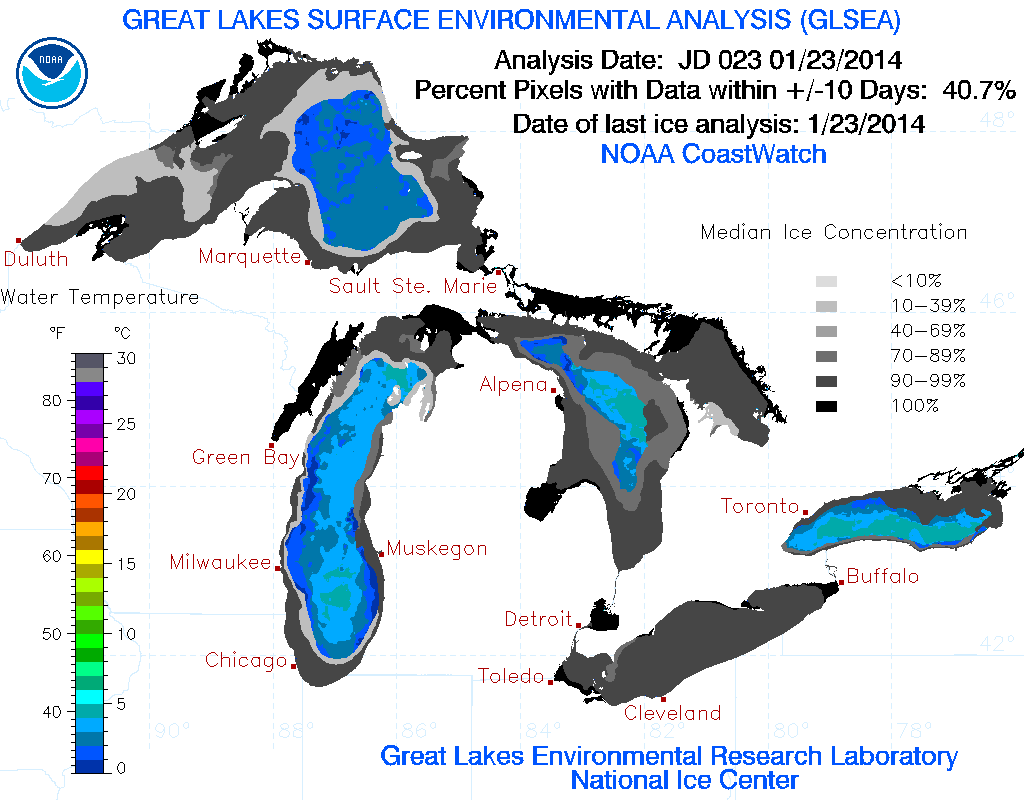
The Great Lakes are freezing over at a rapid rate. These are the numbers for ice cover for Jan. 23:
Lake Superior 57.2062%
Lake Michigan 37.7962%
Lake Huron 75.7721%
Lake Erie 94.8880%
Lake Ontario 42.9223%, the weighted average 60.02%
The forecast from NOAA was for 58 to 62% maximum ice-cover for 2014. We are already there with half the winter yet to go. The average for the last 40 years is a max. of 51.4%. See fig:
Here is a picture of the ice cover for Jan 23. Brr, and a new, longer lasting arctic blast is under way!! It will take a long time to melt all this ice come spring. It takes 80 calories to melt one gram of ice, but only twenty to heat it from zero to 20 degrees C (68 F) so you can take a dip.


