Voter fraud in California? Yes, millions of non-citizens with driver’s Licenses voted!

After the 2016 election Judicial Watch made an investigation of the California election. The Federal Government maintains a list of its citizens, the state governments don’t. Judicial watch made an investigation of the registered voters and found that eleven counties had more voters registered than the number of eligible voters. Here is a list of them:

County           Vote            Vote       % eligible  Clinton/
—————— Clinton      Trump   registered  Trump
Los Angeles 1,893,770    620,285   144            3.05
San Diego        567,243    386,807   138           1.47
San Francisco 312,445      34,493   114           9.06
San Mateo       192,035      47,627   111           4.03
Solano                94,622      48,712   111           1.94
Yolo                    34,460      13,178   110            2.61
Santa Cruz        85,185      20,158   109            4.23
Monterey          64,733      26,378   104            2.45
Stanislaus         73,939      72,960   102            1.01
Imperial            23,887        9,318   102            2.56
Lassen                 2,224        7,574   102            0.29
11 Co. Total  3,344,543  1,287,490                    2.60

Rest of Calif 2,514,062   1,391,229                   1.81
All Calif.       5,858,605  2,678,719                    2.19

This compilation is remarkable in so many ways.

California has 3.4 million resident aliens (green card holders and special visas). They are not eligible to vote. They also have about 3 million illegal aliens (obviously not eligible to vote)

California has motor voter registration. They issue driver’s licenses to, not only resident aliens but also to illegal aliens. All they have to do to be registered to vote is to check a box indicating they are eligible. No check for its validity is performed.

Los Angeles County is the capital of illegal aliens, so it comes as no surprise that since they now have driver’s licenses and thereby by extension are made eligible to vote, the ratio of 1.44 between registered voters and lawfully eligible voters comes as no surprise.

Silicon valley has more resident aliens than other areas of California, so it is no surprise they have registered voters exceeding eligible voters.

There is one small county located way up in North East California, Lassen County which voted heavily for Trump. It has only two major employers, two state prisons and one federal prison. Could Lassen County have registered ineligible felons?

This calls for a thorough investigation if the integrity of voting means anything.

The link to the letter from Judicial watch to CA, http://www.judicialwatch.org/document-archive/nvra-letter-ca-august-2017/

As far as I know nothing was done to remedy the situation.

California is no longer a growing state. The population may even be declining in 2020. See this chart:

So we would then expect the numbers for the 2020 election to be about the same

County 2020 Vote   020 Vote Increase  Increase
—————— Biden      Trump       Biden     Trump

Los Angeles 2,609,329  984,383   37.8%       58.7%
San Diego        933,468  577,573   64.6%       49.3%
San Francisco 373,186   55,347    19.4%       60.5%
San Mateo       225,185    54,456    17.2%       14.3%
Solano              124,752    65,558    31,8%       34.6%
Yolo                    47,504     16,128    36,7%       22,4%
Santa Cruz       109,745    25,485    28.8%       26.4%

Monterey           93,874   34,893    45.0%         32.3%

Stanislaus          84,668    79,622   16.1%           8.1%
Imperial             34,430    20,577    44.1%      120.8%   
Lassen                   2,772      8,798    24.6%        16.2%

One more county is of interest, Orange Co. It used to be solidly Republican

2020                 792,966     655,811 Total: 1,448,777 Advantage Biden   20.9%

2016                 556,544    472,669  Total: 1,029,213 Advantage Clinton 17.8%

2012                457,077     541,092  Total:    998,169 Advantage Romney 18.4%

2008                518,925     557,370  Total: 1,076,295 Advantage McCain 7.4%


Two Statistical Curiosities That Allowed Biden To Pull Ahead In PA: A Limerick and more.

The votes that was tallied in Philly

were not added up willy-nilly.

For the fraud is state-wide

leaving no place to hide.

It’s treason; deny it is silly.

Two Statistical Curiosities That Allowed Biden To Pull Ahead In PA:

A brief note. I’ve been asked to examine the Pennsylvania votes. That work is ongoing. Update See below for a serious critique of Benford’s law.

I’m showing here (with permission) the one analysis I found most curious.

This is official county-level timed voting data that started at 2020-11-04 11:00:00, a day after the election, to 2020-11-07 11:29:00 which is Saturday night. That is, these are all late vote counts. They start, county by county, where the vote left off on election night.

This is a picture of the running totals by the time the votes were added, summed across all counties, during those time periods. They do not start at 0, but at the totals given after election night.

The early gains for Biden are from, mainly, Philadelphia, Allegheny, Montgomery, Chester and Berks counties. A simple plot

shows the size of vote additions for both candidates, when new vote totals (greater than 0) were added by county (and not all counties added votes after election day).

All goes well for Trump until 2020-11-04 21:15:00 when he loses just under 10,000 votes, but curiously from three different counties simultaneously: -1,063 Allegheny; -2,972 Bucks; -7,135 Chester. Biden never lost any votes (at least, in this late voting).

Understand that this does not mean the decreases happened at this time, but that they were recorded in the official data as happening at that time. And the same is true for our next observation.

Biden’s next curiosity was the big increase of 27,396 votes at 2020-11-06 08:53:00 over one consecutive reporting period. This bump is just like the blue-red F-memes you have seen: this only seems more spread out because of the finer time scale used.

These two curiosities account for a 37,263 vote swing for Biden. Biden’s total, as of the end of this data, was 3,344,528, and Trump’s 3,310,326. Biden therefore “won”, in this dataset anyway, by 34,202 votes.

Biden could not have pulled ahead without the curiosities noted above.

There is more to come. Stick around.

Update Benford’s law is only useful in uncovering multiple and on-going instances of cheating. As in somebody consistently cooking financial books. As I showed above, assuming the curiosities are cheats, it only took two instances to tip the balance. Benford’s law will never pick this up: never.

I’m skeptical of what I’m seeing in other analyses, because if somebody turns something up with Benford, it implies that many, many vote totals were tampered with, which increases the possibilities of getting caught. And you don’t need to tamper with many. Only a few.


Benford’s law and the 2020 election. A Limerick on fraud.

Elections and fraud in this nation

cannot stand a close observation.

Zero Trump votes are added

but Joe Biden’s are padded

an act of the left’s desperation

This is a map of the extent to which Dominion voting machines software is presently used. When votes are tallied it produces results that are not credible according to statistical science.

Joe Biden’s votes violate Benford’s Law, President Trump’s do not.

Benford’s law or the first-digit law, is used to check if a set of numbers are naturally occurring or manually fabricated. It has been applied to detect the voting frauds in Iranian 2009 election and various other applications including forensic investigations.

Benford’s Law, also called the Newcomb–Benford law, the law of anomalous numbers, or the first-digit law, is an observation about the frequency distribution of leading digits in many real-life sets of numerical data. The law states that in many naturally occurring collections of numbers, the leading digit is likely to be small. For example, in sets that obey the law, the number 1 appears as the leading significant digit about 30% of the time, while 9 appears as the leading significant digit less than 5% of the time. If the digits were distributed uniformly, they would each occur about 11.1% of the time. Benford’s law also makes predictions about the distribution of second digits, third digits, digit combinations, and so on.

Plots of the first digits of counts in various precincts and wards for selected counties/cities.

This is Pittsburgh.

But even cities where we know the outcome, the numbers have been manipulated such as

When this fraud is corrected the electoral map will look quite different, and may even swing a few house and senate votes.

Is Sweden near “herd immunity”? There are hopeful signs that herd immunity against COVID-19 is much closer than previously thought.

“Sweden has gone from being the country with the most infections in Europe to the safest one”. As the rest of Europe and the world remains under the grip of draconian rules and the threat of new lockdowns, Sweden, which allowed its citizens to remain free throughout the entire pandemic, has pretty much declared victory over the coronavirus. The country now has one of the lowest infection rates on the planet, and it’s difficult not to admire how it has handled the past year, with no strict lockdown or compulsory face mask rules. All businesses, schools and public places remained open in Sweden for the duration.

“Sweden has gone from being the country with the most infections in Europe to the safest one,” Sweden’s senior epidemiologist Dr. Anders Tegnell commented to Italian newspaper Corriere della Sera. “What we see now is that the sustainable policy might be slower in getting results, but it will get results eventually,” Tegnell clarified. “And then we also hope that the result will be more stable,” he added.

Tegnell previously warned that encouraging people to wear face masks is “very dangerous” because it gives a false sense of security but does not effectively stem the spread of the virus. “The findings that have been produced through face masks are astonishingly weak, even though so many people around the world wear them,” Tengell has urged.

Last week, the European Center for Disease Prevention and Control confirmed Sweden’s drop in infection rate, with only 12 cases per million, compared to 18 in neighbouring Denmark and 14 in nearby Norway. At the peak of the Sweden’s outbreak, it was seeing 108 new infections per million people, as it pursued a “herd immunity” strategy.

The figures also show that out of 2500 randomly selected and tested people in Sweden, none tested positive, compared to 0.9 percent positive in April, and 0.3 percent in May. “We interpret this as meaning there is not currently a widespread infection among people who do not have symptoms,” said Karin Tegmark, deputy head of the Public Health Agency of Sweden.

When compared to the rest of Europe, Sweden’s death rate sits somewhere in the middle. However, officials are confident that playing the long game will see this improve drastically.

1. Italy 277,634 35,541 12.8%

2. United Kingdom 347,152 41,551 12.0%

3. Belgium 87,825 9,906 11.3%

4. France 324,777 30,724 9.5%

5. Netherlands 74,787 6,243 8.4%

6. Channel Islands 631 48 7.6%

7. Hungary 8,387 624 7.4%

8. Isle of Man 337 24 7.1%

9. Sweden 84,985 5,835 6,9%

This compares favorably with the seven day moving average as of September 7 of COVID-19 infection rate per million people for the rest of Europe:

France         105

Bosnia and Herzegovina 73

Spain             70

Croatia          64

Romania       63

Ukraine         55

Czechia          55

Belgium         42

Netherlands 41

Switzerland  40

Portugal        35

Austria          34

UK                  30

Ireland          27

Denmark      27

Italy               21

Bulgaria       18

Greece          18

Germany      15

Poland          14

One country had a larger second wave than the first wave of cases, the waves have been completed and the current case rate for

Serbia   is       9 daily cases per million people.

They may be close to herd immunity too.


U.S.A. corona virus death rate as of September 5 is 3.00%, 41 countries have higher death rates. 15 countries giving HCQ+Zinc+Z-pak to COVID-19 patients as soon as symptoms occur have much lower death rates.

In 1956, the U.S. Food and Drug Administration approved HCQ for symptoms of lupus and rheumatoid arthritis, particularly skin inflammation, hair loss, mouth sores, fatigue, and joint pain. It was deemed safe to take in perpetuity with a weight appropriate daily dose, typically 250 to 500 mg/day. In fact it is deemed so safe that pregnant women and nursing mothers can take it without restrictions.

The number of corona-virus cases for U.S.A as of September 5 is 6,452,833 and  deaths are  193,121 making the death rate 3.00%. There are four states: New York, New Jersey, Pennsylvania and Michigan, under DOJ  investigation because they required nursing homes to admit and readmit COVID-19 cases resulting in many deaths. If these states are excluded from the count the death rate would be 2.30%

The Democratic convention speakers assured us that this was the worst result of any country in the world, thanks to President Trump’s inaction and refusal to accept science. So, how does U.S.A. compare to the rest of the world? The cases, deaths and death rates for all countries with higher death rates are listed below:

(All numbers are received from  https://www.worldometers.info/coronavirus/)

1. Yemen                                                      1,987                      572   28.8%

2. Italy                                                      277,634                 35,541    12.8%

3. United Kingdom                               347,152                 41,551      12.0%

4. Belgium                                                87,825                   9,906      11.3%

5. Mexico                                                 629,409                 67,326     10.7%

6. France                                                 324,777                 30,724       9.5%

7. Netherlands                                         74,787                   6,243        8.4%

8. Channel Islands                                        631                        48        7.6%

9. Hungary                                                 8,387                        624      7.4%

9. Chad                                                      1,034                           77        7.4%

10. Isle of Man                                               337                        24        7.1%

11. Canada                                              131,858                    9,145       6.9%

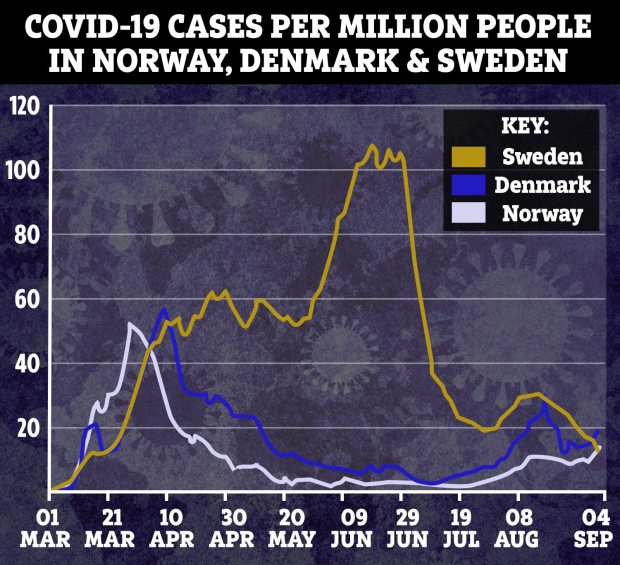
11. Sweden                                                84,985                    5,835       6,9%

13 Liberia                                                   1,307                       82          6.3%

14. Sudan                                                   13,407                      832        6.2%

15. Ireland                                                 29,672                  1,777        6.0%

16. San Marino                                             716                         42       5.9%

16. Niger                                                      1,177                       69        5.9%

18. Iran                                                     386,658                22,293      5.8%

19. Ecuador                                             118,045                  6,724       5.7%

19. Spain                                                  517,133                 29,418      5.7%

21. Egypt                                                    98,062                  5,342       5.4%

22. Switzerland                                        44,401                  2,013       4.5%

22. Mali                                                       2,842                     127        4.5%

22. Bolivia                                             120,241                  5,398          4.5%

25. Andorra                                                1,215                       53        4.4%

26. Slovenia                                                3,165                     135        4.3%

26. Peru                                                   683,702               29,687        4.3%

28. Indonesia                                         194,109                 8,025         4.1%

28. Finland                                                  8,291                   336          4.1%

28. North Macedonia                            15,090                    617           4.1%

28. Tanzania                                                509                       21           4.1%

32. Barbados                                                 178                         7         3.9%

32. Burkina Faso                                      1,408                       55          3.9%

32. Bulgaria                                             17,050                   671           3.9%

35. Germany                                         251,456                 9,401          3.7%

35. Sint Maarten                                         511                      19           3.7%

35. Guatemala                                         77,481                2,845          3.7%

35. Afghanistan                                      38,398                1,412           3,7%

39. Denmark                                           17,883                   627           3.5%

40. Brazil                                             4,123,000             126,266          3.1%

41. Poland                                                70,824                 2,120           3.0%

That’s right! U.S.A. ranks as 42th worst country!

Now there are countries that do better, some much better. One group has this in common: They administer a proper therapy of hydroxychloroquine, most often with Zinc and Z-max as soon as symptoms occur, with or without a positive test. Some of the countries are so poor that it is all they can afford. The result?

Country               Cases     Deaths

1. Qatar                120,905          203    0.17%   The country of Qatar consists of 88% temporary workers between the ages of 20 and 60 and most of the deaths occurred in the remaining 12% of the original population.  This means that the death rate of persons between the ages of 20 and 60 is less than 0.2% if given HCQ + Zinc  as soon as symptoms occur or as a prophylactic administered instead of contact tracing and quarantine. If this regimen would be implemented immediately we could fully open schools and universities, have college and professional sports again and fully open all businesses. The most vulnerable would of course still have to be protected.

2. Bahrain               54,771        199     0.3%  Again, about half of the population are  immigrants or guest workers. They have a high rate of obesity and diabetes, but HCQ seems to be working excellent in Bahrain

3. UAE                      73,984        388     0.5%  The United Arab Emirates is a nation of 88% non-citizen immigrants and guest workers. there are over twice as many males as there are females.

4. Israel                 130,157      1,012    0.8%

5. Costa Rica            46,920        478    1.0%

6. Malaysia               9,397         128    1.4%

7. South Korea      21,177          334    1.6%

8. India              4,202,562     71,687   1.71%

9. Russia             1,025,505   17,820    1.74%

10. Morocco           72,394       1,361   1.9%

11. Ukraine          135,894       2,846   2.1%

12. Senegal             13,987         290     2.1%

13. Cuba                    4,309          101   2.3%

14. Turkey            279,806      6,673    2.4%

15. Greece               11,524         284    2.5%

There are countries that are not doing as well as U.S.A. in combating the corona pandemic, even though they freely administer HCQ. They are

16. Algeria                 46,364     1,556   3.4%

17. Indonesia          194,109     8,025   4.1%

and probably others. Many countries’ health statistics are of dubious accuracy. That is why China is excluded.

Other countries, such as

Iceland                        2,141          10      0.5%

Faeroe Islands              413             0     0.0%

Japan                        70,876        1,349   1.9%   have had success with a thorough contact tracing and quarantine. This can only be done if caught at the earliest stages of the disease. Remember, Japan never allowed the people from the infected cruise ship to enter Japanese soil and be treated in hospitals.

Vaccine may not be as effective as first thought. The china corona virus has mutated into 11 strains, and continues to mutate, so a universal vaccine cannot be developed, but like the flu, every year will have a new regional strain to combat.

The solution is to implement a hydroxychloroquine + Zinc + Zitromax regimen, both as a prophylactic and as a therapy as soon as symptoms occur.

According to the Ford study treatment with hydroxychloroquine cut the death rate significantly in sick patients hospitalized with COVID-19 – and without heart-related side-effects, the new study published by Henry Ford Health System. The death rate was cut in half for patients treated with HCQ. It is even more dramatic if HCQ is administered as soon as symptoms occur, over 40 international studies have shown an up to 80+% reduction in death rates. For some reason FDA and CDC do not acknowledge international studies. They rather let people die than accept a drug that has been approved for 64 years, and given freely to people with Lupus. It is so safe it is even given to pregnant women and nursing mothers.

How many extra deaths are we talking about? HCQ is already administered under right to try by about 16% of all cases. If it had been recommended in April, one month after President Trump recommended it based on excellent results in french studies, about half the deaths from then on could have been avoided. It adds up, about 1.5% of all cases since April 15, or about 78,000 deaths could have been avoided,  and moving forward about 600 deaths a day. This is in my opinion a low estimate.

Another significant moment in the hydroxychloroquine debate came on July 23 in the form of an opinion piece. Harvey A. Risch, MD, PhD, a professor of epidemiology at Yale School of Public Health with many years of healthcare experience, wrote in favor of the medication, calling it “highly effective” and describing physicians who use it “in the face of widespread skepticism” as heroes.

In his opinion piece, Risch listed several studies that have pointed to the benefits of treating COVID-19 with hydroxychloroquine. He also wrote about how the medication has been politicized and said it “has not been used properly in many studies.”

“In the future, I believe this misbegotten episode regarding hydroxychloroquine will be studied by sociologists of medicine as a classic example of how extra-scientific factors overrode clear-cut medical evidence,” he concluded. “But for now, reality demands a clear, scientific eye on the evidence and where it points. For the sake of high-risk patients, for the sake of our parents and grandparents, for the sake of the unemployed, for our economy and for our polity, especially those disproportionally affected, we must start treating immediately.”

His assessment of lives saved with HCQ ++ was 70,000 lives would have been saved as of Aug 1 if HCQ had been used as early as possible. He is the scientist, I am using public data drawn from a population of 2 billion people, and we reached a very similar conclusion.

Do it! The fact that President Trump has advocated it as early as March should not be a hindrance to save 600 lives a day!

Why Joe Biden is called “Sleepy Joe”. A Limerick.

Joe Biden a-napping in Delaware

by interview wake-up-call unaware

Sleepy Joe, it’s a shame

from now on, you’re fair game

the sound of your snoring is in the air.


Who gets the vote this year in PA? Does the horse and buggy team make a difference? A Limerick.

Campaigning in Western PA
Is not what you think, this I say
For the Amish take part,
Vote for life, with their heart,
vote Trump, to the left’s great dismay.
I may be wrong on this buggy. The campaigner may not be Amish after all. He may be an Old Order Mennonite. That Order is even more conservative than the Amish. But they used to have one thing in common. They did not mingle with the English, and they did not participate in politics, and they did not vote. You may have seen cute pictures like this, thinking they still live like in the 18th century.

Nothing could be further from the truth. It is true, they didn’t use to vote. But in the 2000 election they started voting, and they voted pro life. They were always law abiding, and were allowed to keep their one room school houses with 8 year education, were allowed to have their own pooled medical services, and maintained their religious exemption from military service and social security. Do they really shun electricity? The picture below shows a recently built Amish homestead with the telltale clothesline, but also a small wind turbine and four solar panels to provide

electricity. Contrary to popular opinion the Amish do not shun electricity, they just want to be left unconnected to the “English”, in other words, live off the grid. Their desire to be independent force them to be resourceful and innovative, since they also follow the law of the land whenever possible. So it was, when the farms were mandated to refrigerate the milk before pickup they installed electric coolers. The electricity was generated by diesel generators, so bingo, they could get electricity for their workshops as well, and turn from primitive hand work to fully modern wood workshops, I know, they provided a first class kitchen for our home in Intercourse. They had a problem, federal law mandated headlights on their buggies to be street legal. The propane lights with gas stockings burned well, but were too fragile to last the bumpy buggy rides so they installed car headlights running on car batteries. They had to be charged often, and it became quite expensive, so the Amish in 2003 made the first commercially available LED headlights for their buggies, thereby extending battery life more than ten–fold for a marine deep-charge lead-acid battery, from six hours to 100 hours.

Even at 120 dollars a piece it made economic sense. How do you charge batteries? This is where the solar panels come in, they are used to charge the batteries. When the sun doesn’t shine the wind may blow, a reasonable backup. Now they have 12 volt electric power. The next step was to wire the house and install 12 V LED lights and provide 12 volt DC or 24 volt AC outlets for small appliances. The lights are great, but many appliances are still run the hard way, diesel engines providing compressed air, which run their wells with jet-pumps and in their hand mixers they take out the motor and replace with a compressed air motor. The LED lights beat kerosene lamps any day for efficiency, and even a compressed air driven refrigerator is much more efficient than a kerosene  refrigerator.

So if the grid goes down for an extended period of time, who is better off? The Amish are far ahead of us in preparation for catastrophes.

https://lenbilen.com/wp-content/uploads/2013/09/amishpanels.jpg

And the Amish do get together and fellowship for any reason, but mostly for their Sunday services, which are held in the upper room of their workshops, or in the kitchen for the women and the basement for the men. The horse-drawn pew-mobile is in the picture above, to the right. This is a tell-tale sign who hosts the service next time.

Hydroxychloroquine should be sold over the counter in limited quantities, It is safer than Aspirin, Tylenol and Benadryl. Sign the petition

We are making great strides in the fight against the corona-virus. In the beginning the disease had an 8,67% death rate. It is now down to 2.19%.

The corresponding numbers for U.S.A :  7.02%  death rate at the beginning of the disease. Ir is now down to 1.53%, a 78% decrease. With unrestricted availability to take HCQ+ we can reduce the death rate even further.

These are the numbers for every state.

State      Death rate max   7 day death rate now

Connecticut          9.62%     3.22%

New Hampshire  9.33%     5.2%

Missouri                8.96%     0.86% Prescribing hydroxychloroquine, chloroquine, and azithromycin for COVID-19 prophylactic is discouraged and not recommended. Prescribers include the diagnosis code or diagnosis with the prescription. Prescribers should consider limiting the amount prescribed.

Pennsylvania       8.81%     1.63%

Indiana                 8.77%     1.39%

New Jersey           8.73%     4.23%

New York State    8.64%     1.79%    Positive COVID-19 test result must be documented as part of the prescription.•Prohibits use of hydroxychloroquine or chloroquine for experimental or prophylactic use.

Michigan               8.58%     0.92%

South Carolina     8.52%     3.09%

Kansas                   7.69%     1.30% Strongly encourages vigilance in processing new prescriptions for chloroquine and hydroxychloroquine •Recommends that if used, chloroquine and hydroxychloroquine should be restricted to patients who are admitted to hospitals with COVID-19 infections.•Urges pharmacists to consider that patients currently taking hydroxychloroquine for FDA-approved indications (lupus, rheumatoid arthritis) could be affectedby increased prescribing and that supplies should be monitored by pharmacists for medication availability.•Recommends reaching out to prescribers to verify COVID-19 diagnosis.

West Virginia       7.68%     1.1%

Arizona                 7.62%     3.08%

Nevada                  7.53%     1.55% Restricts the dispensing of chloroquine and hydroxychloroquine. The patient must have a diagnosis of COVID-19 and the diagnosis is indicated on the prescription;

D.C.                         7.45%     0.86%

Oklahoma             7.29%     0.65%

Massachusetts     7.24%     4.55%

New Mexico         7.14%     1.97%

Maine                    7%           2%

Mississippi           7.06%     1.62%

Wisconsin            6.97%      0.93%

Colorado               6.96%     1.28%

Rhode Island       6.92%      0.88%

Alabama               6.61%     1.21%

Delaware              6.55%      2%

Maryland              6.16%     1.10%

Washington          5.69%     1.10%

Georgia                 5.24%     1.23%

Kentucky              5.02%     0.93% Prescriptions for chloroquine, hydroxychloroquine, mefloquine, and azithromycin may only be dispensed if: The prescription bears a written diagnosis from the prescriber consistent with its use;

Ohio                       4.97%     1.93% Prescriptions for either presumptive positive patients or prophylactic use of chloroquineor hydroxychloroquine related to COVID-19 is strictly prohibited unless the drugs are for use as part of a documented institutional review board-approved clinical trial to evaluate the safety and efficacy of the drugs to treat COVID-19

California             4.82%     1.47%

Arkansas              4.70%     1.20%

Oregon                  4.66%    1.76%

Illinois                  4,66%    1.12%

North Carolina   4.47%     1.27% Rule applies to hydroxychloroquine, chloroquine, lopinavir-ritonavir, ribavirin, darunavir, and azithromycin;•For above drugs, a pharmacist can only fill or refill a prescription if that prescription bears a written diagnosis from the prescriber consistent with its evidence for use;•If a patient has been diagnosed with COVID-19, any prescription of a drug listed above for the treatment of COVID-19 must: Indicate on the prescription that the patient has been diagnosed with COVID-19

Louisiana             4.18%     1.85% The boardoriginally issued an emergency rule to limit the dispensing of chloroquine and hydroxychloroquine to address shortages,but rescinded the rule after it received information about a significant donation and distribution of the drugs from the manufacturer, along with the removal of the drug from FDA’s drug shortage list.•It now encourages each pharmacy to exercise professional discretion to dispense limited quantities of the drug as appropriate

Florida                  4.02%     1.75%

Montana               4%          1.4%

Idaho                     3.70%     1.21%  No prescription for chloroquine or hydroxychloroquine may be dispensed except if the following apply: The prescription bears a written diagnosis from the prescriber consistent with evidence for its use;

Vermont                3.6%       1%

Texas                     3.60%     2.56% No prescription or medication order for chloroquine, hydroxychloroquine, mefloquine or azithromycin may be dispensed or distributed unless all the following apply:oThe prescription or medication order bears a written diagnosis from the prescriber consistent with the evidence for its use; The prescription or medication order is limited to no more than a 14-day supply unless the patient was previously established on the medication; and no refills may be permitted unless a new prescription or medication order is furnished

North Dakota       3.6%       0.8%

Minnesota            3.55%     0.70%

Tennessee            3.50%      0,71%

Alaska                   3.5%        1%

Iowa                      2.95%      1.27%

Hawaii                  2.8%        0.5%

Virginia                2.76%      1.40%

Utah                      1.66%      0.97%

South Dakota       1.1%       1.25%

Wyoming              1%           0.5%

Nebraska              0.82%     0.72%

For all states, June 15, the U.S. Food and Drug Administration (FDA) revoked the emergency use authorization (EUA) that allowed for chloroquine phosphate and hydroxychloroquine sulfate donated to the Strategic National Stockpile to be used to treat certain hospitalized patients with COVID-19 when a clinical trial was unavailable, or participation in a clinical trial was not feasible. The agency determined that the legal criteria for issuing an EUA are no longer met. Based on its ongoing analysis of the EUA and emerging scientific data, the FDA determined that chloroquine and hydroxychloroquine are unlikely to be effective in treating COVID-19 for the authorized uses in the EUA.

By the time the patient is hospitalized it may be too late to have any benefit of HCQ+ treatment. It works best as a prophylactic or taken as soon as the telltale sign occurs, loss of taste and smell, shortness of breath, etc. Then is the time to start the HCQ + Zn + Zmax treatment, even before a positive diagnosis is established.

Release HCQ to be sold as over the counter medication. For LUPUS and rheumatorial arthritis patients it is even prescribed to pregnant women and nursing mothers. It is that safe.

Here is the petition to the WhiteHouse to release it to over the counter dispensation. (19287 signed so far)


The case for Thorium. 27. With electric cars and trucks replacing combustion engine cars, only Thorium Nuclear power is the rational solution to provide the extra electric power needed.

It seems that electric powered vehicles are finally taking off, and sales are ready to explode. The Tesla electric car company capitalization value has increased eight-fold in the last half year, and is now worth more on paper than GM, Ford, Chrysler and Honda combined .

If CO2 is the great driver of environmental destruction, never mind that the increased CO2 is feeding 2 billion more people than before thanks to the greening effect of increased CO2, then we should work at warp speed to develop the additional electricity needs that will arise with all electric vehicles coming to market needing charging stations.

It makes no sense to build more coal and gas fired electric plants, replacing one CO2 generator with another, the best wind power sites are already taken, waste, geothermal and solar power is still a pipe dream, so, what to do?

Conventional nuclear power is limited and requires a very long and extensive approval process, partly due to the not in my backyard regulation attitude.  We are already the world’s largest importer of Uranium, and the world’s supply is to a large extent controlled by non allies. .

How do you eliminate all Coal and natural gas electric plants? Look at the U.S usage: (Last  year 2016)

Image result for electric production"

We can see that renewable energy will not suffice. The only real answer is to expand nuclear electricity, but we are already the world’s biggest importer of Uranium. (The Uranium One deal, when we sold 20% of our Uranium mining rights to Russia did not help, but we were in trouble even before ). No, the only real answer is to rapidly develop molten salt Thorium nuclear electricity production. They do not require water for cooling, so they can be placed anywhere where additional capacity is needed, eliminating rapid expansion of the electric grid.

Let us go to it now!

The case for Thorium. 15. No need for evacuation zones, Liquid Fuel Thorium Reactors can be placed near urban areas.

No need for evacuation zones, can be placed near urban areas. Molten Salt Thorium reactors operate at atmospheric pressure and have a very high negative temperature coefficient, so there is no risk for a boil-over. They are easily made earthquake-safe and no pressure vessel is needed. This will greatly simplify the approval process, no need for elaborate evacuation plans have to be developed. Since the Three Mile Island accident there was a thirty year gap in approvals for new nuclear plants. The “not in my backyard ” mentality reigned supreme, and delay and denial was the rule of the years. But the lawyers still got their share, leading to escalating cost for new nuclear power. In the early days of nuclear power France took the approach of building some of their nuclear plants near the Belgian and German border, so they only had to develop half of an  evacuation plan, leaving the other half to their understanding neighbors. It also leads to placing the nuclear plants where there is the least resistance, not where they are needed the most, adding to the strain on the electric grid. Liquid Fluoride Thorium Reactors have one additional advantage. They do not need access to water, so they can be placed even in desert areas.