Vote fraud in Pa Dutch Country? You got to be kidding! A Limerick.

The vote in the land of the Dutch

had never amounted to much.

But the times sure have changed

now the votes are arranged

with more votes than sought: Fraudsters’ touch.

Before the English writer Rudyard Kipling in 1910 wrote the book “Rewards and Fairies,” he toured all over the United States. He spent time in Philadelphia and Lancaster, Pennsylvania. In “Brother Square-Toes,” a story in “Rewards and Fairies,” Kipling says this about Lancaster:

“It’s a kindly, softly country there, back of Philadelphia among the German towns, Lancaster way. Little houses and bursting big barns, fat cattle, fat women, and all as peaceful as Heaven might be if they farmed there.”

That was 1910. Lancaster Co teems with Amish and Mennonites. They stayed away from the evil ways of the English, shunned modernization, hated wars and immorality, and they didn’t vote. After Bill Clinton became President this all changed, and they started voting, pro-life.

This year there was a record participation in voting, even in Mail-in requests.

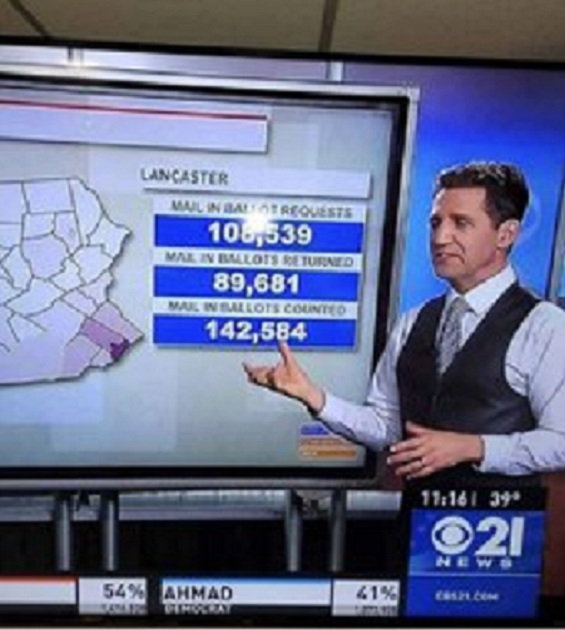
Someone took a screen-shot of the tally so far:

Mail-in ballot requests: 108,539

Ballots returned so far: 89,681

Mai-in Ballots counted so far: 142, 584.

Make of that what you will.


Voter fraud in California? Yes, millions of non-citizens with driver’s Licenses voted!

After the 2016 election Judicial Watch made an investigation of the California election. The Federal Government maintains a list of its citizens, the state governments don’t. Judicial watch made an investigation of the registered voters and found that eleven counties had more voters registered than the number of eligible voters. Here is a list of them:

County           Vote            Vote       % eligible  Clinton/
—————— Clinton      Trump   registered  Trump
Los Angeles 1,893,770    620,285   144            3.05
San Diego        567,243    386,807   138           1.47
San Francisco 312,445      34,493   114           9.06
San Mateo       192,035      47,627   111           4.03
Solano                94,622      48,712   111           1.94
Yolo                    34,460      13,178   110            2.61
Santa Cruz        85,185      20,158   109            4.23
Monterey          64,733      26,378   104            2.45
Stanislaus         73,939      72,960   102            1.01
Imperial            23,887        9,318   102            2.56
Lassen                 2,224        7,574   102            0.29
11 Co. Total  3,344,543  1,287,490                    2.60

Rest of Calif 2,514,062   1,391,229                   1.81
All Calif.       5,858,605  2,678,719                    2.19

This compilation is remarkable in so many ways.

California has 3.4 million resident aliens (green card holders and special visas). They are not eligible to vote. They also have about 3 million illegal aliens (obviously not eligible to vote)

California has motor voter registration. They issue driver’s licenses to, not only resident aliens but also to illegal aliens. All they have to do to be registered to vote is to check a box indicating they are eligible. No check for its validity is performed.

Los Angeles County is the capital of illegal aliens, so it comes as no surprise that since they now have driver’s licenses and thereby by extension are made eligible to vote, the ratio of 1.44 between registered voters and lawfully eligible voters comes as no surprise.

Silicon valley has more resident aliens than other areas of California, so it is no surprise they have registered voters exceeding eligible voters.

There is one small county located way up in North East California, Lassen County which voted heavily for Trump. It has only two major employers, two state prisons and one federal prison. Could Lassen County have registered ineligible felons?

This calls for a thorough investigation if the integrity of voting means anything.

The link to the letter from Judicial watch to CA, http://www.judicialwatch.org/document-archive/nvra-letter-ca-august-2017/

As far as I know nothing was done to remedy the situation.

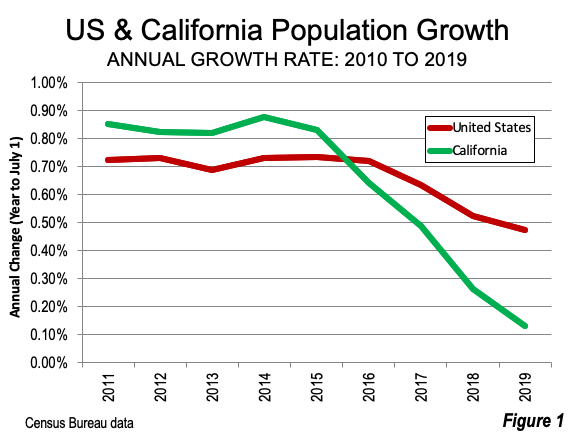
California is no longer a growing state. The population may even be declining in 2020. See this chart:

So we would then expect the numbers for the 2020 election to be about the same

County 2020 Vote   020 Vote Increase  Increase
—————— Biden      Trump       Biden     Trump

Los Angeles 2,609,329  984,383   37.8%       58.7%
San Diego        933,468  577,573   64.6%       49.3%
San Francisco 373,186   55,347    19.4%       60.5%
San Mateo       225,185    54,456    17.2%       14.3%
Solano              124,752    65,558    31,8%       34.6%
Yolo                    47,504     16,128    36,7%       22,4%
Santa Cruz       109,745    25,485    28.8%       26.4%

Monterey           93,874   34,893    45.0%         32.3%

Stanislaus          84,668    79,622   16.1%           8.1%
Imperial             34,430    20,577    44.1%      120.8%   
Lassen                   2,772      8,798    24.6%        16.2%

One more county is of interest, Orange Co. It used to be solidly Republican

2020                 792,966     655,811 Total: 1,448,777 Advantage Biden   20.9%

2016                 556,544    472,669  Total: 1,029,213 Advantage Clinton 17.8%

2012                457,077     541,092  Total:    998,169 Advantage Romney 18.4%

2008                518,925     557,370  Total: 1,076,295 Advantage McCain 7.4%


Two Statistical Curiosities That Allowed Biden To Pull Ahead In PA: A Limerick and more.

The votes that was tallied in Philly

were not added up willy-nilly.

For the fraud is state-wide

leaving no place to hide.

It’s treason; deny it is silly.

Two Statistical Curiosities That Allowed Biden To Pull Ahead In PA:

A brief note. I’ve been asked to examine the Pennsylvania votes. That work is ongoing. Update See below for a serious critique of Benford’s law.

I’m showing here (with permission) the one analysis I found most curious.

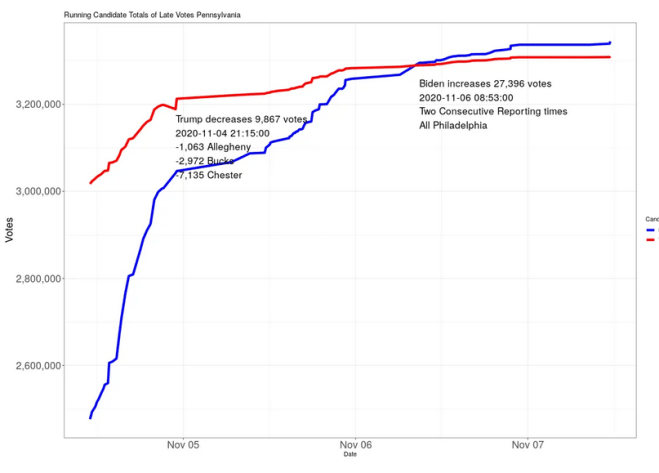
This is official county-level timed voting data that started at 2020-11-04 11:00:00, a day after the election, to 2020-11-07 11:29:00 which is Saturday night. That is, these are all late vote counts. They start, county by county, where the vote left off on election night.

This is a picture of the running totals by the time the votes were added, summed across all counties, during those time periods. They do not start at 0, but at the totals given after election night.

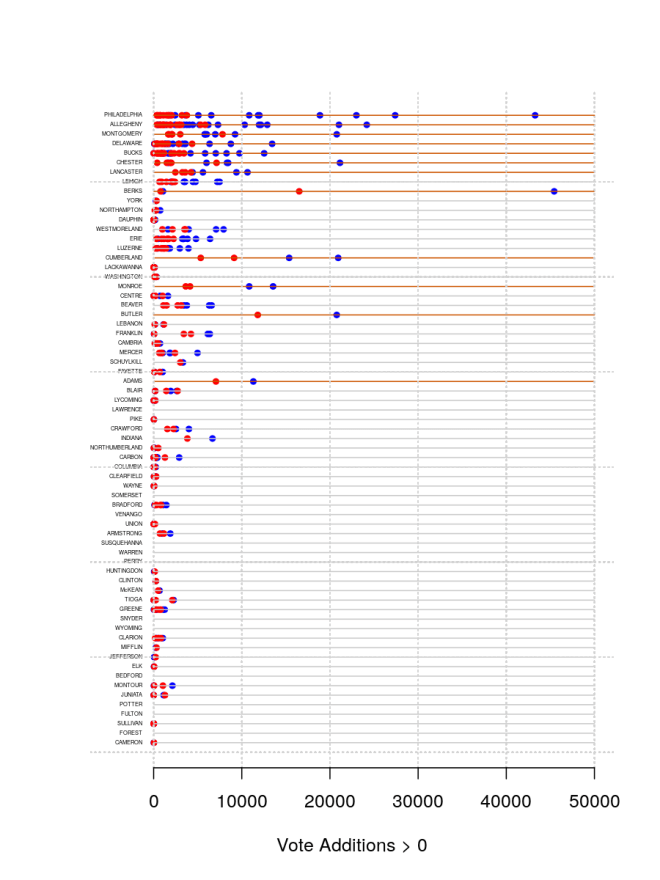
The early gains for Biden are from, mainly, Philadelphia, Allegheny, Montgomery, Chester and Berks counties. A simple plot

shows the size of vote additions for both candidates, when new vote totals (greater than 0) were added by county (and not all counties added votes after election day).

All goes well for Trump until 2020-11-04 21:15:00 when he loses just under 10,000 votes, but curiously from three different counties simultaneously: -1,063 Allegheny; -2,972 Bucks; -7,135 Chester. Biden never lost any votes (at least, in this late voting).

Understand that this does not mean the decreases happened at this time, but that they were recorded in the official data as happening at that time. And the same is true for our next observation.

Biden’s next curiosity was the big increase of 27,396 votes at 2020-11-06 08:53:00 over one consecutive reporting period. This bump is just like the blue-red F-memes you have seen: this only seems more spread out because of the finer time scale used.

These two curiosities account for a 37,263 vote swing for Biden. Biden’s total, as of the end of this data, was 3,344,528, and Trump’s 3,310,326. Biden therefore “won”, in this dataset anyway, by 34,202 votes.

Biden could not have pulled ahead without the curiosities noted above.

There is more to come. Stick around.

Update Benford’s law is only useful in uncovering multiple and on-going instances of cheating. As in somebody consistently cooking financial books. As I showed above, assuming the curiosities are cheats, it only took two instances to tip the balance. Benford’s law will never pick this up: never.

I’m skeptical of what I’m seeing in other analyses, because if somebody turns something up with Benford, it implies that many, many vote totals were tampered with, which increases the possibilities of getting caught. And you don’t need to tamper with many. Only a few.


Benford’s law and the 2020 election. A Limerick on fraud.

Elections and fraud in this nation

cannot stand a close observation.

Zero Trump votes are added

but Joe Biden’s are padded

an act of the left’s desperation

This is a map of the extent to which Dominion voting machines software is presently used. When votes are tallied it produces results that are not credible according to statistical science.

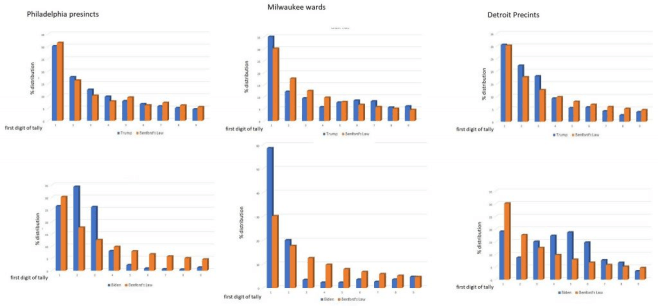
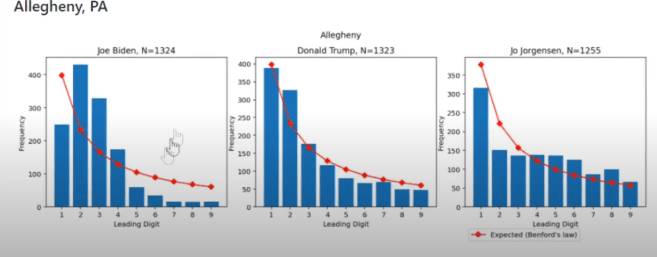
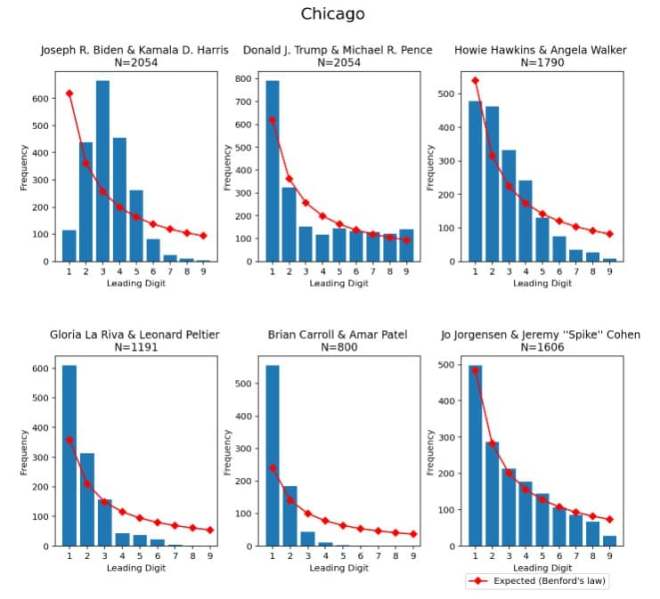
Joe Biden’s votes violate Benford’s Law, President Trump’s do not.

Benford’s law or the first-digit law, is used to check if a set of numbers are naturally occurring or manually fabricated. It has been applied to detect the voting frauds in Iranian 2009 election and various other applications including forensic investigations.

Benford’s Law, also called the Newcomb–Benford law, the law of anomalous numbers, or the first-digit law, is an observation about the frequency distribution of leading digits in many real-life sets of numerical data. The law states that in many naturally occurring collections of numbers, the leading digit is likely to be small. For example, in sets that obey the law, the number 1 appears as the leading significant digit about 30% of the time, while 9 appears as the leading significant digit less than 5% of the time. If the digits were distributed uniformly, they would each occur about 11.1% of the time. Benford’s law also makes predictions about the distribution of second digits, third digits, digit combinations, and so on.

Plots of the first digits of counts in various precincts and wards for selected counties/cities.

This is Pittsburgh.

But even cities where we know the outcome, the numbers have been manipulated such as

When this fraud is corrected the electoral map will look quite different, and may even swing a few house and senate votes.

Melania voted in person in Palm Beach. A message on her dress?

Melania did vote in Palm Beach

in person with fraud out of reach.

With the mail not secure

we can still find a cure

and secure our right to free speech.

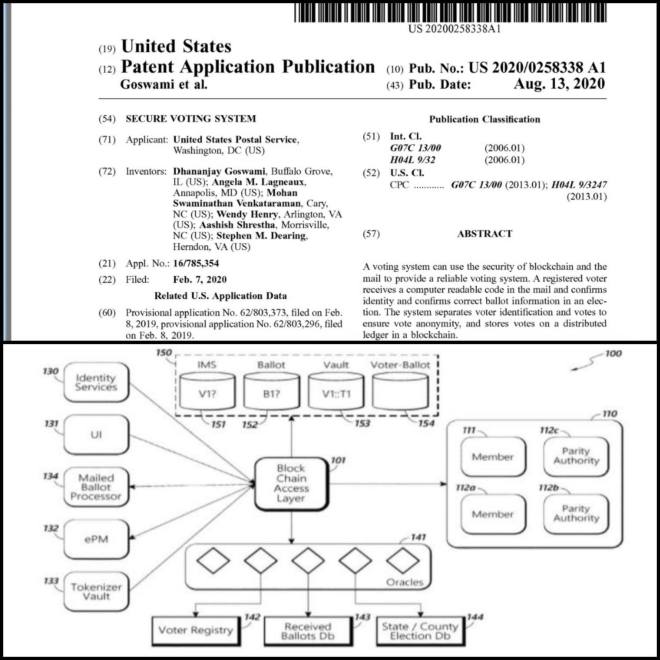
Did she secretively give a message with the pattern in her dress to promote blockchain?

Yes, there is a secure way to vote, if we will use the blockchain technology. It works for money transfers, so it should be possible to be used for the voting public. The results would be automatically collected and tabled and be available to the public within an hour of poll closings. One problem remains. It cuts out the power of corrupt politicians to manipulate the voting results, so it may never pass the different states’ legislatures. One can always hope though.

Europe and shutdowns, Sweden and “herd immunity”. The results are in on coronavirus response success

The Corona-virus pandemic has now been with us nine months and for the first time the trends ate looking better, giving us hope that the worst is over.

In the beginning the worldwide death rate was 8,65% and it is now down to 1.31%, a reduction of 84.8%. Total deaths worldwide are about 1,200,000 which is still less then the annual TB deaths that amount to 1.6 million, of which 300,000 are HIV positive.

The corresponding numbers for U.S.A :  7.02%  death rate at the beginning of the disease. It is now down to 1.04%, an 85.2% decrease. With unrestricted availability to take HCQ+ we can reduce the death rate even further.

Now it is getting interesting. While nearly all industrialized nations shut down their non-essential functions, such as schools, elective surgery, elective medical diagnostics, non food stores, flights, travel, restaurants, non essential government services and the like Sweden took a different approach. They kept their elementary schools open, did not close stores and restaurants, only large gatherings, mandated increased hygiene and to practice social distancing, and then they let the virus rage as a normal flu, and waited for the so called “herd immunity.” Wearing masks were never mandated, only encouraged when social distancing was impossible to maintain. Sweden did their best though to protect the vulnerable.

In the beginning the results were disastrous. The initial death rate was over 21%, it seemed  like a failed attempt, but then things started to calm down. In late spring the death rate had settled down to 9.2%, but then came a second wave of cases and everyone was bracing for the worst. But the death rate  did not rise, and is now down to 0.24%. (Oct 30)

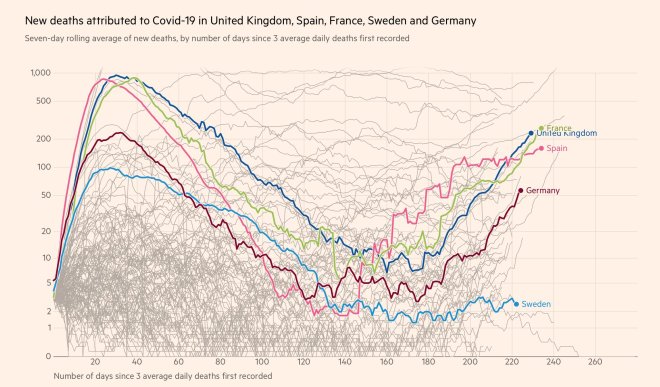
The rest of Europe (except Belarus) did try to limit the spread of the coronavirus  using heavy lockdowns. This limited the spread of the virus for a while, and through the summer it looked like it was the right thing to do, but “herd immunity was never achieved. Now, when the flu season has arrived the cases are rising again, and for the western Europe nations cases are now rising, and so are deaths. In Germany the death rate has increased 14-fold since the summer minimum, in Spain the death rate is increased 80-fold, in France the death rate is increased 30-fold.  The United Kingdom death rate is increased 35-fold and the kingdom is ready to issue another draconian lockdown, other countries are also issuing curfews and other restrictions.

The virus will run its course until herd immunity is achieved. Vaccines will finally limit the pandemic. Thanks to President Trump’s “warp speed” initiative, paying private enterprise to produce the vaccine at the same time level 3 testing is underway so the vaccine is available as soon as it is approved, vaccines will be available weeks from now rather than years from now.

This is expensive, but if any of the 6 vaccines succeed, it was worth it, if all fails we are no worse off than if we wreck the economy with another lockdown that only delays the inevitable, herd immunity achieved years from now with more deaths than if we had followed the example of Sweden.

Climate change and the Paris climate agreement. A Limerick.

Re-enter the Paris accord?

A folly we ill can afford.

We’ll help China pollute,

they won’t still give a hoot.

Re-sign is a Damocles sword.

I am a climate realist, that means I look at the totality of what is happening to the climate with increasing CO2 levels, and what it means for our future.

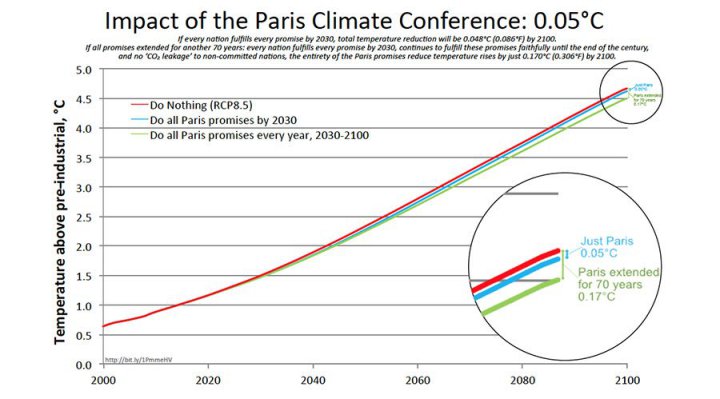
Climate alarmists and IPCC believe that the thermal response to increasing CO2 is a feedback gain from increasing water vapor that results from higher temperatures, leading to much higher temperatures. Current climate model averages indicate a temperature rise of 4.7 C by 2100 if nothing is done, 4.65 C if U.S keeps all its Paris commitments and 4.53 C if all countries keep their part of the agreement. In all cases, with or without Paris agreement we are headed for a disaster of biblical proportions.

As the chart indicates, implementing all of the Paris agreement will delay the end of mankind as we know it by at most 4 years.

The cost is staggering. The developing countries want at least 100 billion dollars a year to implement the Paris accord, all paid for by the developed countries. The most infuriating thing about that is that China is considered a developing country, and being a developed country The U.S., while reducing their CO2 footprint will be paying China until the year 2030 to further develop their coal burning electric plants until the China CO2 output is six times our output. They had plans to add 65 GW  (+6.5%) of coal-burning power plants this year alone to their grid. The china-virus delayed that by a few months, but their intent is still to dominate the world by 2025. They already consume 48% of the world’s output of coal, produce over half of the world’s steel and cement (it takes a lot of reinforced concrete to create multiple islands in the South China Sea).

clip_image004


Myself and quite a few scientists, meteorologists, but mostly engineers believe the feedback loop in nature is far more complicated than what the climate models suggest, in fact, there is a large negative feedback in the system, preventing a temperature runaway, and we have the observations to prove it.  The negative feedback manifests itself in 2 ways:

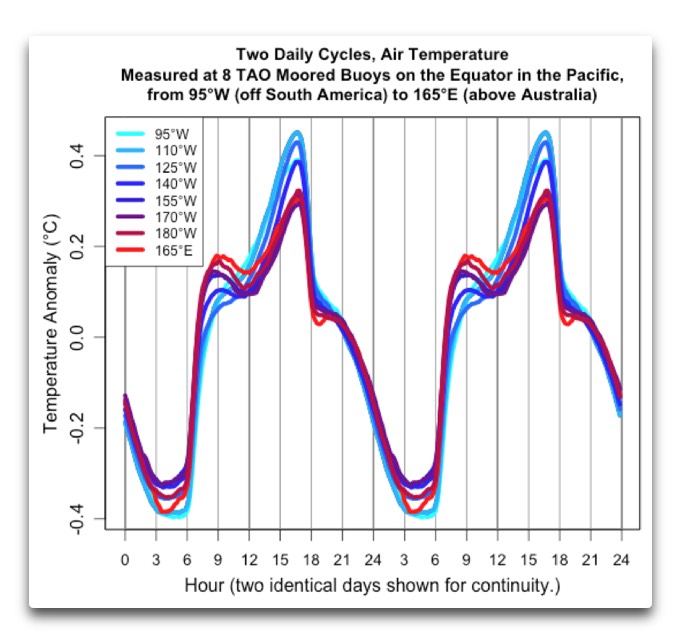
Inorganic feedback, represented by clouds. If there were no clouds, the tropics would average a temperature of  140 F  thanks to the greenhouse effect. The clouds reflect back up to 300 W/m2 into space rather than the same energy being absorbed into water or soil. Clouds are highly temperature dependent, especially cumulus and cumulonimbus clouds. The figure below shows temperature at the equator in the Pacific Ocean.

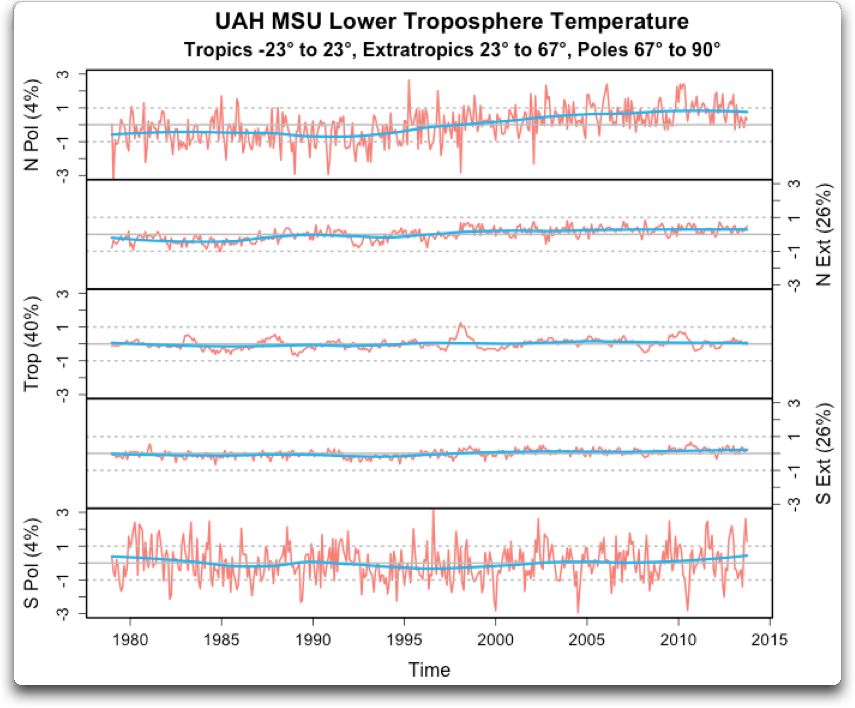
Cumulus clouds are formed in the morning, earlier the warmer it is, and not at all if it is cold, thunderstorms appear when it is warm enough. The figure shows how temperature in the equatorial Pacific rises until about 8:30 a.m, then actually declines between 9 and 12 a.m. even as the sun continues to rise. The feedback, which was positive at low temperatures becomes negative at warmer temperatures, and in the equatorial doldrums, surface temperature has found its equilibrium. No amount of CO2 will change that. Equatorial temperature follows the temperature of the ocean, warmer when there is an el niño, cooler when there is a la niña. Here is a chart of temperature increases since satellite measurements began as a function of latitude.

The tropics follow the ocean temperature closely, no long term rising trend, the extra-tropics are also stable.

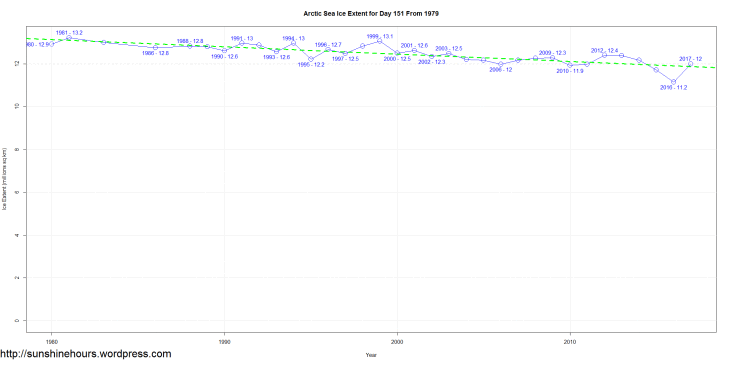
Not so at the poles. the temperature record indicate a noticeable warming with large spikes up and down, up to 3 degree Celsius difference from year to year, especially the Arctic. So, how much has the Arctic melted? Here is a chart of Arctic ice cover for 31 May for the last 39 years.

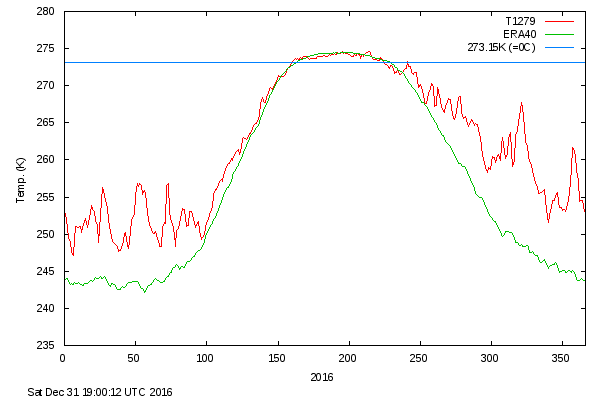
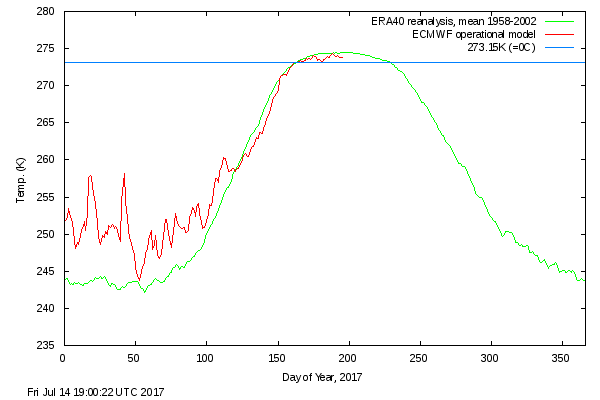
If this trend continues, all ice may melt in 300 to 400 years, faster if there is further warming and nothing else is changing. Let’s take a look at the Arctic above the 80th latitude, an area of about 3,85 million square kilometers, less than 1% of the earth’s surface, but it is there where global warming is most pronounced. Here are two charts from 2016 and 2017.

meanT_2017

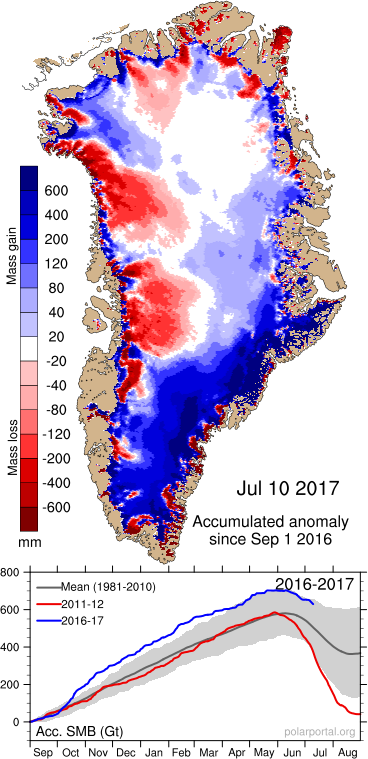
Starting at summer 2016, the Arctic was melting quite normally, but something else happened that is not shown in the chart. Every 5 years or so, the Arctic suffer a large storm with full hurricane strength during the summer. In 2016 there was no one, but two such storms, and as they happened late in the season when the ice is rotten they result in a large ice loss, making the ice minimum the lowest on record, and the ice volume nearly 4,000 Gigatons (Gt) less than the 30 year normal. Then the temperature from October thru April did run 7 degree Celsius warmer than normal with a spike as high as 20 degrees warmer. Yet today the deficit is down to 2,500 Gt. What happened? It snowed more than normal. In the Arctic, it gets warmer under clouds, warmer still when it snows. Take a look at Greenland and what happened during the freezing season. It snowed and snowed and Greenland accumulated 150 Gt more ice than normal. So, at that point in the season we were a total of 1650 Gt ahead of previous year, and this was with Arctic temperatures being seven degrees warmer than normal during the cold season. The counter-intuitive conclusion is that it may very well be that warmer temperatures produces accumulation of snow and ice, colder temperatures with less snow accumulates less. What happens during the short Arctic summer? With more snow accumulated it takes longer to melt prevous year’s snow, so the temperature stays colder longer. In 2017 the Arctic temperature was running colder than normal every day since May 1. If this melting period ended without melting all snow, multi year ice will accumulate, and if it continued unabated, a new ice age would start.


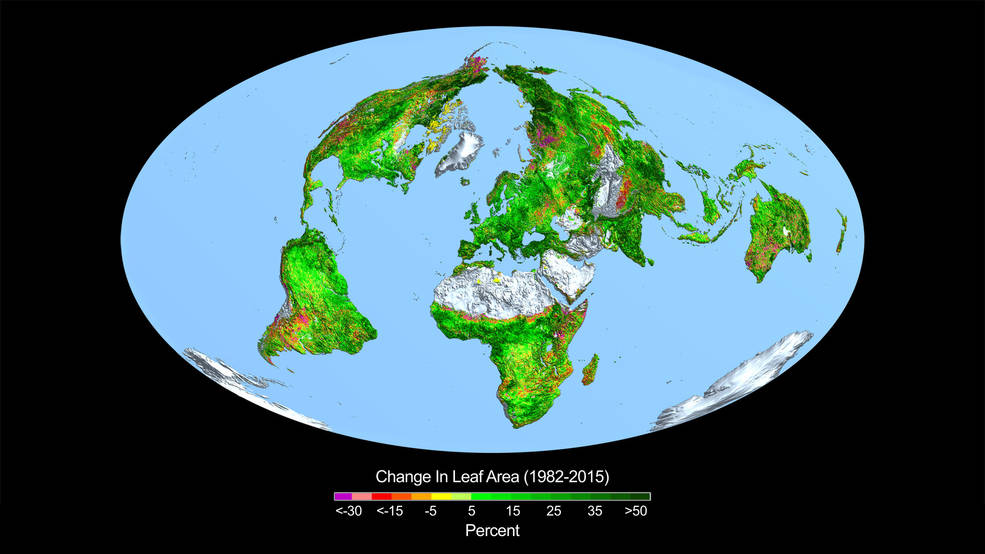
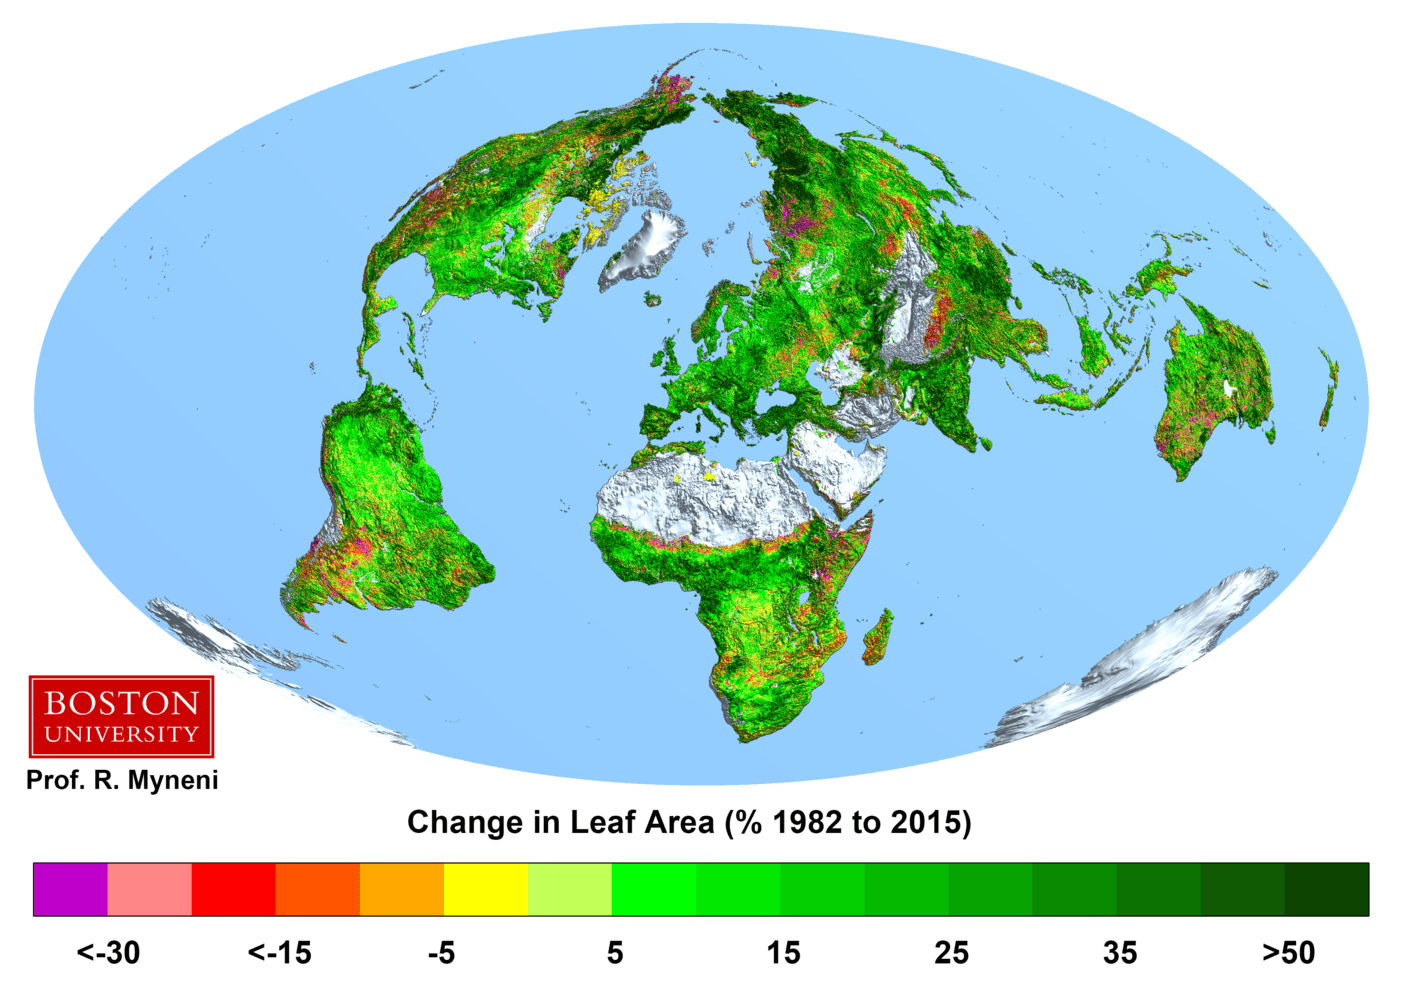
The second feedback loop is organic. More CO2 means more plant growth.  According to NASA there has been a significant greening of the earth, more than 10% since satellite measurements begun. This results in a cooling effect everywhere, except in areas that used to be treeless where they have a warming effect. The net effect is that we can now feed 2 billion more people than before without using more fertilizer. Check this picture from NASA, (now they can publish real science again) showing the increased leaf area extends nearly everywhere.

In addition, more leafs changes the water cycle, increases evapotranspiration, and more trees and vegetation reduces erosion and unwanted runoff. Good news all around.

In short, taking into account the negative feedback occurring the earth will warm up less than 0.5 degrees from now, not at all in the tropics, and less than 3 degrees at the poles. Without the Paris agreement there will be no increase in the death rates in the cities, except from the slight increase of city temperatures due to the urban heat effect. With the Paris agreement we will have to make draconian cuts in our use of electricity, meaning using much less air conditioning and even less heating, and life expectancy will decline.

We need energy. It takes a lot of energy to clean up the planet. Developing nations should be encouraged to use electricity rather than cooking by dried cow-dung. Coal is limited, and we should leave some for our great great grandchildren. Oil and gas should be preserved for aviation, since there is no realistic alternative with a high enough energy density. Therefore I am an advocate for Thorium based nuclear energy, being safer than Uranium based nuclear energy, and, properly implemented will produce about 0.01% of the long term radioactive waste compared to conventional nuclear power plants. And there is a million year supply  of Thorium available. Once the electricity power plants have fully switched away from coal and gas, then and only then is it time to switch to electric cars. The case for Thorium generated electric energy can be found here.

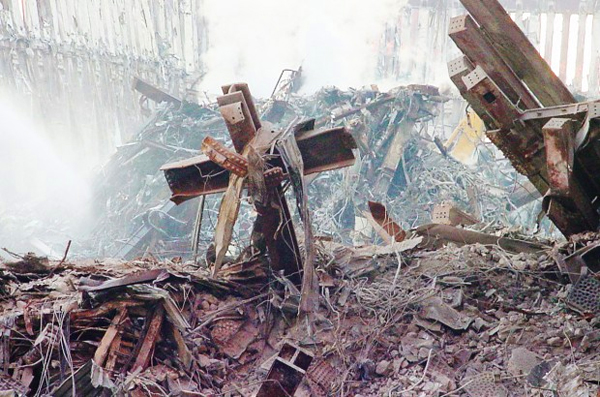
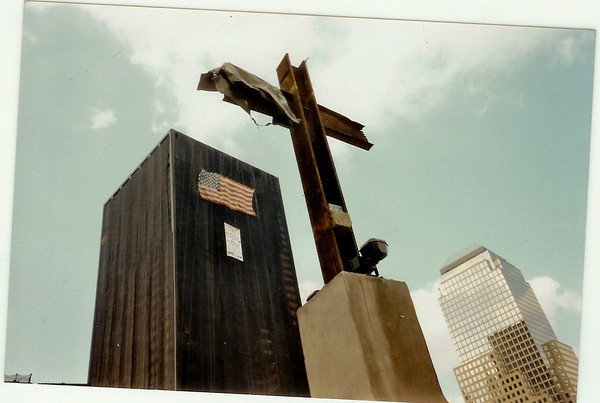
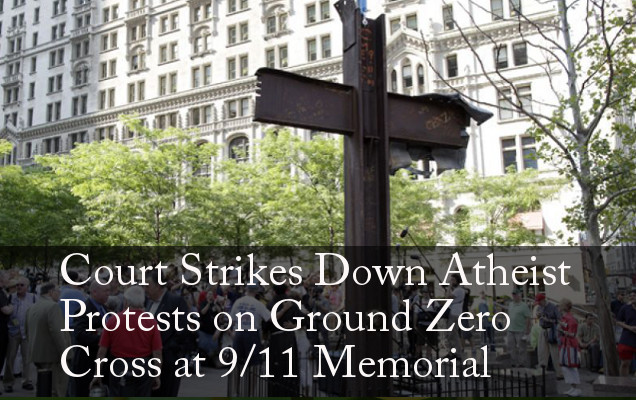
On this September 11, let us remember the cross at Calvary, the cross ar Ground Zero, and the cross standing in Notre Dame cathedral. Two Limericks

The fool hath said in his heart, There is no God” (Psalm 14:1)

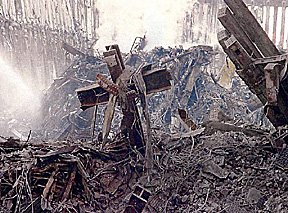
https://lenbilen.com/wp-content/uploads/2015/08/ground_zero_cross.jpg

The original location where the iron cross was found.

For Muslims, atheists and humanists the cross is an offense since it is to them the stench of death. But to us who believe it is the symbol of redemption and new and eternal life in Christ. If they were not pricked in their hearts when they see the cross they would not be offended.

He died  on the cross at Ground Zero.

We have only one risen hero.

But the fools reject grace,

stay condemned, cannot face

The truth in The Cross at Ground Zero.

 For God so loved the world, that he gave his only begotten Son, that whosoever believeth in him should not perish, but have everlasting life.  For God sent not his Son into the world to condemn the world; but that the world through him might be saved. (St. John 3:16-17)

https://lenbilen.com/wp-content/uploads/2012/01/iron-cross.jpg

An intermediate location for the cross

https://lenbilen.com/wp-content/uploads/2015/08/cross.jpg

The final place for the Iron cross near the 9/11 museum.

These were the final words of Governor Sarah Palin after a successful week anchoring “On Point” with the One America News.

Governor Palin is a true servant. Her parents, Chuck and Sally Heath, worked at the Fresh Kills landfill in Staten Island, New York in January and February 2002 as part of a federal Department of Agriculture program.

In a telephone interview, Mr. Heath said he and his wife had worked to keep sea gulls and rats from scavenging the human remains in the debris. Mr. Heath, then 70, a retired science teacher, and Mrs. Heath, then 68, a retired secretary, had worked for the Agriculture Department for 15 years. They travel around the world dealing with “nuisance” animals like rats and bears.

“A lot of people just didn’t like the job, it was kind of a morbid thing,” he said of the work at the landfill. “But I thought it was part of history.”

This is the attitude of a servant.

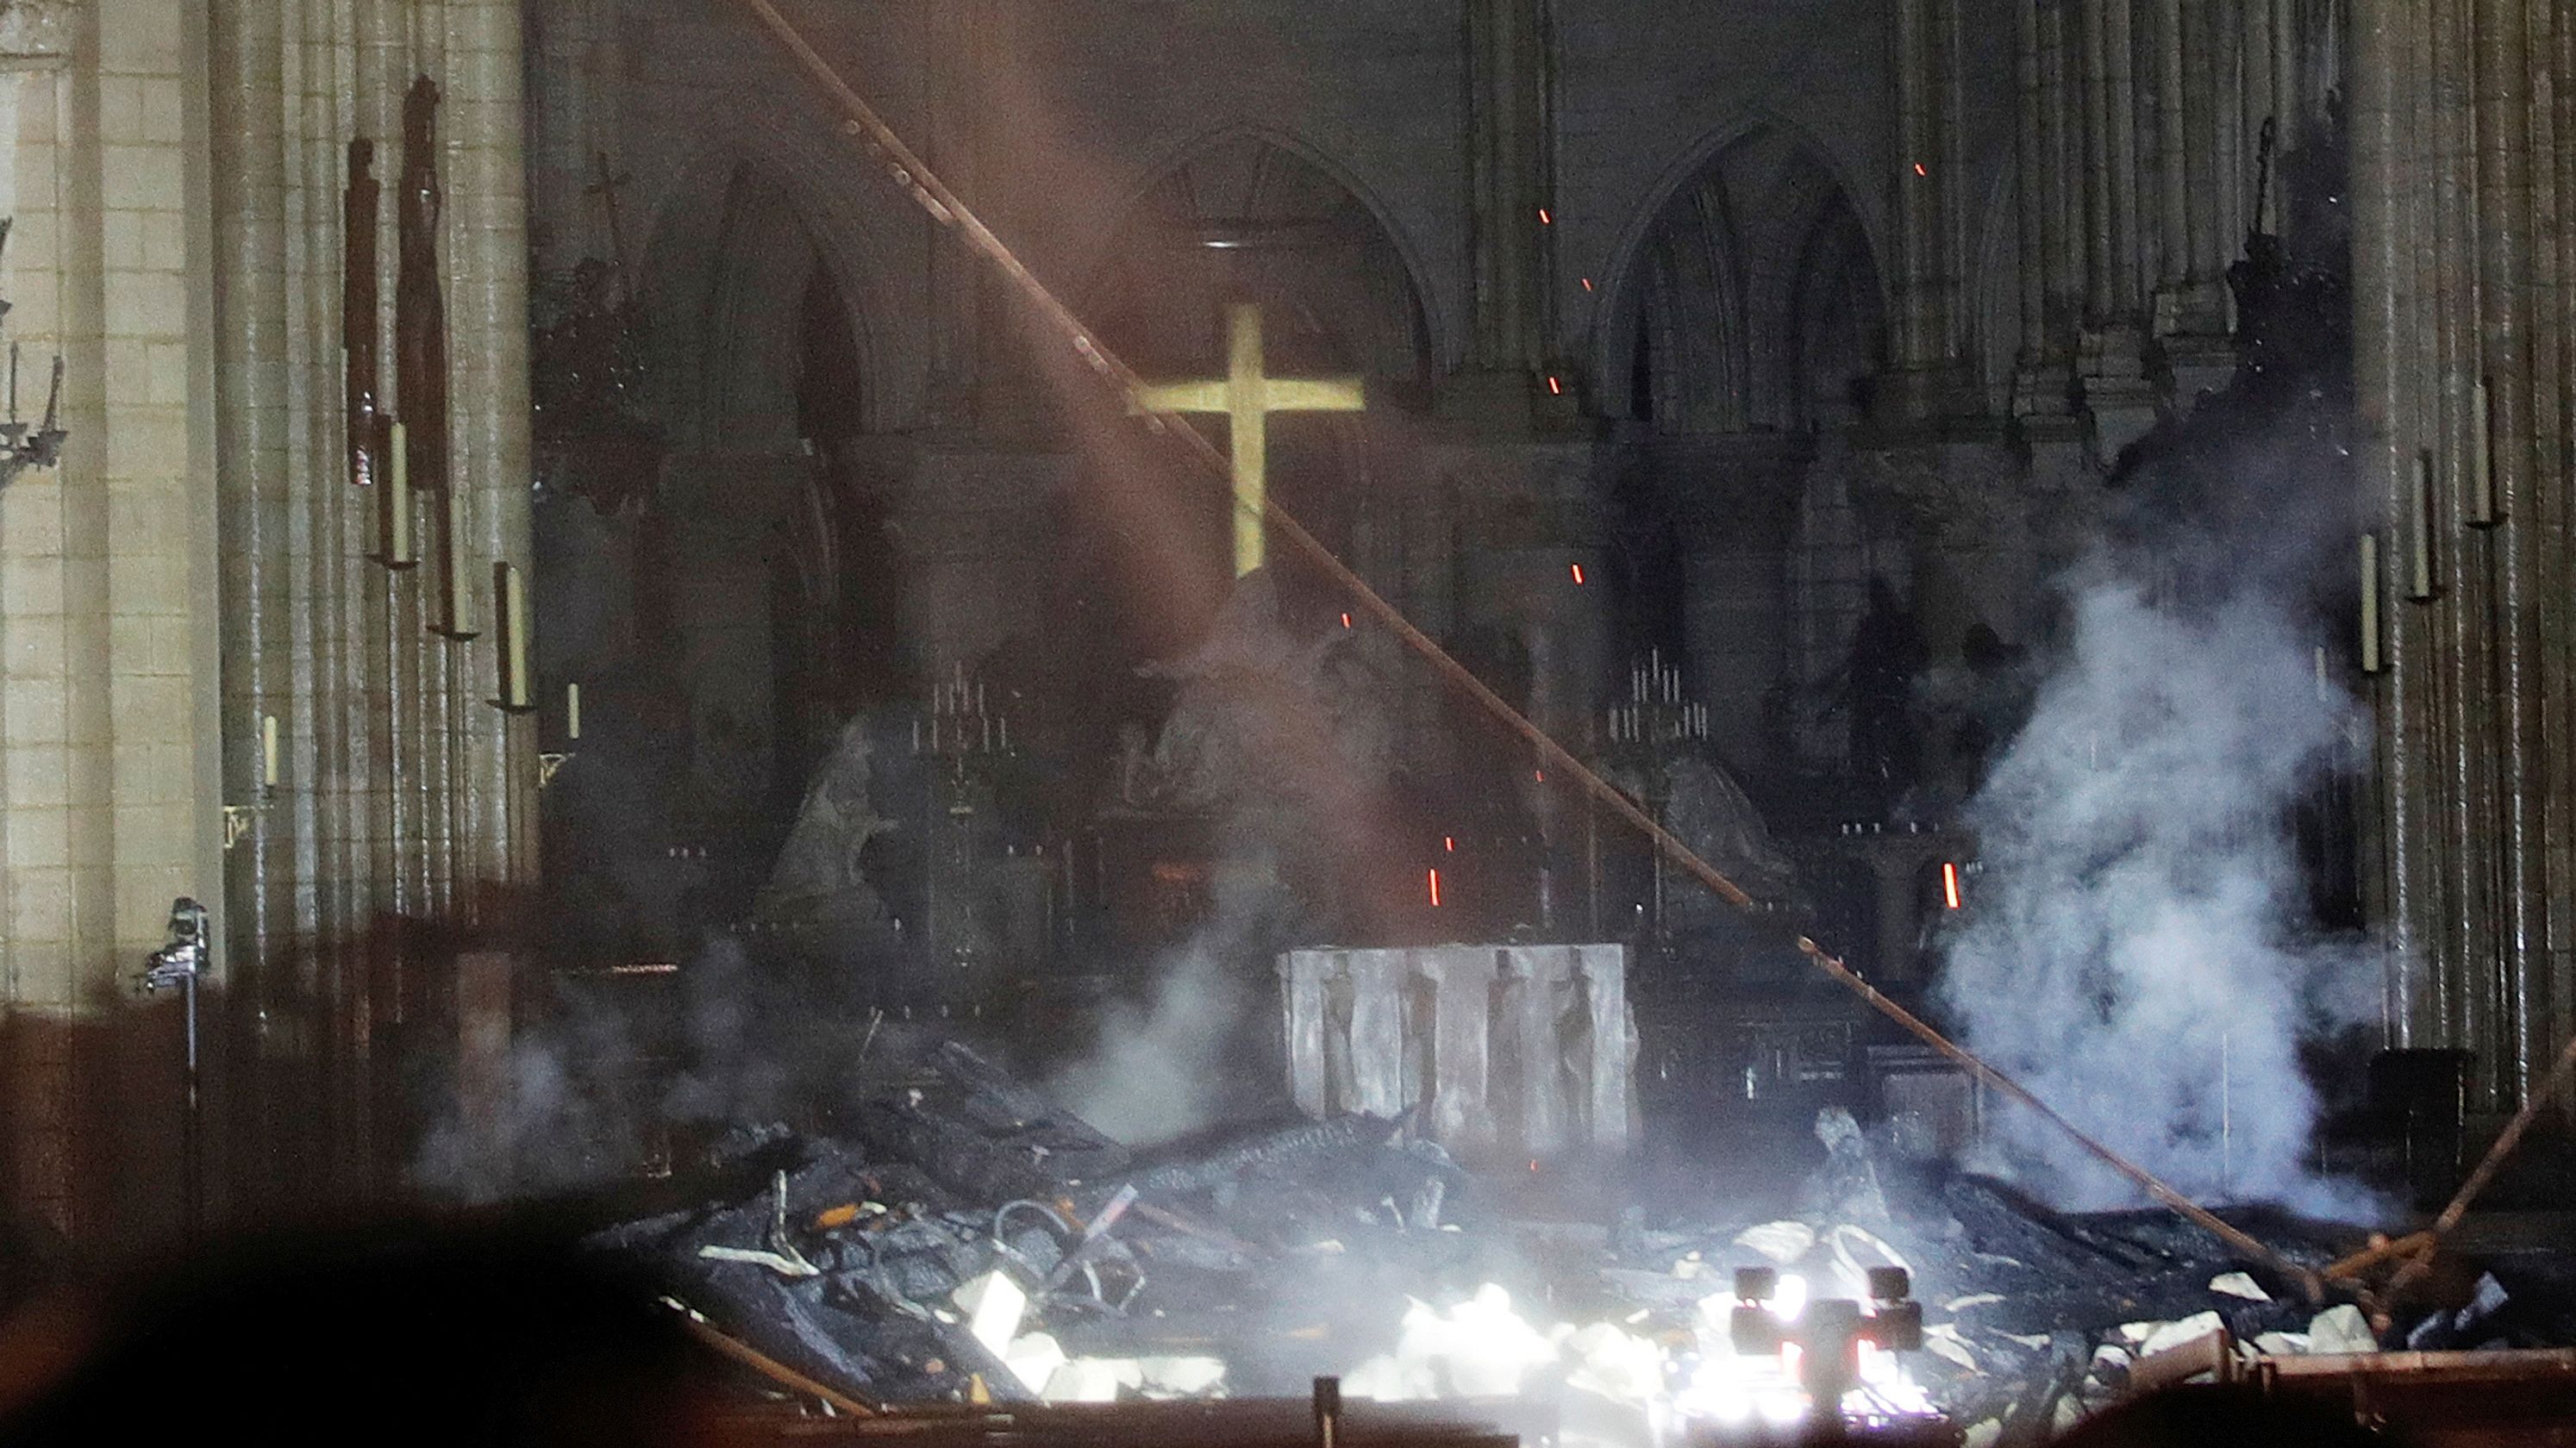
On April 16 2019 at the church of Notre Dame in Paris there was a fire. Much was lost.

“Art and architecture have a unique ability to help us connect across our differences and bring people together in important ways,” posted U.S. Rep. Ilhan Omar. “Thinking of the people of Paris and praying for every first responder trying to save this wonder.”

No, Ms Omar, it is much more than that, rather

What nearly destroyed Notre Dame;

historical artworks for some.

Not the fall of the steeple,

God’s church is the people

the Cross stands for all who will come.

Yes, the fire was spectacular.

https://lenbilen.com/wp-content/uploads/2019/04/ap_france_notre_dame_fire.jpg

Yes, the cross still stands as it did when, as U.S. Rep Ilhan Omar so famously quoted “Somebody did something at 9/11”

“The fool hath said in his heart, There is no God” (Psalm 53:1)

CO2 concentration has increased 50% since pre-industrial times causing climate change. Thorium Nuclear Power is the answer. A Limerick.

As CO2 warms up the poles

burned oil, gas and coal play their roles.

CO2 is still good;

makes plants green, grows more food,

and clouds are the climate controls.

We live in interesting times, the CO2 concentration has increased 50% since the beginning of industrialization. In the last 30 years the level has risen 17%, from about 350 ppm to nearly 410 ppm. This is what scares people. Is is time to panic and stop carbon emissions altogether as Greta Thunberg has suggested?As if on cue the climate models have been adjusted, and they suddenly show a much higher rate of temperature increase, in this case what is supposed to happen to global temperatures for a doubling of CO2 from pre-industrial times, from 270ppm to 540ppm.
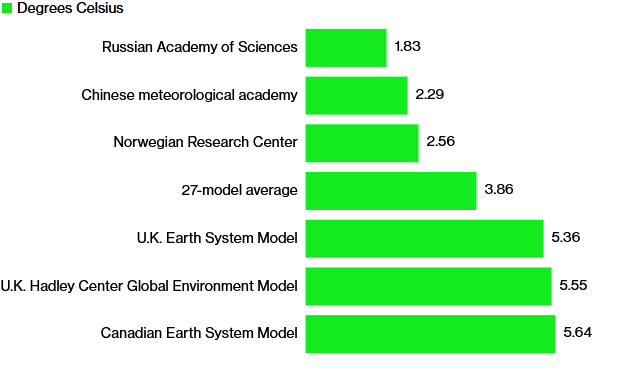

There are two ways to approach this problem. The models make certain assumptions about the behavior of the changing atmosphere and model future temperature changes. This is the approach taken by IPCC for the last 32 years. These models are all failing miserably when compared to actual temperature changes.

The other way i to observe what is actually happening to our temperature over time as the CO2 increases. We have 50 years of excellent global temperature data, so with these we can see where, when and by how much the earth has warmed.

The most drastic temperature rise on earth has been in the Arctic above the 80th latitude. In the winter of 2019 it was 4C above the 50 year average. See charts from the Danish Meteorological Institute:
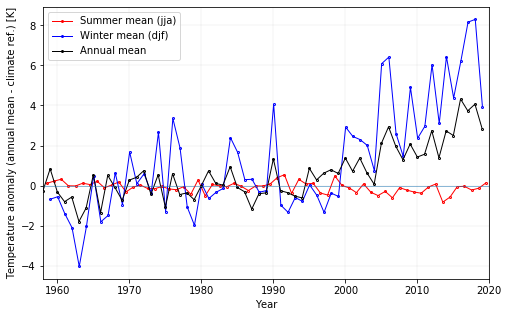
Note, there is no increase at all in the summer temperatures!
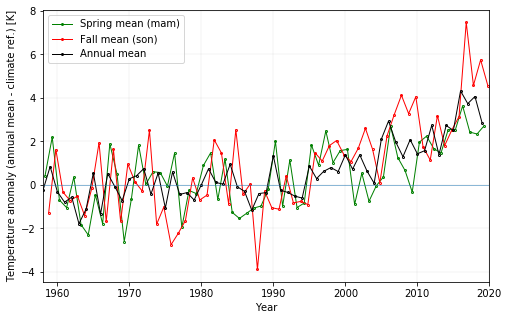
The fall temperature saw an increase of 4C and the spring temperature saw an increase of about 2.5C.
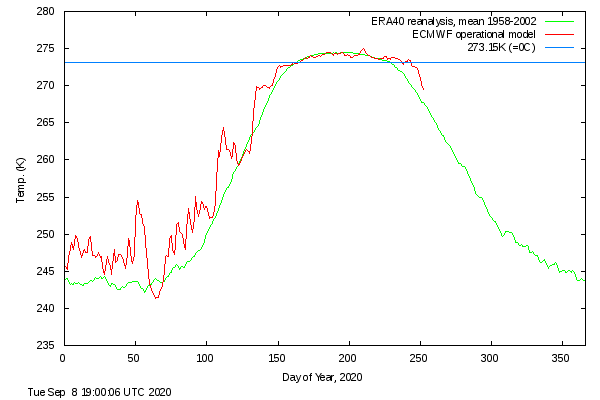
Notice: In this chart the there is no recorded summer temperature increase at all, but the onset of fall freezing was delayed by 3 weeks.

The 5 thru 8C winter rise of temperature is significant, most would even say alarming, but my response is, why is that?

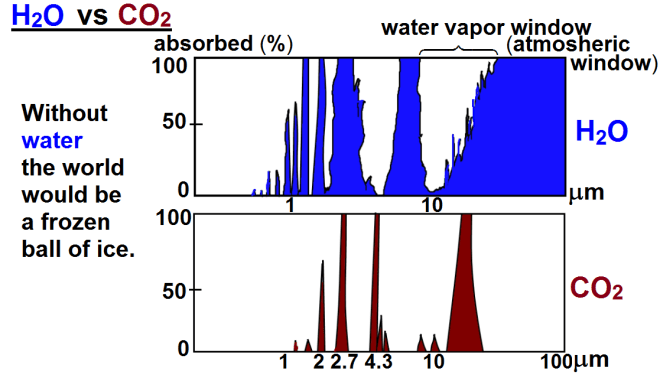
To get the answer we must study molecular absorption spectroscopy and explain a couple of facts for the 97% of all scientists who have not studied molecular spectroscopy. IPCC and most scientists claim that the greenhouse effect is dependent on the gases that are in the atmosphere, and their combined effect is additive according to a logarithmic formula. This is true up to a certain point, but it is not possible to absorb more than 100% of all the energy available in a certain frequency band! For example: If water vapor absorbs 50% of all incoming energy in a certain band, and CO2 absorbs another 90% of the energy in the same band, the result is that 95% is absorbed, (90% + 50% * (100% – 90%)),  not 140%, (90% + 50%).

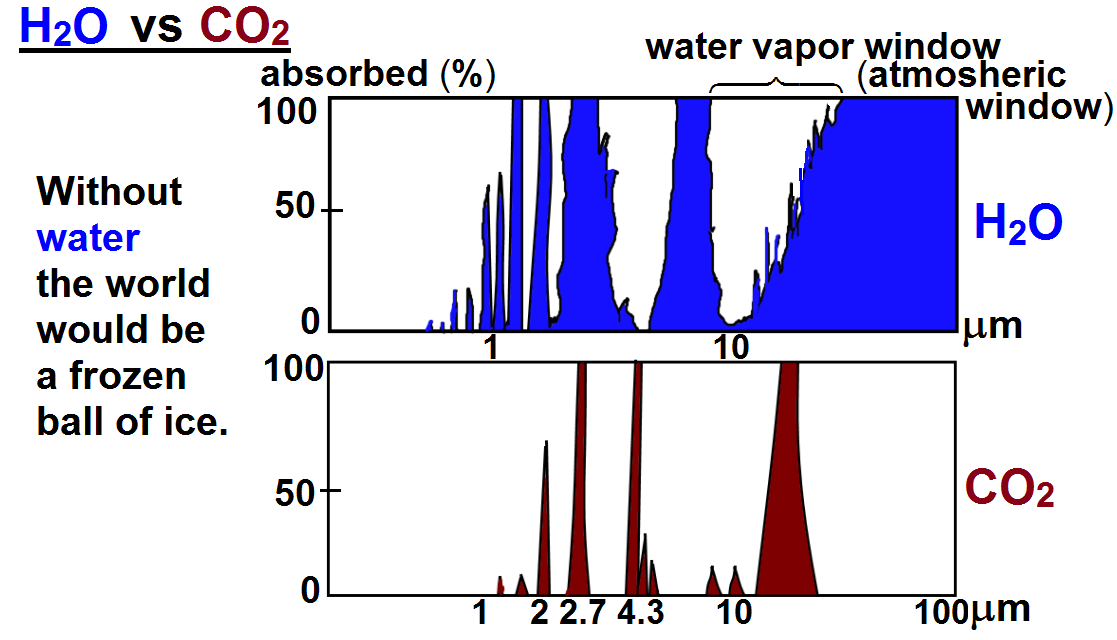
The following chart shows both CO2 and H2O are absorbing greenhouse gases, with H20 being the stronger greenhouse gas, absorbing over a much wider spectrum, and they overlap for the most part. But it also matters in what frequency range s they absorb.
For this we will have to look at the frequency ranges of the incoming solar radiation and the outgoing black body radiation of the earth. It is the latter that causes the greenhouse effect. Take a look at this chart:
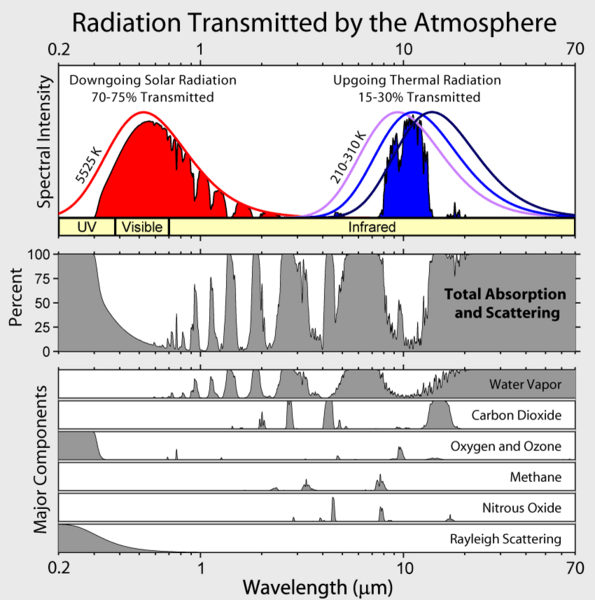
The red area represents the observed amount of solar radiation that reaches the earth’s surface, the white area under the red line represents radiation absorbed in the atmosphere. Likewise, the blue area represents the outgoing black body radiation that is re-emitted. The remaining white area under the magenta, blue or black line represents the retained absorbed energy that causes the greenhouse effect.

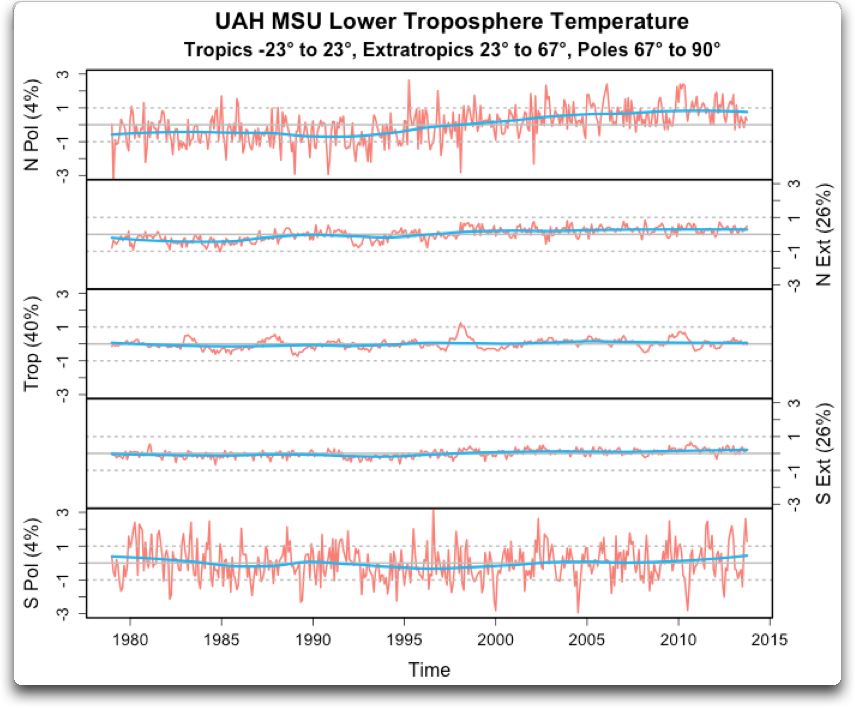
Let us  now take a look at the Carbon Dioxide bands of absorption, at 2.7, 4.3 and 15 microns. Of them the 2.7 and 4.3 micron bands absorb where there is little black body radiation, the only band that is of interest is at 15 microns, and that is in a band where the black body radiation has its maximum. However it is also in a band where water vapor also absorb, not as much as CO2,only about 20% to 70% as much. Water vapor or absolute humidity is highly dependent on the temperature of the air, so at 30C there may be 50 times as much water vapor, at 0C there may be ten times as much water vapor, and at -25C there may be more CO2 than water vapor. At those low temperatures the gases are mostly additive. In the tropics with fifty times more water vapor than CO2, increased CO2 has no influence on the temperature whatsoever. Temperature charts confirm this assertion:

Here the temperature in the tropics displays no trend whatsoever. It follows the temperature of the oceans, goes up in an El Niño and down in a La Niña. The temperature in the southern hemisphere shows no trend. In the northern temperate region there is a slight increase, but the great increase is occurring in the Arctic. There is no increase in the Antarctic yet even though the increase in CO2 is greater in the Antarctic and the winter temperature in the Antarctic is even lower than in the Arctic. So CO2 increase cannot be the sole answer to the winter temperature increase in the Arctic.

There is an obvious answer. When temperatures increase the air can contain more moisture and will transport more moisture from the tropics all the way to the arctic, where it falls as snow. Is the snow increasing in the Northern Hemisphere?

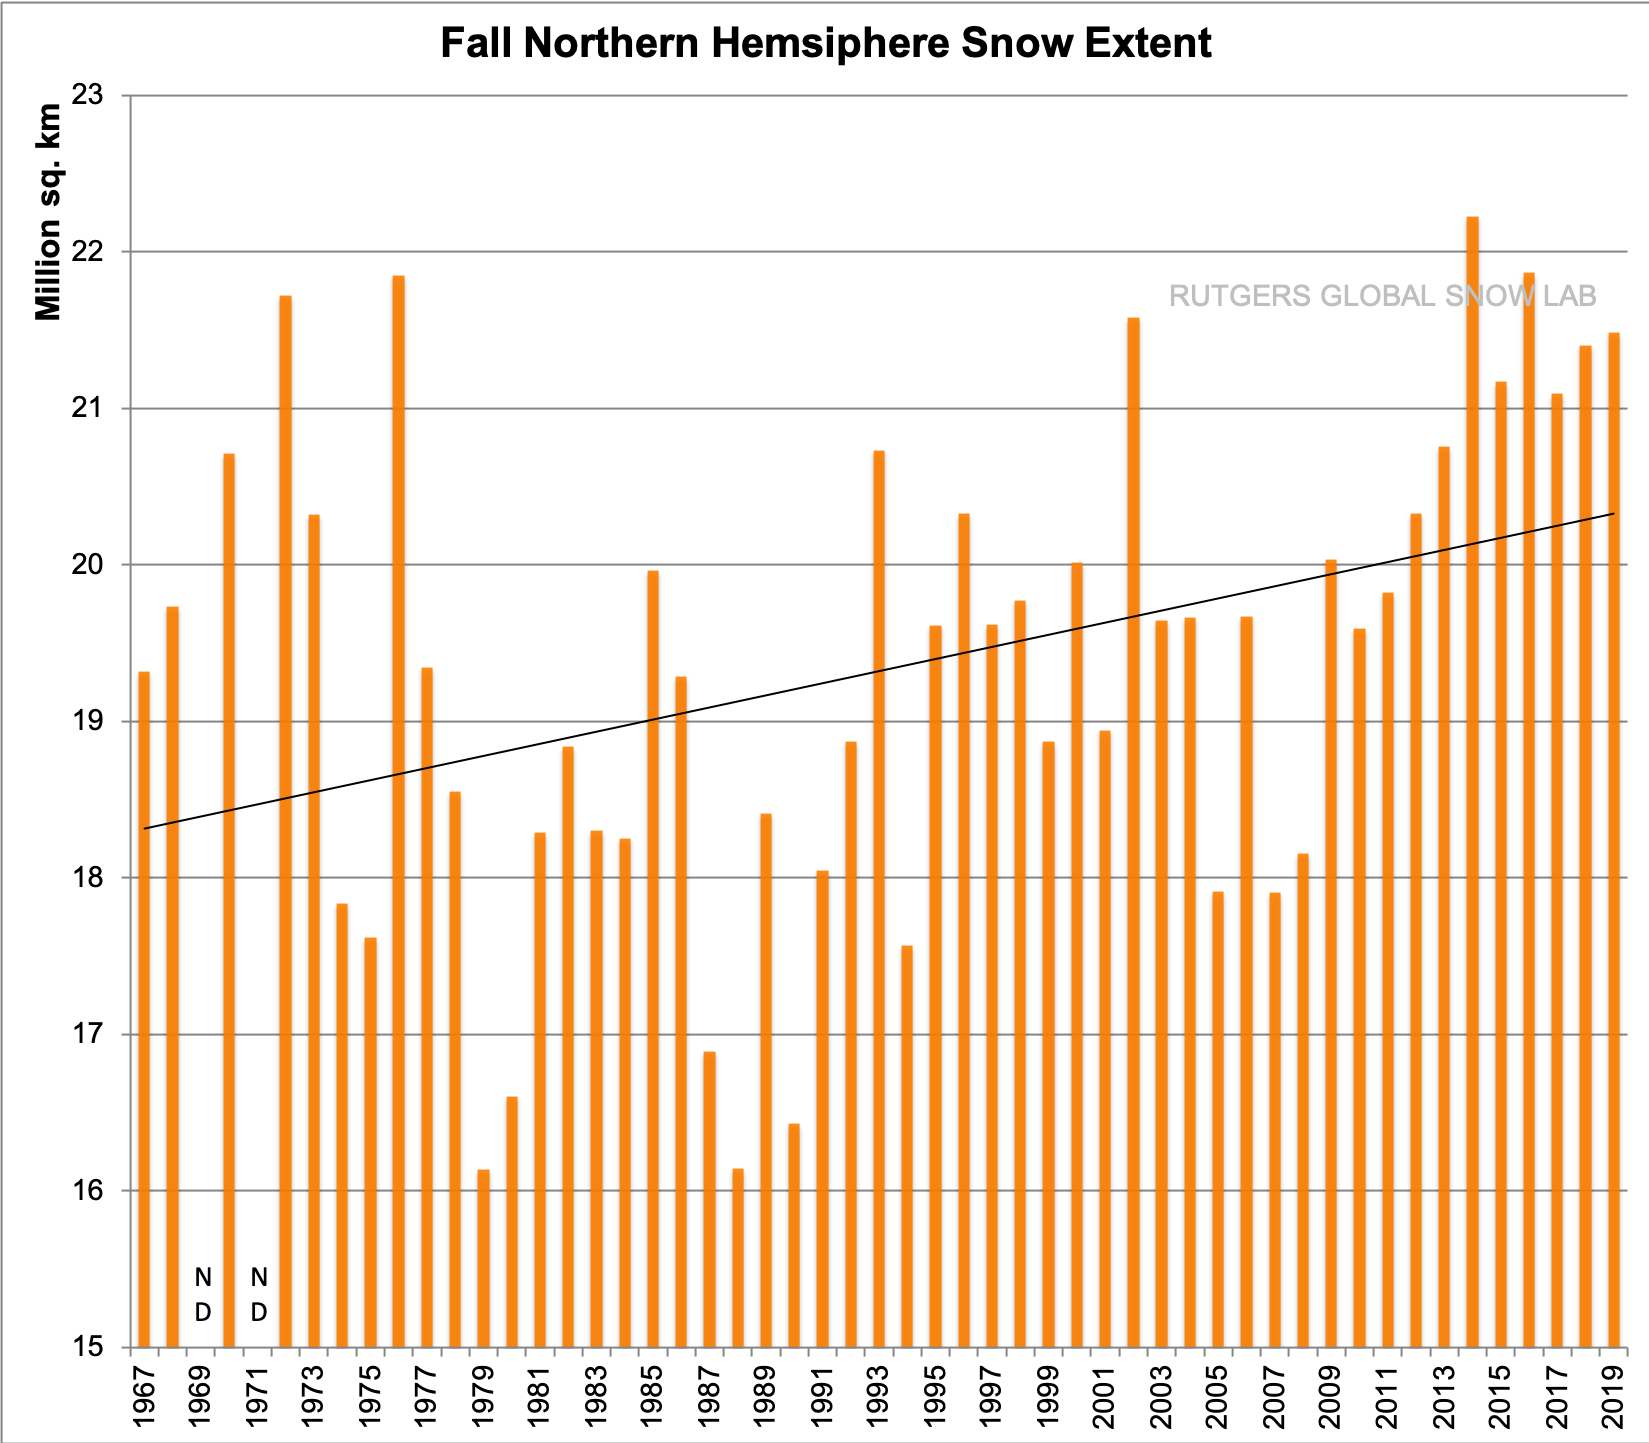
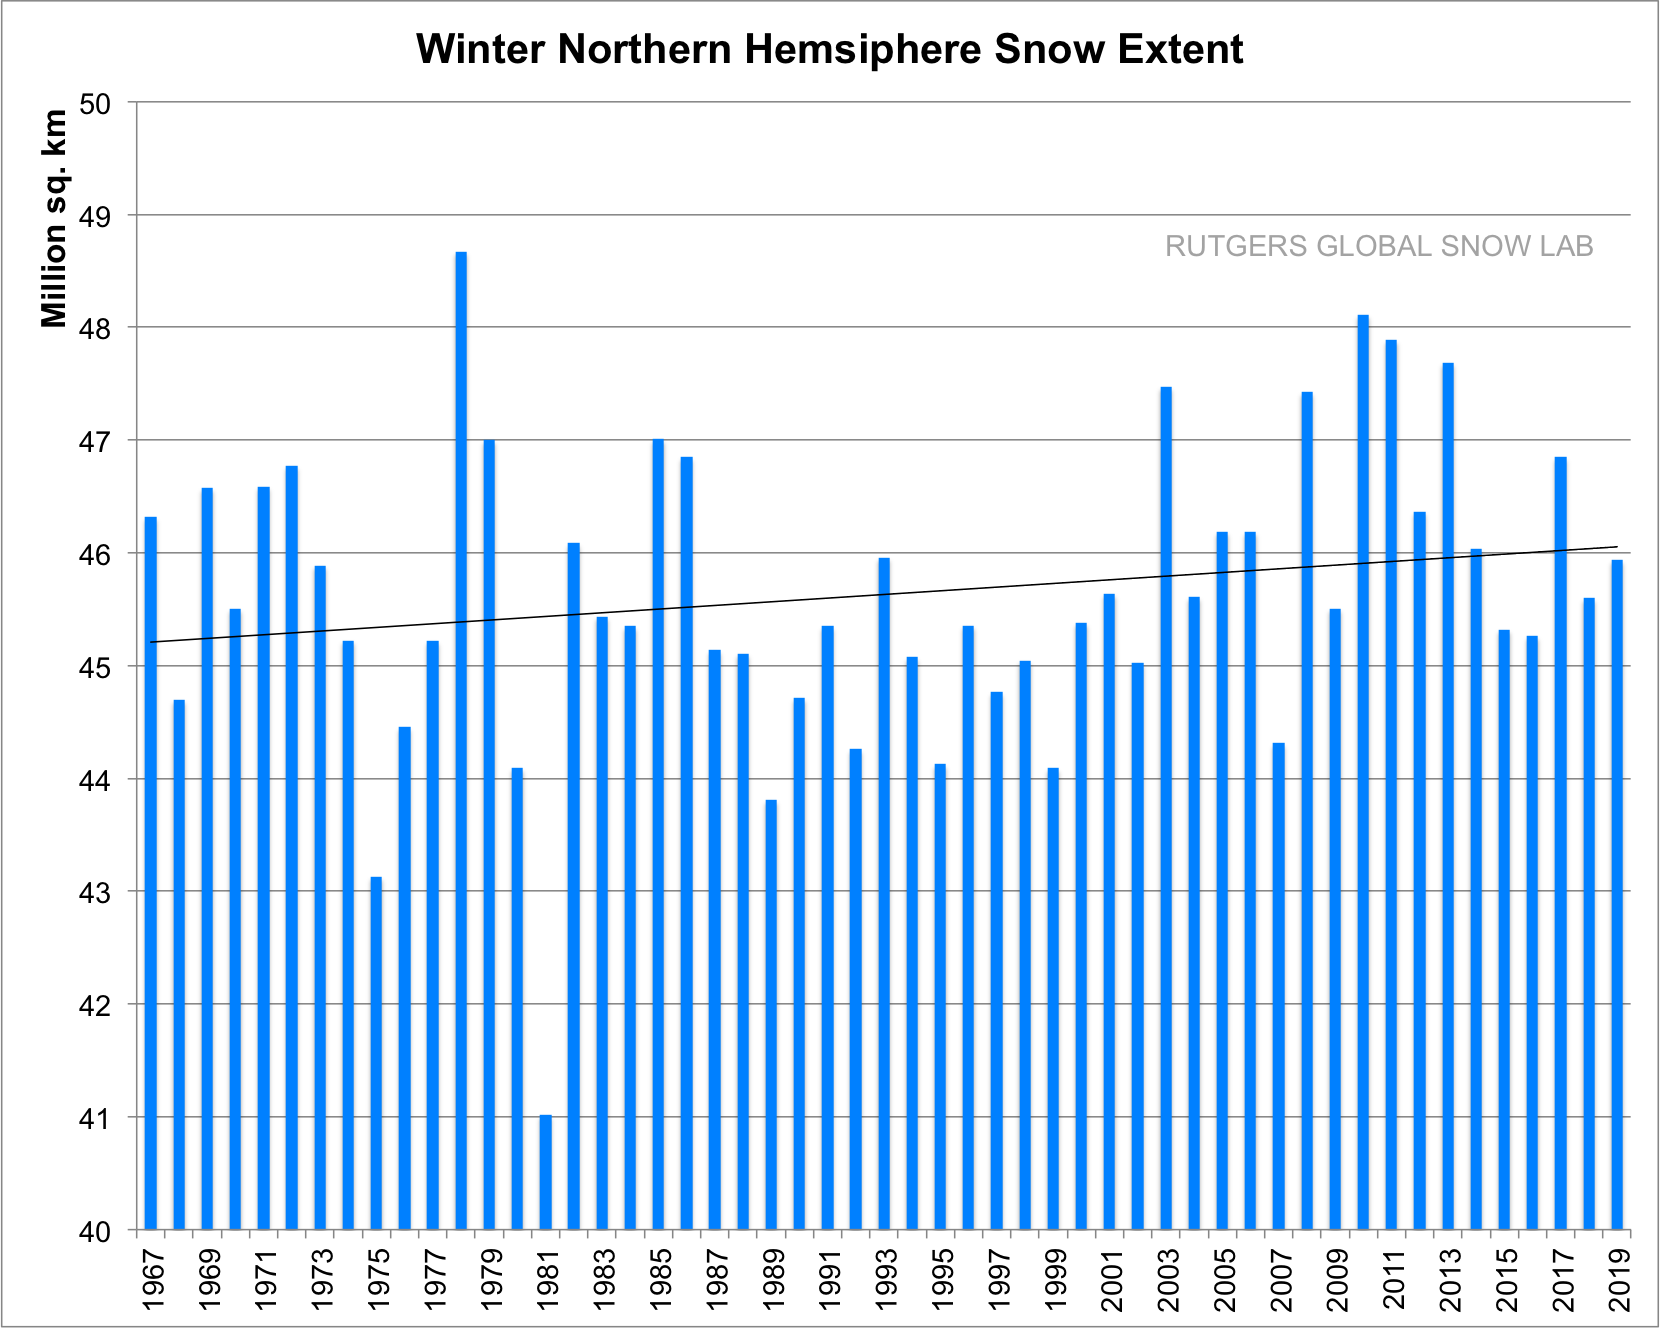
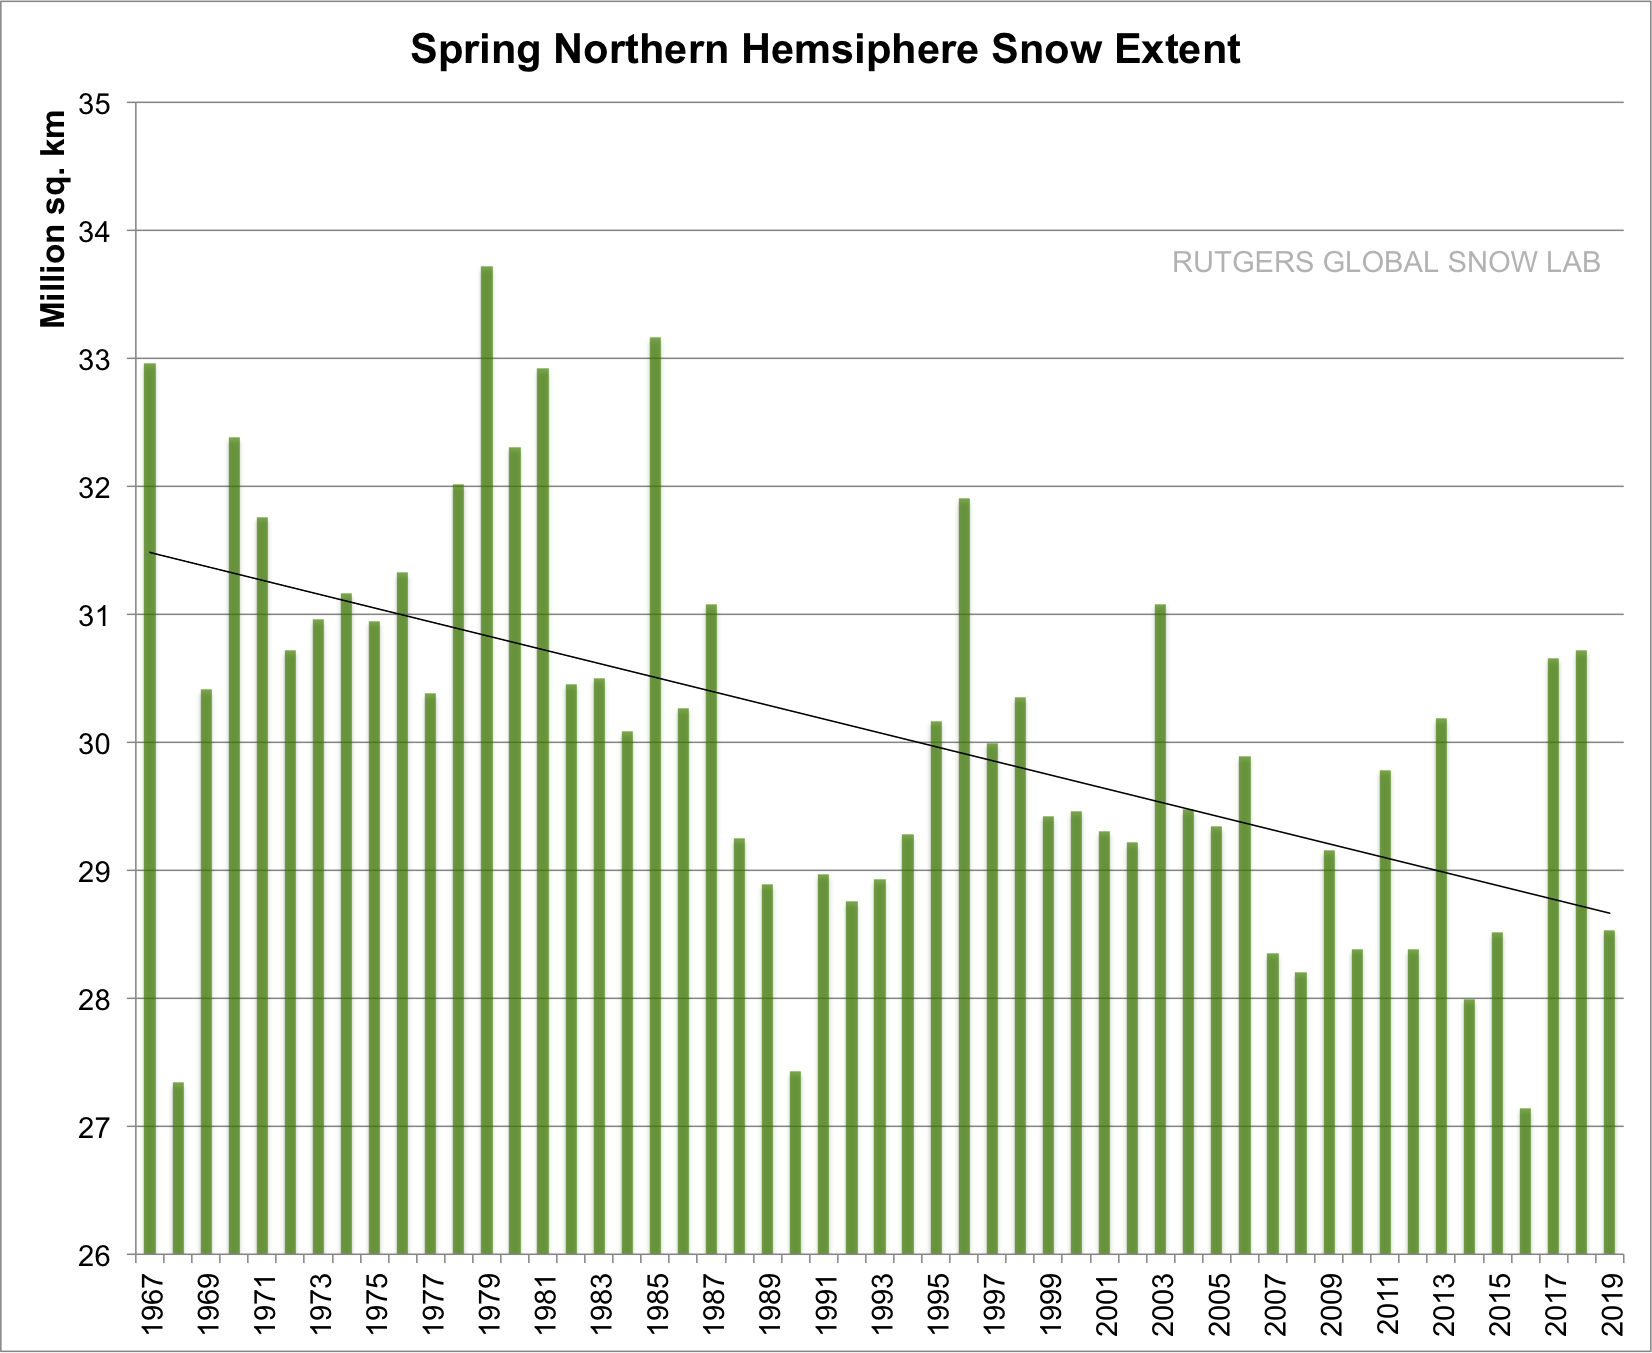
Let us see what the snow statistics show. These are from the Rutgers’ snow lab.
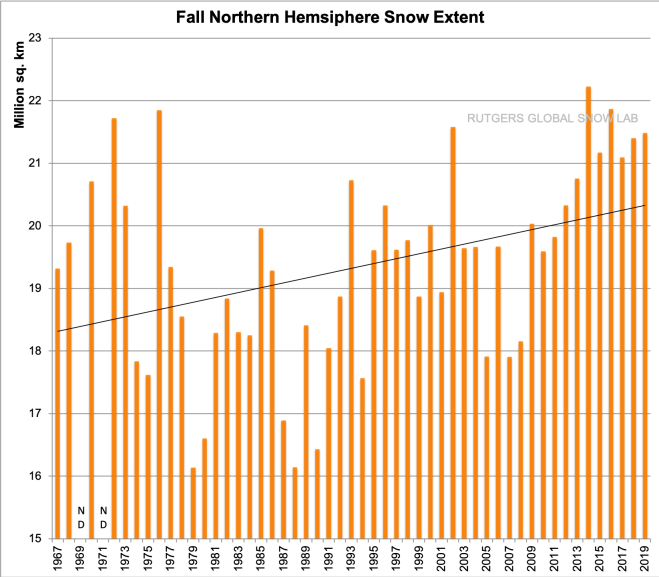
The fall snow extent is increasing, and has increased by more than 2 percent per year.
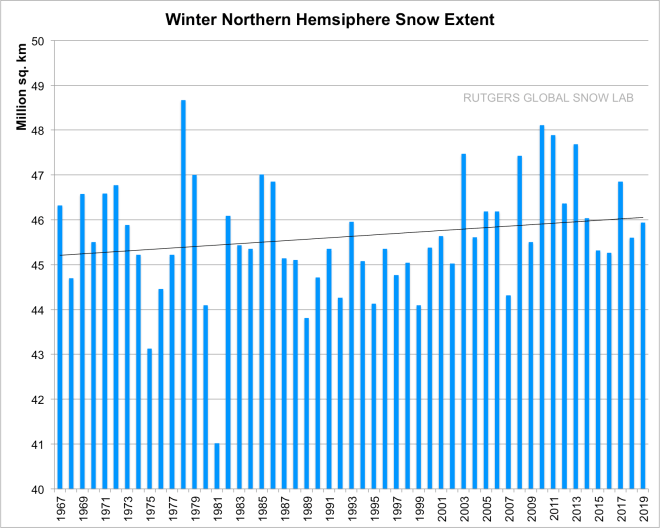
The winter snowfall has also increased but only by 0.04 percent per year. The snow covers all of Russia, Northern China, Mongolia, Tibet, Kashmir and northern Pakistan, Northern Afghanistan, Northern Iran, Turkey, Part of Eastern Europe, Scandinavia, Canada, Alaska, Greenland and part of Western and Northern United States.
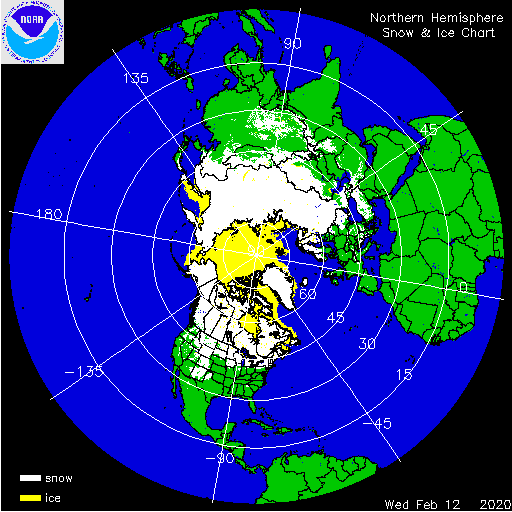
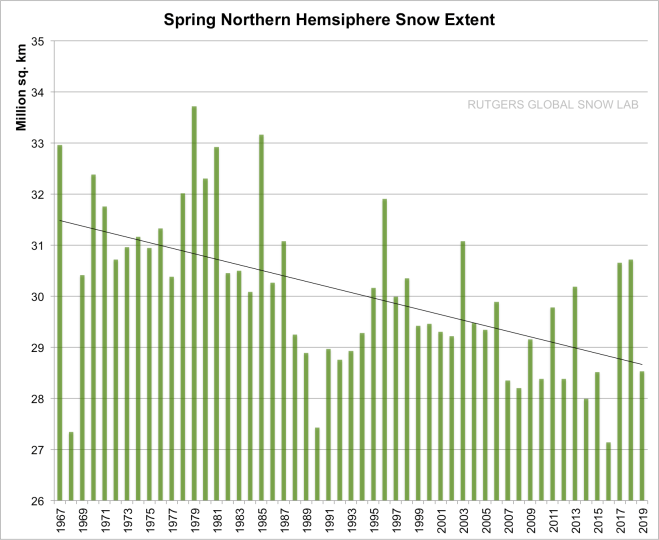
In the spring on the other hand the snow pack is melting faster, about 1.6 percent less snow per year. One of the major reasons for an earlier snow-melt is that the air is getting dirtier, especially over China, and to some extent Russia. The soot from burning coal and mining and manufacturing changes the albedo of the snow. The soot is visible on old snow all the way up to the North Pole. The other reason is that the poles are getting warmer. In the fall and winter it is mostly due to increased snowfall, but in the spring, as soon as the temperature rises over the freezing point, melting occurs.

So the warming of the poles, far from being an impending end of mankind as we know it, may even be beneficial. Warmer poles in the winter means less temperature gradient between the poles and the tropics, leading to less severe storms. They will still be there, but less severe.

There is one great benefit of increased CO2, the greening of the earth.
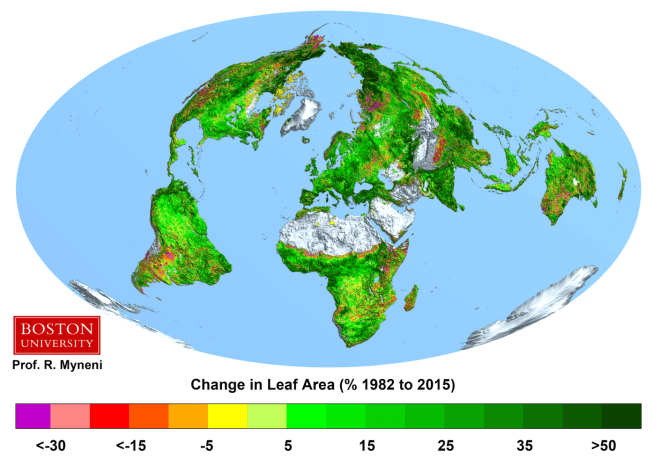
Thanks to this greening, accomplished with only the fertilizing effect of CO2, the earth can now keep another 2 billion people from starvation, not to mention what it does to increase wild plants and wildlife. More vegetation also helps to combat erosion.
Having said that, I am still a conservationist. Coal, oil and gas will run out at some time, and I for one would like to save some for future generations, not yet born. In addition I would like to minimize the need for mining, which can be quite destructive to the environment.

The best solution is to switch most electricity generation to Thorium molten salt nuclear power. There are many reasons why this should be done as a priority.
Here are some of them:

The case for Thorium. 1. A million year supply of Thorium available worldwide.

The case for Thorium. 2. Thorium already mined, ready to be extracted.

The case for Thorium. 3. Thorium based nuclear power produces 0.012 percent as much TRansUranium waste products as traditional nuclear power.

The case for Thorium. 4. Thorium based nuclear power will produce Plutonium-238, needed for space exploration.

The case for Thorium. 5. Thorium nuclear power is only realistic solution to power space colonies.

The case for Thorium. 6. Radioactive waste from an Liquid Fluoride Thorium Reactor decays down to background radiation in 300 years compared to a million years for U-235 based reactors. A Limerick.

The case for Thorium. 7. Thorium based nuclear power is not suited for making nuclear bombs.

The case tor Thorium. 8. Produces isotopes that helps treat and maybe cure certain cancers.

The case for Thorium. 9. Liquid Fluoride Thorium Reactors are earthquake safe, only gravity needed for safe shutdown.

The case for Thorium. 10. Molten Salt Liquid Fluoride Thorium Reactors cannot have a meltdown, the fuel is already molten, and it is a continuous process. No need for refueling shutdowns.

The case for Thorium. 11. Molten Salt Nuclear Reactors have a very high negative temperature coefficient leading to a safe and stable control.

The case for Thorium 13. Virtually no spent fuel problem, very little on site storage or transport.

The case for Thorium. 14. Liquid Fluoride Thorium Nuclear reactors scale beautifully from small portable generators to full size power plants.

The case for Thorium. 15. No need for evacuation zones, Liquid Fuel Thorium Reactors can be placed near urban areas.

The case for Thorium. 16. Liquid Fluoride Thorium Reactors will work both as Base Load and Load Following power plants.

The case for Thorium. 17. Liquid Fluoride Thorium Reactors will lessen the need for an expanded national grid.

The case for Thorium. 18. Russia has an active Thorium program.

The case for Thorium. 19. India is having an ambitious Thorium program, planning to meet 30% of its electricity demand via Thorium based reactors by 2050.

The case for Thorium 20. China is having a massive Thorium program.

The case for Thorium. 21. United States used to be the leader in Thorium usage. What happened?

The case for Thorium. 22. With a Molten Salt Reactor, accidents like the Three Mile Island disaster will not happen.

The case for Thorium. 23. With a Molten Salt Reactor, accidents like Chernobyl are impossible.

The case for Thorium. 24. With Molten Salt Reactors, a catastrophe like Fukushima cannot happen.

The case for Thorium. 25. Will produce electrical energy at about 4 cents per kWh.

The case for Thorium. 26. Can deplete most of the existing radioactive waste and nuclear weapons stockpiles.

The case for Thorium. 27. With electric cars and trucks replacing combustion engine cars, only Thorium Nuclear power is the rational solution to provide the extra electric power needed.

The case for Thorium 28. The race for space colonies is on. Only Molten Salt Thorium Nuclear reactors can fit the bill.

Published by

lenbilen

Retired engineer, graduated from Chalmers Technical University a long time ago with a degree in Technical Physics. Career in Aerospace, Analytical Chemistry, computer chip manufacturing and finally adjunct faculty at Pennsylvania State University, taught just one course in Computer Engineering, the Capstone Course.

Leave a Reply

This site uses Akismet to reduce spam. Learn how your comment data is processed.

Post navigation