Old Nancy Pelosi ‘set up’ by a barbress
is nominal speaker of almighty Congress
And she is third in line
to be President; fine.
Accept Mea Culpa! The stylist is jobless.
The other verses to the ode are here
Old Nancy Pelosi ‘set up’ by a barbress
is nominal speaker of almighty Congress
And she is third in line
to be President; fine.
Accept Mea Culpa! The stylist is jobless.
The other verses to the ode are here
Joe Biden a-napping in Delaware
by interview wake-up-call unaware
Sleepy Joe, it’s a shame
from now on, you’re fair game
the sound of your snoring is in the air.
Umbrellas: A hard task for some.
To Barry as hard as they come.
The most powerful man:
See him do what he can.
To fold it, try using your thumb!
This was the former President Barack Obama

He always had trouble handle an umbrella.look down on his notes and talk at the same time, so he commandeered the Marines to hold the umbrella for him. To be fair he commandeered another Marine to keep President Erdogan of Turkey dry. No such consideration was given the audience.
But he couldn’t keep his own wife out of the rain either. It is difficult to hold an umbrella, wave, walk down the stairs and keep your wife dry, all at the same time.

No, This is the way to handle an umbrella!

Nothing fancy, just do it. And keep your wife dry at the same time.
The number of corona-virus cases for U.S.A as of August 27 is 6,086,178 deaths are 185,692 and the death rate is 3.05%. There are four states: New York, New Jersey, Pennsylvania and Michigan, under DOJ investigation because they required nursing homes to admit and readmit COVID-19 cases resulting in many deaths. If these states are excluded from the count the death rate would be 2.35%
The Democratic convention speakers assured us that this was the worst result of any country in the world, thanks to President Trump’s inaction and refusal to accept science. So, how does U.S.A. compare to the rest of the world? The cases, deaths and death rates for all countries with higher death rates are listed below:
1. Yemen 1,943 563 29.0%
2. Italy 265,409 35,472 13.4%
3. United Kingdom 331,644 41,486 12.5%
4. Belgium 83,500 9,884 11.8%
5. France 267,077 30,596 11.5%
6. Hungary 5,511 614 11.1%
7. Mexico 579,914 62,594 10.8%
8. Netherlands 69,131 6,220 9.0%
9. Channel Islands 625 48 7.7%
10. Chad 1,008 77 7.6%
11. Canada 127,074 9,108 7.2%
12. Spain 455,621 29,011 7.1%
13. Isle of Man 336 24 7.1%
14. Sweden 83,958 5,821 6,9%
15. Sudan 13,082 823 6.3%
16. Liberia 1,298 82 6.3%
17. Ireland 28,578 1,778 6.2%
18. San Marino 710 42 5.9%
19. Niger 1,173 69 5.9%
20. Ecuador 112,141 6,504 5.8%
21. Iran 369,911 21,249 5.7%
22. Egypt 98,062 5,342 5.4%
23. Switzerland 41,346 2,004 4.8%
23. Slovenia 2,797 133 4.8%
25. Andorra 1,124 53 4.7%
26. Mali 2,736 126 4.6%
27. Peru 621,997 28,277 4.5%
28. Indonesia 165,887 7,169 4.3%
29. Barbados 165 7 4,2%
29. Finland 8,042 335 4.2%
29. North Macedonia 14,163 590 4.2%
29. Bolivia 113,129 4,791 4.2%
33. Burkina Faso 1,352 55 4.1%
33. Tanzania 509 21 4.1%
34. Germany 242,101 9,360 3.9%
35. Sint Maarten 444 17 3.8%
36. Denmark 16,700 624 3.7%
36. Guatemala 72,921 2,709 3.7%
36. Afghanistan 38,140 1,402 3,7%
26. Bulgaria 15,908 594 3.7%
40. Brazil 3,772,945 118,988 3.2%
41. Iraq 223,612 6,814 3.1%
41. Poland 65,480 2,018 3.1%
That’s right! U.S.A. ranks as 43th worst country!
Now there are countries that do better, some much better. One group has this in common: They administer a proper therapy of hydroxychloroquine, most often with Zinc and Z-max as soon as symptoms occur, with or without a positive test. Some of the countries are so poor that it is all they can afford. The result?

Country Cases Deaths
1. Qatar 118,196 196 0.2% The country of Qatar consists of 88% temporary workers between the ages of 20 and 60 and most of the deaths occurred in the remaining 12% of the original population. This means that the death rate of persons between the ages of 20 and 60 is less than 0.2% if given HCQ + Zinc as soon as symptoms occur or as a prophylactic administered instead of contact tracing and quarantine. If this regimen would be implemented immediately we could fully open schools and universities, have college and professional sports again and fully open all businesses. Only protect the most vulnerable.
2. Bahrain 50,756 189 0.4% Again, about half of the population are immigrants or guest workers. They have a high rate of obesity and diabetes, but HCQ seems to be working excellent in Bahrain
3. UAE 68,901 379 0.6% The United Arab Emirates is a nation of 88% non-citizen immigrants and guest workers. there are over twice as many males as there are females.
4. Israel 112,000 894 0.8%
5. Costa Rica 38,485 407 1.1%
6. Malaysia 9,306 125 1.3%
7. Russia 980,405 16,914 1.7%
8. South Korea 19,077 316 1.7%
9. India 3,461,240 62,713 1.8%
10. Morocco 58,489 1,052 1.8%
11. Ukraine 114,497 2,451 2.1%
12. Senegal 13,384 279 2.1%
13. Turkey 265,515 6,245 2.4%
14. Cuba 3,866 92 2.4%
15. Greece 9,800 259 2.6%
There are countries that are not doing as well as U.S.A. in combating the corona pandemic, even though they freely administer HCQ. They are
16. Algeria 43,403 1,483 3.4%
17.Indonesia 165,887 7,169 4.3%
and probably others. Many countries’ health statistics are of dubious accuracy. That is why China is excluded.
Other countries, such as
Iceland 2,092 10 0.5%
Faeroe Islands 411 0 0.0%
Japan 64,668 1,226 1.9% have had success with a thorough contact tracing and quarantine. This can only be done if caught at the earliest stages of the disease. Remember, Japan never allowed the people from the infected cruise ship to enter Japanese soil and be treated in hospitals.
Vaccine may not be as effective as first thought. The china corona virus has mutated into 11 strains, and continues to mutate, so a universal vaccine cannot be developed, but like the flu, every year will have a new strain to combat.
The only solution is to implement a hydroxychloroquine + Zinc + Zitromax regimen, both as a prophylactic and as a therapy as soon as symptoms occur.
According to the Ford study treatment with hydroxychloroquine cut the death rate significantly in sick patients hospitalized with COVID-19 – and without heart-related side-effects, according to a new study published by Henry Ford Health System. The death rate was cut in half for patients treated with HCQ. It is even more dramatic if HCQ is administered as soon as symptoms occur, over 40 international studies have shown an up to 80+% reduction in death rates. For some reason FDA and CDC do not acknowledge international studies. They rather let people die than accept a drug that has been approved for over50 years, and given freely to people with Lupus. It is so safe it is even given to pregnant women and nursing mothers.
How many extra deaths are we talking about? HCQ is already administered under right to try by about 16% of all cases. If it had been recommended in April, one month after President Trump recommended it based on excellent results in french studies, about half the deaths from then on could have been avoided. It adds up, about 1.5% of all cases since April 15, or about 78,000 deaths could have been avoided, and moving forward about 600 deaths a day. This is in my opinion a low estimate.
Another significant moment in the hydroxychloroquine debate came on July 23 in the form of an opinion piece. Harvey A. Risch, MD, PhD, a professor of epidemiology at Yale School of Public Health with years of healthcare experience, wrote in favor of the medication, calling it “highly effective” and describing physicians who use it “in the face of widespread skepticism” as heroes.
In his opinion piece, Risch listed several studies that have pointed to the benefits of treating COVID-19 with hydroxychloroquine. He also wrote about how the medication has been politicized and said it “has not been used properly in many studies.”
“In the future, I believe this misbegotten episode regarding hydroxychloroquine will be studied by sociologists of medicine as a classic example of how extra-scientific factors overrode clear-cut medical evidence,” he concluded. “But for now, reality demands a clear, scientific eye on the evidence and where it points. For the sake of high-risk patients, for the sake of our parents and grandparents, for the sake of the unemployed, for our economy and for our polity, especially those disproportionally affected, we must start treating immediately.”
His assessment of lives saved with HCQ ++ was 70,000 lives would have been saved as of Aug 1 if HCQ had been used as early as possible. He is the scientist, I am using public data drawn from a population of 2 billion people, and we reached a very similar conclusion.
Do it! The fact that President Trump has advocated it as early as March should not be a hindrance to save 600 lives a day!
Here are the Corona-virus death rates for the 11 largest counties in the U.S.A
County population cases deaths percentage deaths
Los Angeles 10,105,518 227,346 5,446 2.4%
Cook, IL 5,180,493 119,000 4,988 4.2%
Harris, TX 4,698,619 95,631 1,122 1.2%
Maricopa, AZ 4,410,824 131,044 2,745 2.1%
San Diego 3,343,364 35, 608 644 1.8%
Orange, CA 3,185,968 44.936 856 1.9%
Miami-Dade 2,761,581 150,305 2,219 1.5%
Dallas 2,637,772 69.343 854 1.2%
Kings, NYC 2,582,830 65,867 7,274 11.0%
Riverside, CA 2,450,758 48,956 922 1.9%
Queens, NYC 2,278,906 70,770` 7,212 10.2%
The total death rates are below 2% for 6 of the 11 largest counties, 2.4% for Los Angeles county and 2.1% for Phoenix in Arizona. Florida has 1.5% and Texas has 1.2%. Brooklyn and Queens in New York City are standouts, their death rates are over 10%. Thanks to Governor Cuomo’s directive to place covid patients back in nursing homes after they tested positive the death rate sky-rocketed in New York State. And Governor Cuomo bragged about how well he handled the Corona virus at the Democratic convention. But he was not alone. The governors of New Jersey, Pennsylvania, Connecticut and Michigan did the same, no extra protection for the most vulnerable. The Corona virus death rates could have been much lower. As it is, the cases, deaths and death rates for U.S.A. is 5,784,781 178,972 and 3.1%
The Democratic convention speakers assured us that this was the worst result of any country in the world, thanks to President Trump’s inaction and refusal to accept science. So, how do U.S.A. compare to the rest of the world? The cases, deaths and death rates for all countries with higher death rates are listed below:
1. Yemen 1,899 541 28.5%
2. Italy 257,065 35,467 13.8%
3. France 234,400 30,503 13.0%
4. United Kingdom 323,313 41,405 12.8%
5. Belgium 80,178 9,976 12.4%
6. Hungary 5,098 611 12.0%
7. Mexico 543,806 59,106 10.9%
8. Netherlands 65,589 6,195 9.4%
9. Channel Islands 614 48 7.8%
10. Chad 981 76 7.7%
11. Canada 124,099 9,060 7.3%
12. Spain 407,839 28,838 7.1%
13. Isle of Man 336 24 7.1%
14. Sweden 86,068 5,810 6,7%
15. Sudan 12,623 812 6.4%
16. Liberia 1,284 82 6.4%
17. Ireland 27,755 1,776 6.4%
18. San Marino 704 42 6.0%
19. Ecuador 106,481 6,248 5.9%
20. Niger 1,169 69 5.9%
21. Iran 354,763 20,376 5.7%
22. Egypt 97,025 5,212 5.4%
23. Switzerland 39,332 2,000 5.1%
24. Slovenia 2,574 130 5.1%
25. Andorra 1,045 53 5.0%
26. Peru 567,059 27,034 4.8%
27. Sint Maarten 353 17 4.8%
28. Martinique 336 16 4,8%
29. Mali 2,667 125 4.7%
30. Barbados 157 7 4.5%
31. Indonesia 149,408 6,500 4.4%
32. Burkina Faso 1,297 55 4.2%
33. Finland 7,871 334 4.2%
34. North Macedonia 13,308 557 4.2%
35. Saint Martin 121 5 4.1%
36. Bolivia 106,065 4.305 4.1%
37. Tanzania 509 21 4.1%
38. Germany 233,002 9,328 4.0%
39. Denmark 16,127 621 3.9%
40. Guatemala 66,941 2,532 3.8%
41. Afghanistan 37,894 1,385 3,7%
42. Bulgaria 14962 532 3.6%
43. Brazil 3,513,039 112,670 3.2%
44. Iraq 197,085 6,283 3.2%
45. Poland 60,281 1,938 3.2%
That’s right! U.S.A. ranks as 46th worst country!
Now there are countries that do better, some much better. One group has this in common: They administer a proper therapy of hydroxychloroquine, most often with Zinc and Z-max as soon as symptoms occur, with or without a positive test. Some of the countries are so poor that it is all they can afford. The result?
U.S.A. could do even better by adopting this therapeutic remedy.
Do it! The fact that President Trump has advocated it should not be a hindrance to save lives!


Nothing could be further from the truth. It is true, they didn’t use to vote. But in the 2000 election they started voting, and they voted pro life. They were always law abiding, and were allowed to keep their one room school houses with 8 year education, were allowed to have their own pooled medical services, and maintained their religious exemption from military service and social security. Do they really shun electricity? The picture below shows a recently built Amish homestead with the telltale clothesline, but also a small wind turbine and four solar panels to provide

electricity. Contrary to popular opinion the Amish do not shun electricity, they just want to be left unconnected to the “English”, in other words, live off the grid. Their desire to be independent force them to be resourceful and innovative, since they also follow the law of the land whenever possible. So it was, when the farms were mandated to refrigerate the milk before pickup they installed electric coolers. The electricity was generated by diesel generators, so bingo, they could get electricity for their workshops as well, and turn from primitive hand work to fully modern wood workshops, I know, they provided a first class kitchen for our home in Intercourse. They had a problem, federal law mandated headlights on their buggies to be street legal. The propane lights with gas stockings burned well, but were too fragile to last the bumpy buggy rides so they installed car headlights running on car batteries. They had to be charged often, and it became quite expensive, so the Amish in 2003 made the first commercially available LED headlights for their buggies, thereby extending battery life more than ten–fold for a marine deep-charge lead-acid battery, from six hours to 100 hours.

Even at 120 dollars a piece it made economic sense. How do you charge batteries? This is where the solar panels come in, they are used to charge the batteries. When the sun doesn’t shine the wind may blow, a reasonable backup. Now they have 12 volt electric power. The next step was to wire the house and install 12 V LED lights and provide 12 volt DC or 24 volt AC outlets for small appliances. The lights are great, but many appliances are still run the hard way, diesel engines providing compressed air, which run their wells with jet-pumps and in their hand mixers they take out the motor and replace with a compressed air motor. The LED lights beat kerosene lamps any day for efficiency, and even a compressed air driven refrigerator is much more efficient than a kerosene refrigerator.
So if the grid goes down for an extended period of time, who is better off? The Amish are far ahead of us in preparation for catastrophes.

And the Amish do get together and fellowship for any reason, but mostly for their Sunday services, which are held in the upper room of their workshops, or in the kitchen for the women and the basement for the men. The horse-drawn pew-mobile is in the picture above, to the right. This is a tell-tale sign who hosts the service next time.

Before the “Big Bang” is “I am”.
Creation by God, not a scam.
He said: “Let there be light”.
And there was: With God’s might.
The Triune, eternal “I am”.
As it so happens, the triune God is introduced early in the Bible, in Genesis 1:1-3
1 In the beginning God created the heavens and the earth. 2 Now the earth was formless and empty, darkness was over the surface of the deep, and the Spirit of God was hovering over the waters. 3 And God said, “Let there be light,” and there was light.
This establishes a few things. There was a beginning. Before the beginning was God. He is named Elohim (the strongest strong one). The covenant name Jehovah is introduced in Genesis 2:4b: in the day that the LORD God made the earth and the heavens, and this points to the fact that it is Jehovah, the Father that is the creator. Verse 2 points to the Spirit of God hovering over the waters, that is the Holy spirit. Verse 3 mentions God said, Let there be light. That is the word. As the Apostle John wrote in John 1:14 And the Word was made flesh, and dwelt among us, (and we beheld his glory, the glory as of the only begotten of the Father,) full of grace and truth. This refers to the Son, the Lord Jesus Christ.
There we have it: The triune God, Father, Son and the Holy spirit defined already in Genesis 1:1-3.
We are bound in time and Space. God is not. Before the Big Bang, time and space has no meaning for us. Therefore it is not possible for us to even begin to comprehend the greatness of God. As the Prophet Isaiah wrote a long time ago (In chapter 55)
6 Seek ye the Lord while he may be found, call ye upon him while he is near:
7 Let the wicked forsake his way, and the unrighteous man his thoughts: and let him return unto the Lord, and he will have mercy upon him; and to our God, for he will abundantly pardon.
8 For my thoughts are not your thoughts, neither are your ways my ways, saith the Lord.
9 For as the heavens are higher than the earth, so are my ways higher than your ways, and my thoughts than your thoughts.
10 For as the rain cometh down, and the snow from heaven, and returneth not thither, but watereth the earth, and maketh it bring forth and bud, that it may give seed to the sower, and bread to the eater:
11 So shall my word be that goeth forth out of my mouth: it shall not return unto me void, but it shall accomplish that which I please, and it shall prosper in the thing whereto I sent it.
As CO2 warms up the poles
burned oil, gas and coal play their roles.
CO2 is still good;
makes plants green, grows more food,
and clouds are the climate controls.
We live in interesting times, the CO2 concentration has increased 50% since the beginning of industrialization. In the last 30 years the level has risen 17%, from about 350 ppm to nearly 410 ppm. This is what scares people. Is is time to panic and stop carbon emissions altogether as Greta Thunberg has suggested?As if on cue the climate models have been adjusted, and they suddenly show a much higher rate of temperature increase, in this case what is supposed to happen to global temperatures for a doubling of CO2 from pre-industrial times, from 270ppm to 540ppm.
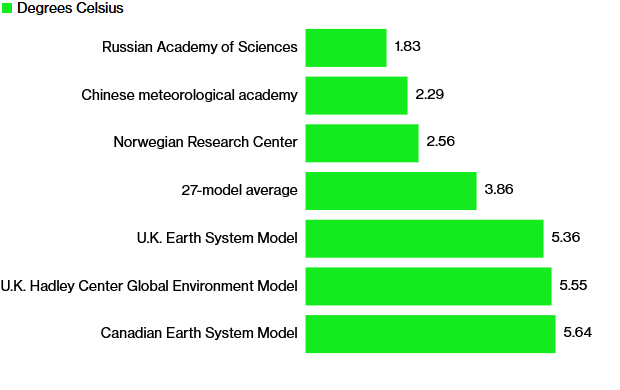
![]() There are two ways to approach this problem. The models make certain assumptions about the behavior of the changing atmosphere and model future temperature changes. This is the approach taken by IPCC for the last 32 years. These models are all failing miserably when compared to actual temperature changes.
There are two ways to approach this problem. The models make certain assumptions about the behavior of the changing atmosphere and model future temperature changes. This is the approach taken by IPCC for the last 32 years. These models are all failing miserably when compared to actual temperature changes.
The other way i to observe what is actually happening to our temperature over time as the CO2 increases. We have 50 years of excellent global temperature data, so with these we can see where, when and by how much the earth has warmed.
The most drastic temperature rise on earth has been in the Arctic above the 80th latitude. In the winter of 2018 it was 8C above the 50 year average. See charts from the Danish Meteorological Institute: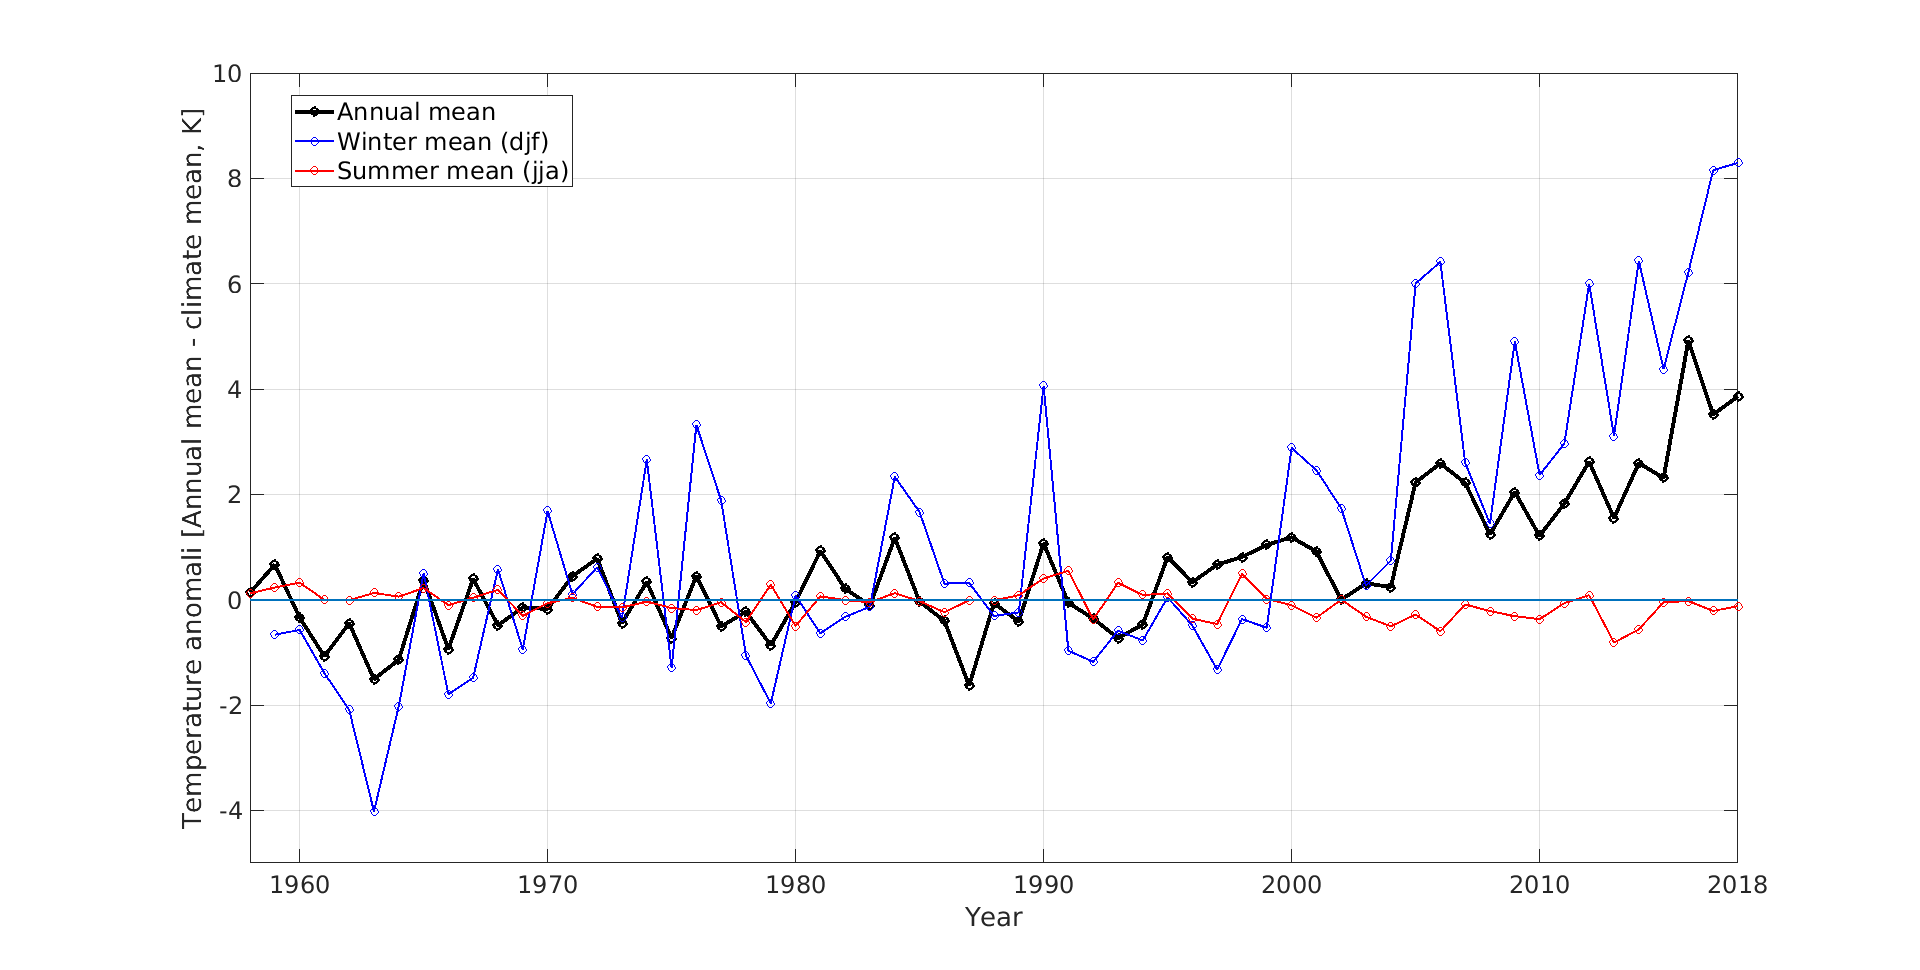
Note, there is no increase at all in the summer temperatures!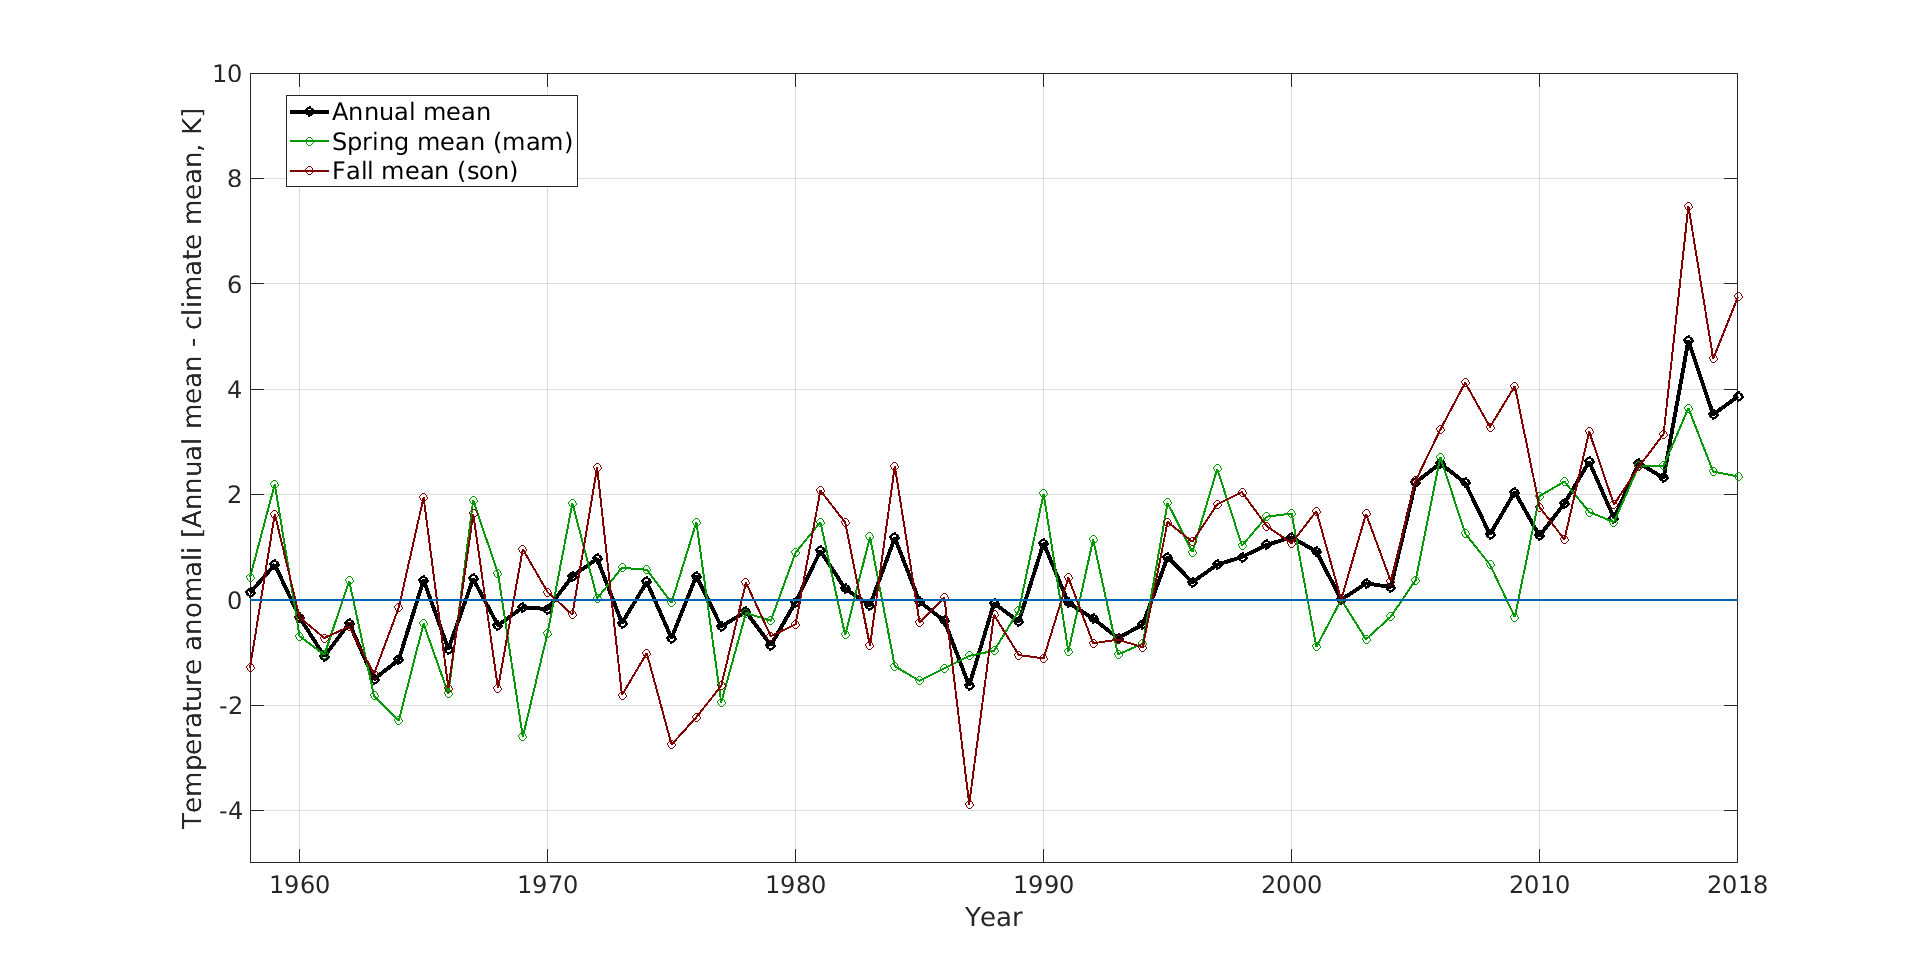
The fall temperature saw an increase of 5C and the spring temperature saw an increase of about 2.5C.
The 2020 winter recorded an about 4c increase Source: DMI.
Notice: In this chart the there is no recorded summer temperature increase at all!
The 5 thru 8C winter rise of temperature is significant, most would even say alarming, but my response is, why is that?
To get the answer we must study molecular absorption spectroscopy and explain a couple of facts for the 97% of all scientists who have not studied molecular spectroscopy. IPCC and most scientists claim that the greenhouse effect is dependent on the gases that are in the atmosphere, and their combined effect is additive according to a logarithmic formula. This is true up to a certain point, but it is not possible to absorb more than 100% of all the energy available in a certain frequency band! For example: If water vapor absorbs 90% of all incoming energy in a certain band, and CO2 absorbs another 50% of the energy in the same band, the result is that 95% is absorbed, (90% + 50% * (100% – 90%)), not 140%, (90% + 50%).
The following chart shows both CO2 and H2O are absorbing greenhouse gases, with H20 being the stronger greenhouse gas, absorbing over a much wider spectrum, and they overlap for the most part. But it also matters in what frequency range s they absorb.
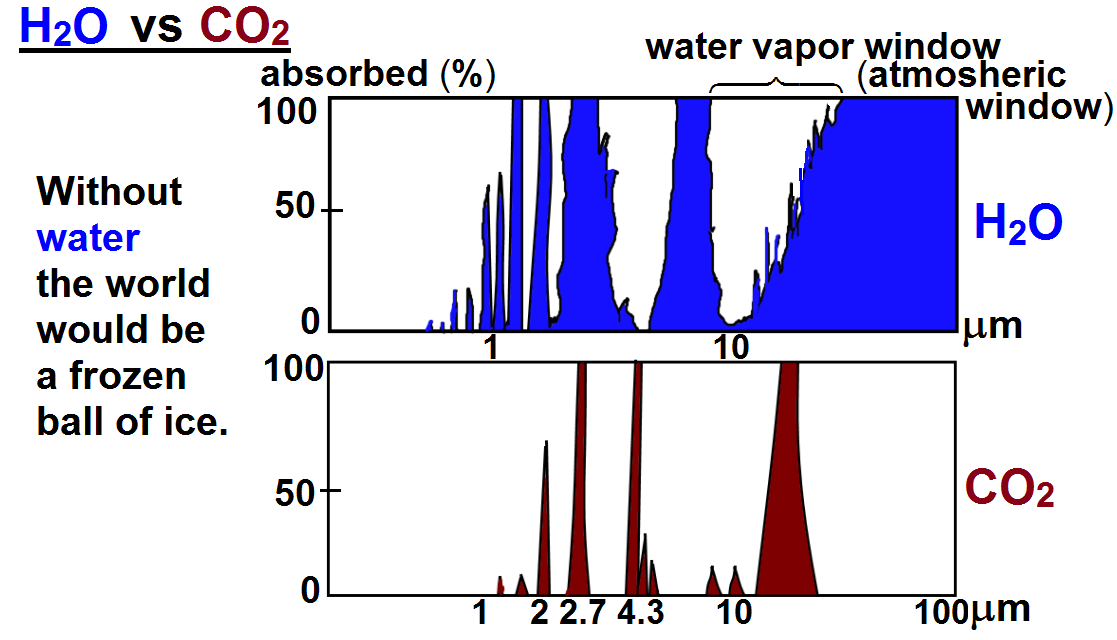
For this we will have to look at the frequency ranges of the incoming solar radiation and the outgoing black body radiation of the earth. It is the latter that causes the greenhouse effect. Take a look at this chart:
![]()
The red area represents the observed amount of solar radiation that reaches the earth’s surface, the white area under the red line represents radiation absorbed in the atmosphere. Likewise, the blue area represents the outgoing black body radiation that is re-emitted. The remaining white area under the magenta, blue or black line represents the retained absorbed energy that causes the greenhouse effect.
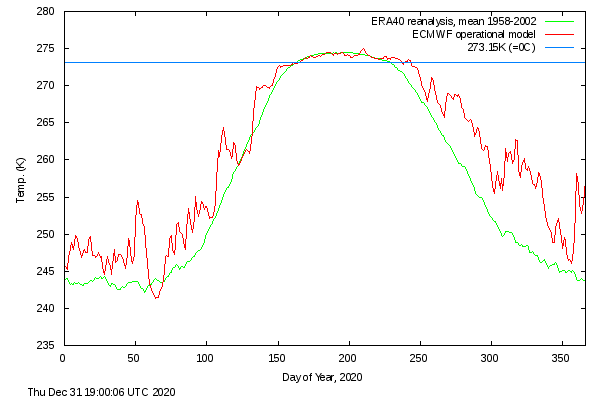
Let us now take a look at the Carbon Dioxide bands of absorption, at 2.7, 4.3 and 15 microns. Of them the 2.7 and 4.3 micron bands absorb where there is little black body radiation, the only band that is of interest is at 15 microns, and that is in a band where the black body radiation has its maximum. However it is also in a band where water vapor also absorb, not as much as CO2,only about 20% to 70% as much. Water vapor or absolute humidity is highly dependent on the temperature of the air, so at 30C there may be 50 times as much water vapor, at 0C there may be ten times as much water vapor, and at -25C there may be more CO2 than water vapor. At those low temperatures the gases are mostly additive. In the tropics with fifty times more water vapor than CO2, increased CO2 has no influence on the temperature whatsoever. Temperature charts confirm this assertion:
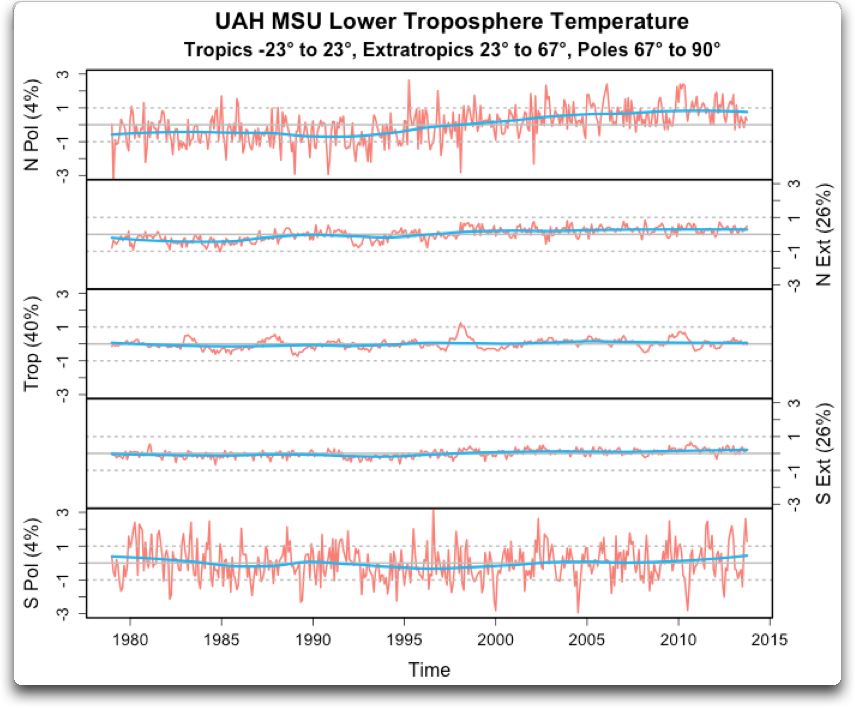
Here the temperature in the tropics displays no trend whatsoever. It follows the temperature of the oceans, goes up in an El Niño and down in a La Niña. The temperature in the southern hemisphere shows no trend. In the northern temperate region there is a slight increase, but the great increase is occurring in the Arctic. There is no increase in the Antarctic yet even though the increase in CO2 is greater in the Antarctic and the winter temperature in the Antarctic is even lower than in the Arctic. So CO2 increase cannot be the sole answer to the winter temperature increase in the Arctic.
There is an obvious answer. When temperatures increase the air can contain more moisture and will transport more moisture from the tropics all the way to the arctic, where it falls as snow. Is the snow increasing in the Arctic?
Let us see what the snow statistics show. These are from the Rutgers’ snow lab.
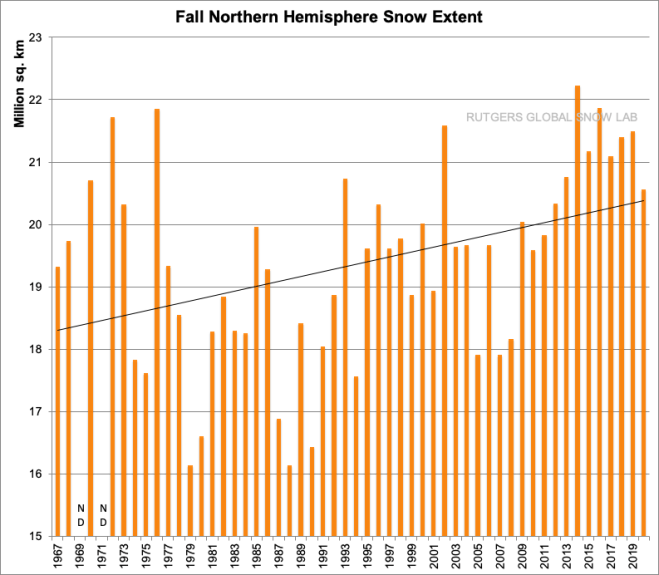
The fall snow extent is increasing, and has increased by more than 2 percent per year.
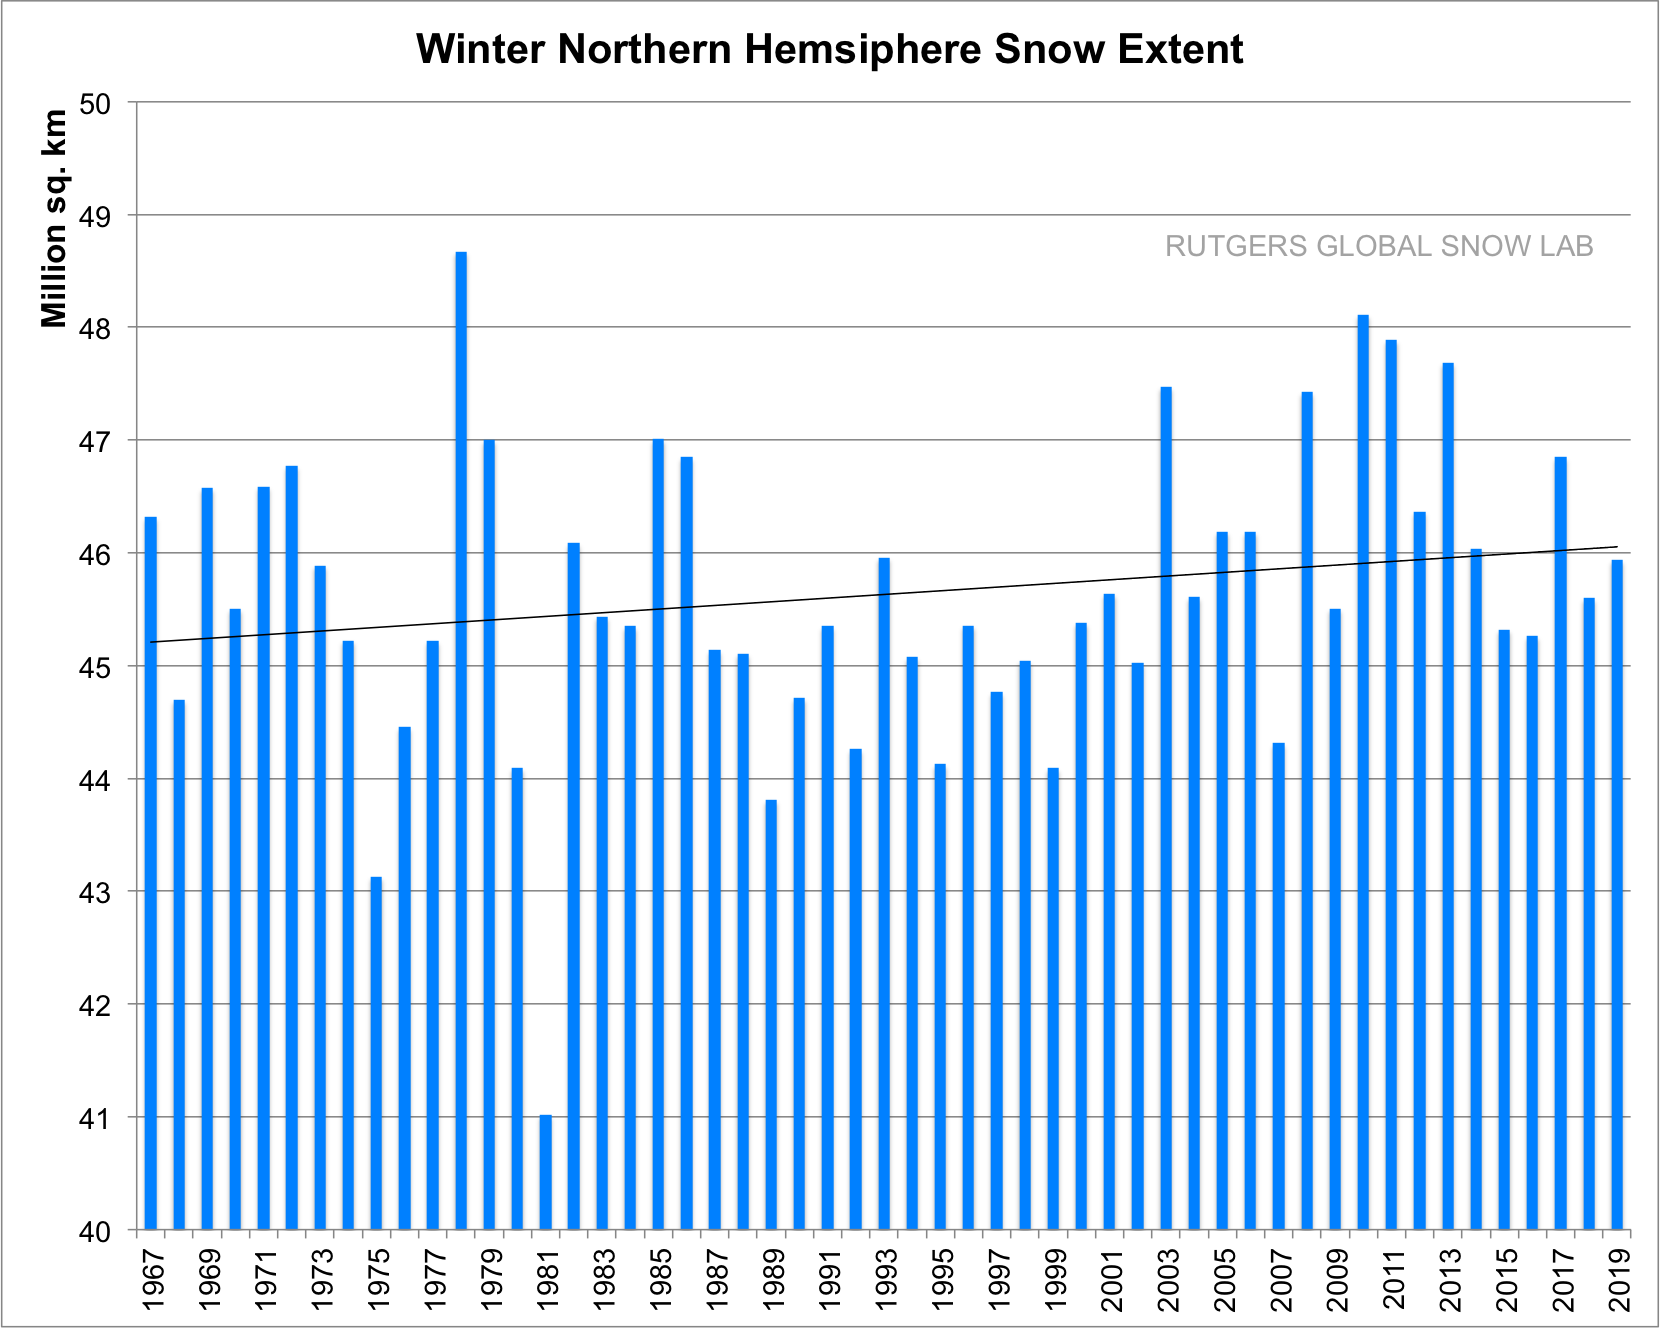
The winter snowfall has also increased but only by 0.04 percent per year. The snow covers all of Russia, Northern China, Mongolia, Tibet, Kashmir and northern Pakistan, Northern Afghanistan, Northern Iran, Turkey, Part of Eastern Europe, Scandinavia, Canada, Alaska, Greenland and part of Western and Northern United States.
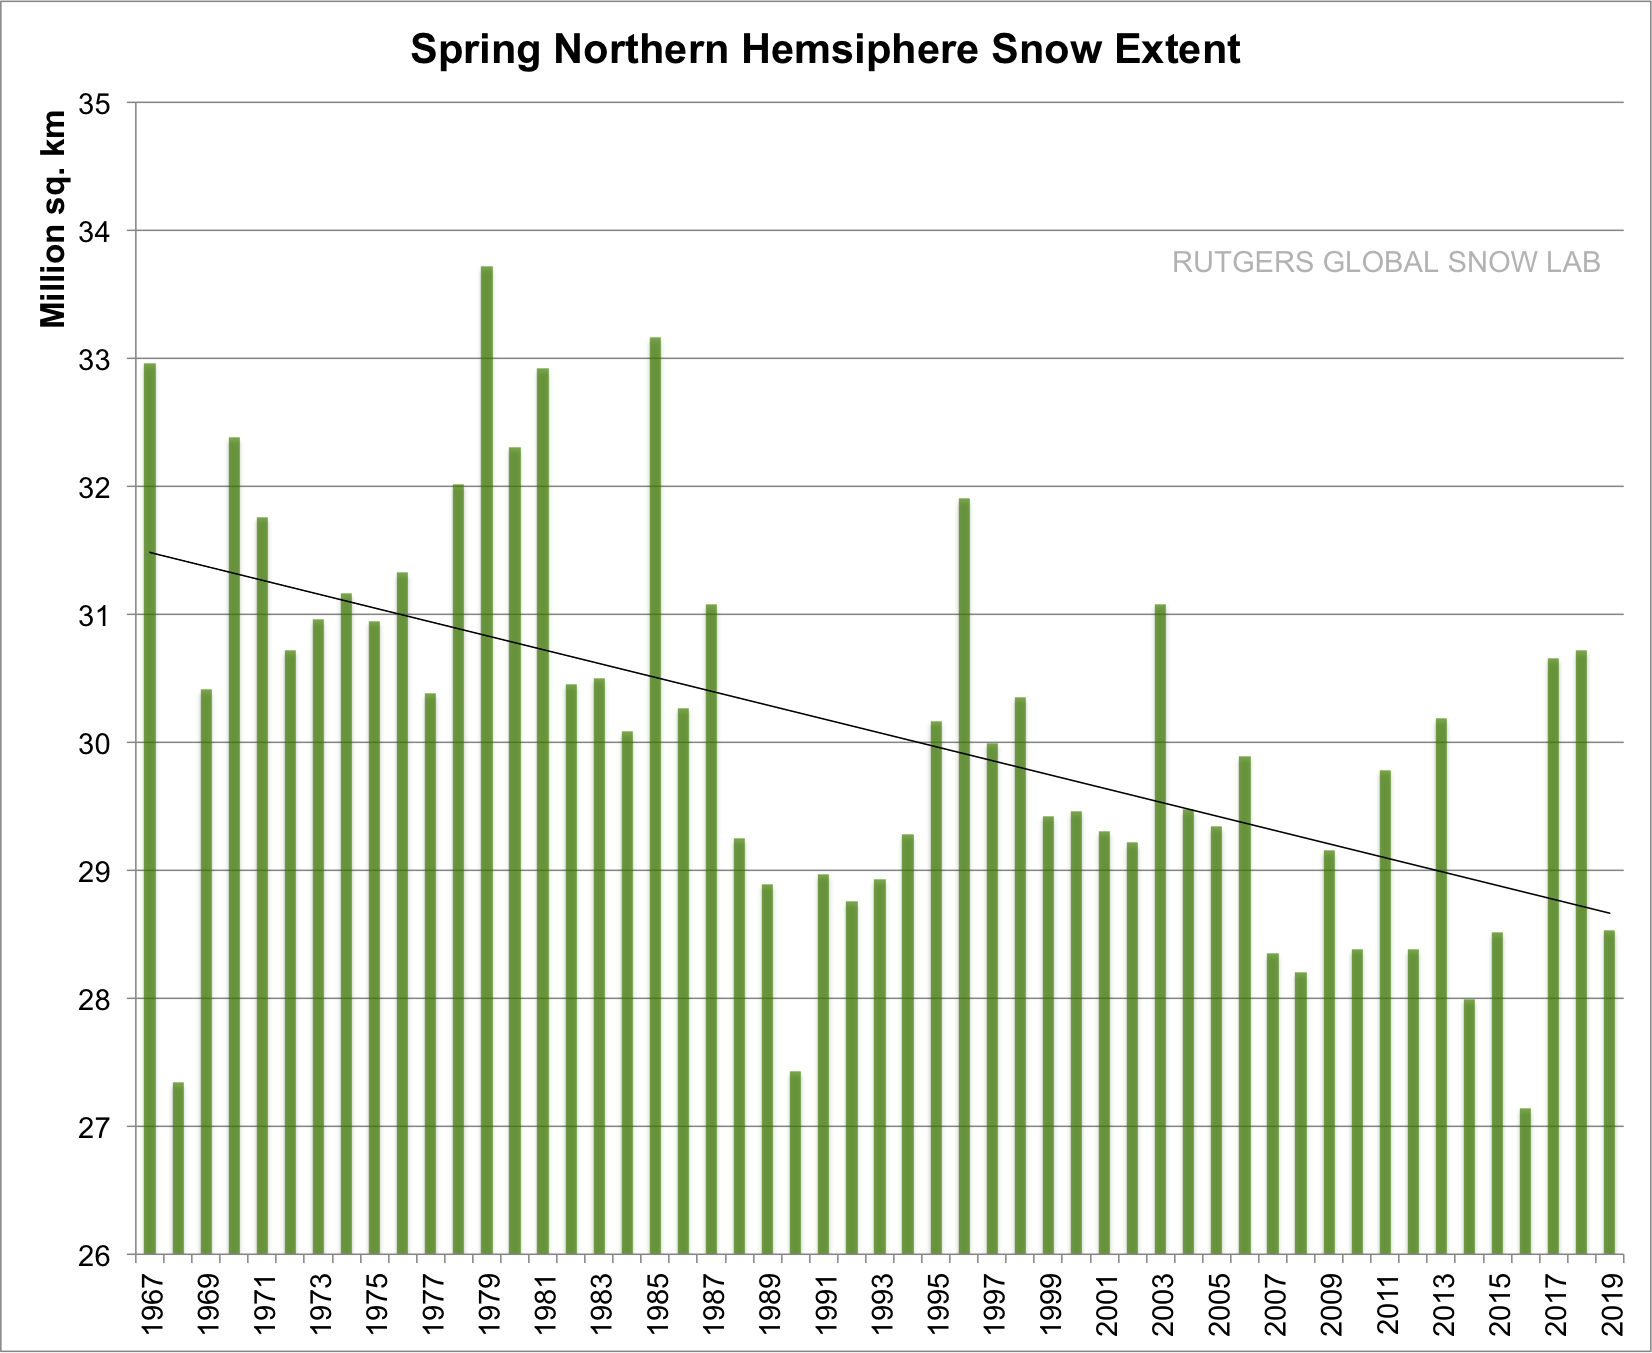
In the spring on the other hand the snow pack is melting faster, about 1.6 percent less snow per year. One of the major reasons for an earlier snow-melt is that the air is getting dirtier, especially over China, and to some extent Russia. The soot from burning coal and mining and manufacturing changes the albedo of the snow. The soot is visible on old snow all the way up to the North Pole. The other reason is that the poles are getting warmer. In the fall and winter it is mostly due to increased snowfall, but in the spring, as soon as the temperature rises over the freezing point, melting occurs.
So the warming of the poles, far from being an impending end of mankind as we know it, may even be beneficial. Warmer poles in the winter means less temperature gradient between the poles and the tropics, leading to less severe storms. They will still be there, but less severe.
There is one great benefit of increased CO2, the greening of the earth.
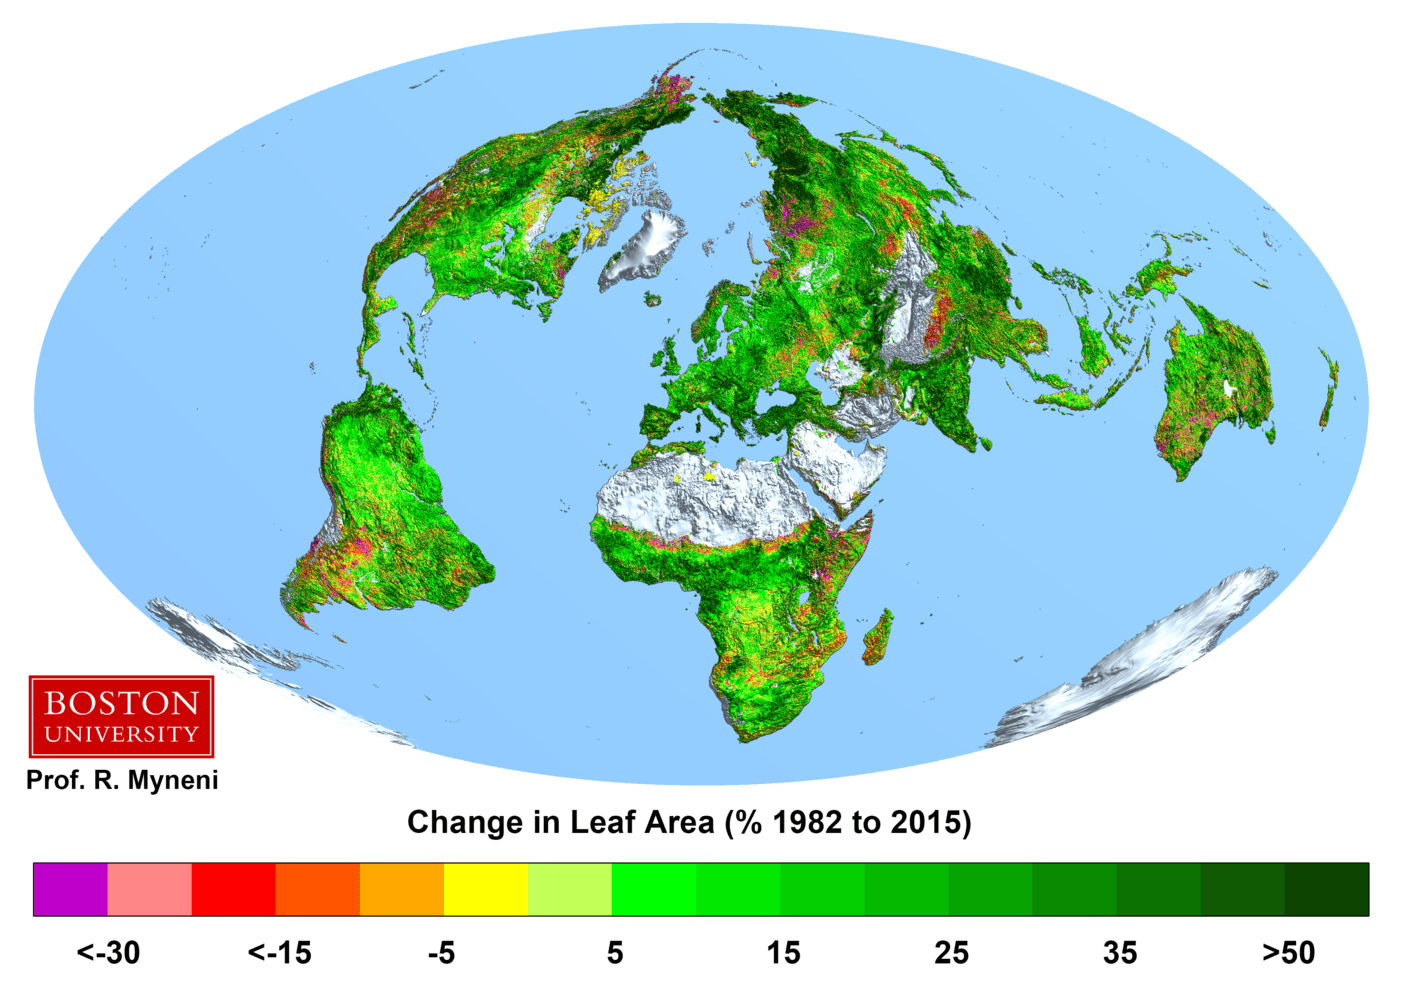
Thanks to this greening, accomplished with only the fertilizing effect of CO2, the earth can now keep another 2 billion people from starvation, not to mention what it does to plants and wildlife.
Having said that, I am still a conservationist. Coal, oil and gas will run out at some time, and I for one would like to save some for my great grandchildren, not yet born. In addition I would like to minimize the need for mining, which is quite destructive.
The best solution is to switch most electricity generation to Thorium molten salt nuclear power. There are multiple reasons why this should be done as a priority.
Here are some of them:
PPE may be unavailable or inadequate, more importantly infringes on Constitutional protections.
In most states, physicians and pharmacies face unprecedented barriers to prescribing HCQ for prevention or early treatment of COVID-19.
Prevention and early treatment is key.
HCQ is safer than other OTC drugs, including aspirin, acetaminophen, diphenhydramine, and Plan B. It is even given to pregnant women and nursing mothers as a treatment for Lupus.
HCQ has been used for more than 65 years in hundreds of millions of patients, and has been available OTC in many places.
A number of studies and the experience of many physicians show that early HCQ, especially with zinc supplements, is highly effective.
The only way to assure that powerful bureaucracies or vested interests cannot prevent patients from exercising freedom to choose is to make the drug available OTC
(AAPS) If you would rather see a lot of other people die than help solve the COVID crisis until after the election, then this is not for you, otherwise please add your name to the petition.
COLUMBUS — The Ohio Department of Health has reportedly banned the use of hydroxychloroquine in treating COVID-19. The rule goes into effect Thursday.
Ohio Department of Health spokesperson Melanie Amato made the announcement, saying the drug touted by President Donald Trump is “not an effective treatment.”
According to WHIO, the rule “prohibits selling or dispensing hydroxychloroquine and chloroquine for the treatment or prevention of COVID-19.”
This comes after a group of Doctors held “America’s Frontline Doctors Summit” in Washington, D.C., in which the medical experts praised the use of hydroxychloroquine and some said there was no need for a mask mandate or economic shutdown.
The video, which was shared by President Trump on Twitter, was pulled by Twitter, YouTube/Google and Facebook. The tech giants labeled the news conference as spreading “false information.” As an interesting aside, my previous blog entry: https://lenbilen.com/2020/07/28/the-corona-virus-cure-early-treatment-with-hydroxychloroquine-zinc-zithromax-negative-studies-all-dealt-with-late-stage-hospitalized-patients/ can only be searched by bing, duckduckgo and yahoo, but not google. I wonder why.
For as long as as it lasts, here is a comment about the discontinued video:
In Ohio there is about 25 deaths a day, and about half of them would be eliminated if HCQ was endorsed as effective if administered as early as possible a. This means that between now and election at least 1200 lives are sacrificed, all in an effort to prolong the COVID hysteria and ensure a Democratic win in November. And this is for Ohio alone! Forty-four states have limitations on HCQ use to treat Covid-19 as an out patient.
Updated: The next day GOP Ohio Gov. Mike DeWine reportedly urged the state’s pharmacy board to withdraw a proposed ban of hydroxychloroquine and chloroquine for use as coronavirus treatments.
Under the proposed ban, pharmacies, clinics and other medical institutions would’ve been prohibited from dispensing or selling the drugs to treat COVID-19. But in an announcement Thursday, the pharmacy board pulled back the regulation change, stating it would reexamine the issue.
