Supreme Court decided: No deal;
The Green New Deal they did repeal.
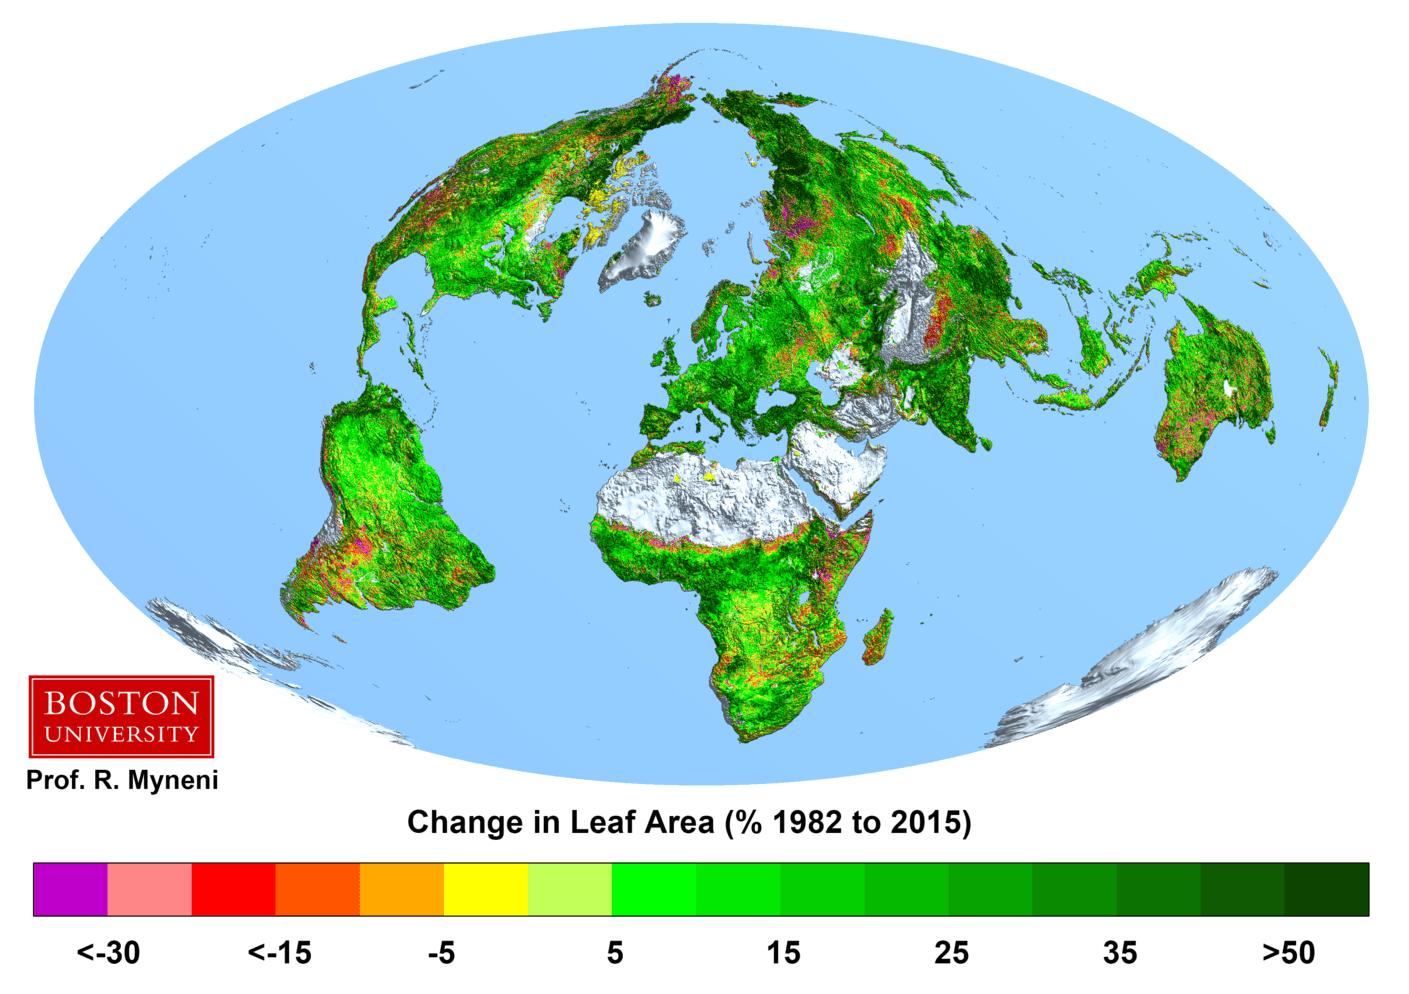
CO2, it is good;
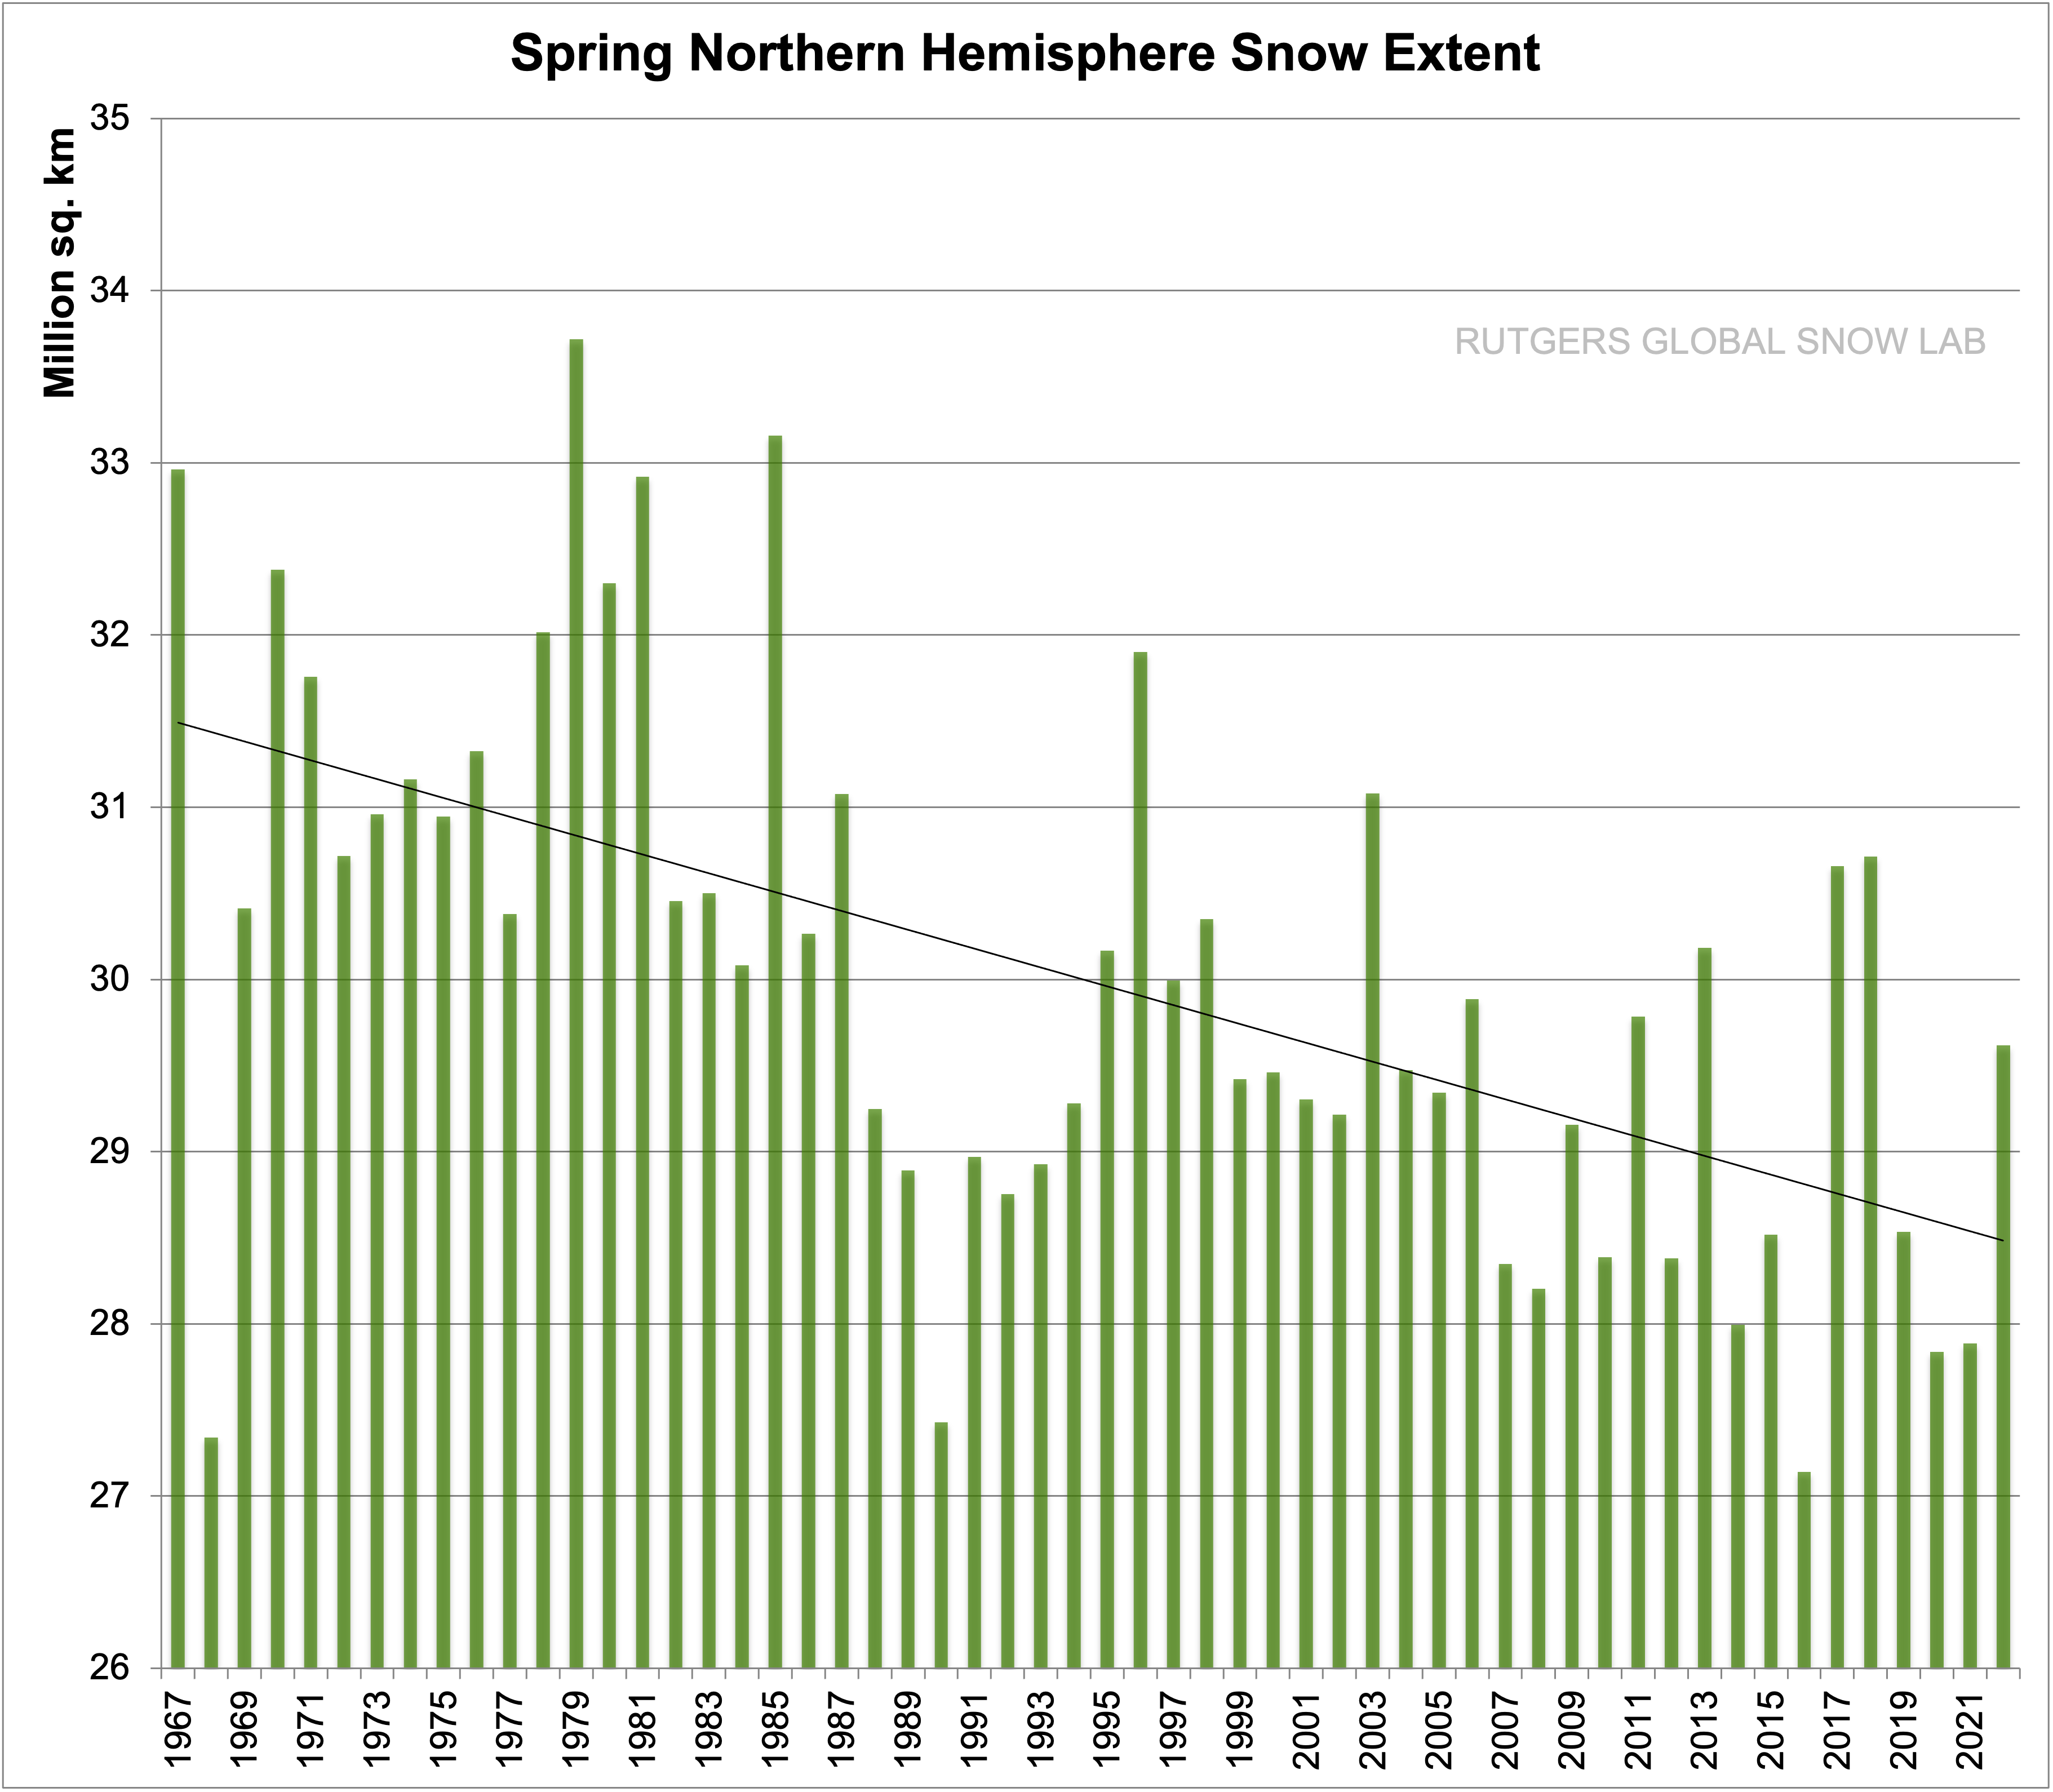
Greens the Earth, makes more food.
The bureaucrats cannot appeal.
While Climate Change is real, I have in a previous blog explained why rising CO2 levels cannot be even a major cause of Climate change, see here Now, if CO2 isn’t it, then what is?
Before we go any further this is my recollection of how we got to where we are today in trying to save the earth with legislation.
When I came to the U.S.A. in 1968 as an immigrant and resident alien I was appalled at the lack of environmental concern. In my native Sweden we had been very concerned for many years about the lacing of seed grain with Mercury as a preservative. The rivers and lakes had been fertilized four times more than agricultural land, the rivers from the Soviet Union and Poland were full of untreated sewage, so much so that the Baltic Sea was in danger of losing its Oxygen. Things were much worse in the U.S. In Lake Ontario the dead fish piled up on what used to be a good beach, and in Lake Erie the situation was even worse, a tributary river caught fire. When pointing out the stench from all the rotting fish one coworker just said: You think this is bad; in WW II the upper Delaware Bay was so polluted from all the refineries that it stripped the paint off the ships that came into Philadelphia harbor. In those days companies just dumped the parts that were left after refining into the river, and to get the air pollution bearable they built higher and higher smokestacks to dilute the pollution over a larger area.
The lawmakers had been concerned about the environment for quite some time, and in 1963 they passed the Clean Air Act. It was slow in being enacted so they decided to promote the importance of clean air (and clean water), so they decided to promote the cause with an Earth Day. The day chosen was to coincide with the 100th anniversary of Lenin’s birth, April 22, 1970. (See here). At that time the greatest concern was the impending ice age unless we cleaned up the air. Worldwide temperature would drop by ten degrees by the year 2000 unless the air was cleaned up. They forced the coal plants to install Sulfur scrubbers, and the trout fishes no longer died, and temperatures started rising again.
Many years ago, around 1977 Dr. James Lovelock bought a number of HP Gas Chromatographs to set up in the most remote corners of the earth to study pollution (especially CFC’s) and its effect on the climate. What he found was an unexpectedly large amount of dimethylsulphide (DMS). He was then a paid consultant for Hewlett Packard Analytical, so he came over from his native England a couple of times a year, always willing to hold a seminar for us engineers working at Hewlett Packard, and then joining us for lunch and continue discussion on a wide range of topics, and at one of them he sprung “Daisy-world” on us before it was published, mostly to see if we could poke holes in his hypothesis. It involved a world that consisted of only two flowers, black daisies and white daisies. The computer simulation started out with a cold world and a weak sun. The sun warmed up until suddenly black daisies appear and cover the earth. This warms the earth some more and white daisies appear. As the sun varies in intensity the mix of white and black daisies changes and this keeps the earth at a stable temperature, as they have different reflective properties. He then went on to say that the whole earth is like a living organism.
Some time later he presented the paper and the next year we asked him how it was received. “You won’t believe it”, he answered. ”Now there are people who actually believe the earth is a living organism. They demand follow-up articles that justifies their belief.” He had partly himself to blame, the name he chose was the GAIA hypothesis, Gaia being the Mother earth Goddess. He succumbed to their demands, and in 1979 he published the book: Gaia: A New Look at Life on Earth. Talking about religion the Mother Earth people now had their goddess, and expressions like. “The earth has a temperature” became commonplace.
In 1983 Margaret Thatcher, the conservative U.K. Prime Minister tried to close down the nationalized coal industry and defeat the Coal unions. She used the argument that CO2 was bad for the environment, and electricity should be generated by anything but coal. After a year she won the fight, and this legitimized the argument that both liberals and conservatives agreed: The major culprit is CO2, and the universal measurement of social responsibility; Carbon Footprint was born.
In the U.S.A. the pressure grew to somehow stop the rise of CO2, and the State of Massachusetts,, joined by the states of California, Connecticut, Illinois, Maine, New Jersey, New Mexico, New York, Oregon, Rhode Island, Vermont and Washington, the cities of New York, Baltimore, and Washington, D.C., the territory of American Samoa, and the organizations Center for Biological Diversity, Center for Food Safety, Conservation Law Foundation, Environmental Advocates, Environmental Defense, Friends of the Earth, Greenpeace, International Center for Technology Assessment, National Environmental Trust, Natural Resources Defense Council, Sierra Club, Union of Concerned Scientists, and the U.S. Public Interest Research Group sued the EPA for not regulating CO2 and some other greenhouse gases. The argument was that since CO2 is a pollutant does fall under the clean air act and can therefore be regulated. The case made its way up the appeals process, and on June 26, 2006, the Supreme Court granted a writ of certiorari. It stated that the CAA gives the EPA the authority to regulate tailpipe emissions of greenhouse gases. However, in the larger issue of regulating greenhouse gases in general it sent it back to lower court for further clarification. The SC denied the EPA this right, which the Appeals Court had approved. The EPA decided to go ahead and regulate Greenhouse Gases anyway, and that is what the latest Supreme court decision was all about. The EPA does not have carte blanche to regulate greenhouse gases unless it is specifically approved under the Clean Air Act. Congress must first do its job and make it part of the CAA.
Dr Lovelock is an interesting fellow, a true scientist. He grew more and more pessimistic about the future of the earth. In a March 2010 interview with The Guardian newspaper, he even said that democracy might have to be “put on hold” to prevent climate change. Then in an April 2012 interview, aired on MSNBC, Lovelock stated that he had been “alarmist”, using the words “All right, I made a mistake,” about the timing of climate change and noted the documentary An Inconvenient Truth and the book The Weather Makers as examples of the same kind of alarmism. Lovelock still believes the climate to be warming although the rate of change is not as he once thought, he admitted that he had been “extrapolating too far.” He believes that climate change is still happening, but it will be felt farther in the future. Of the claims “the science is settled” on global warming he states:
One thing that being a scientist has taught me is that you can never be certain about anything. You never know the truth. You can only approach it and hope to get a bit nearer to it each time. You iterate towards the truth. You don’t know it.
He criticizes environmentalists for treating global warming like a religion.
It just so happens that the green religion is now taking over from the Christian religion.
I don’t think people have noticed that, but it’s got all the sort of terms that religions use … The greens use guilt. That just shows how religious greens are. You can’t win people round by saying they are guilty for putting (carbon dioxide) in the air.
In the MSNBC article Lovelock is quoted as proclaiming:
The problem is we don’t know what the climate is doing. We thought we knew 20 years ago. That led to some alarmist books – mine included – because it looked clear-cut, but it hasn’t happened.
The climate is doing its usual tricks. There’s nothing much really happening yet. We were supposed to be halfway toward a frying world now.
The world has not warmed up very much since the millennium. Twelve years is a reasonable time … it (the temperature) has stayed almost constant, whereas it should have been rising – carbon dioxide is rising, no question about that.
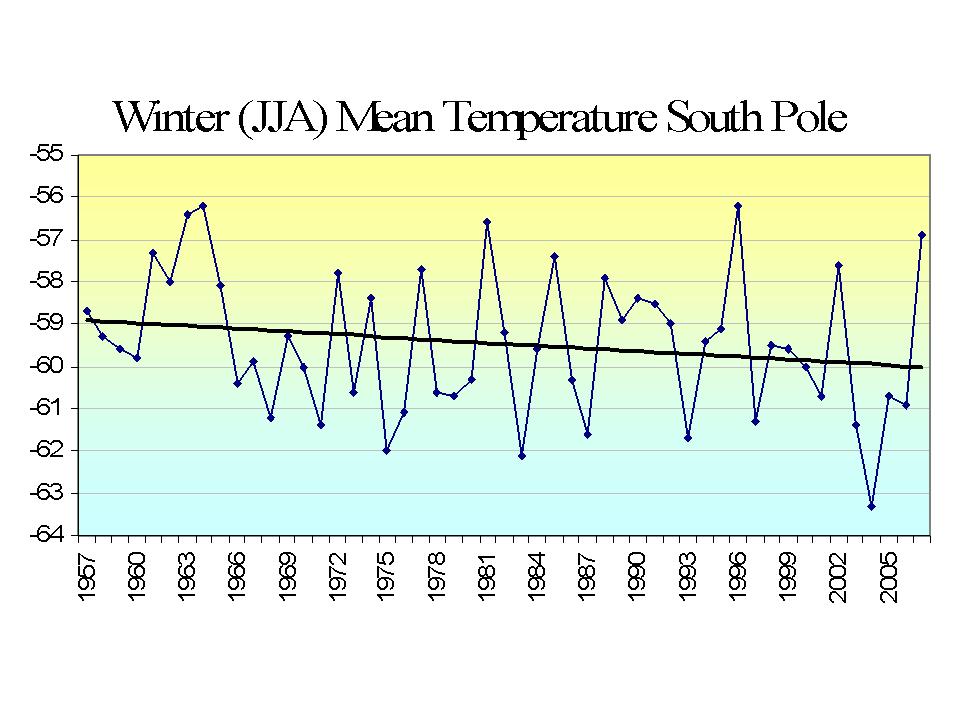
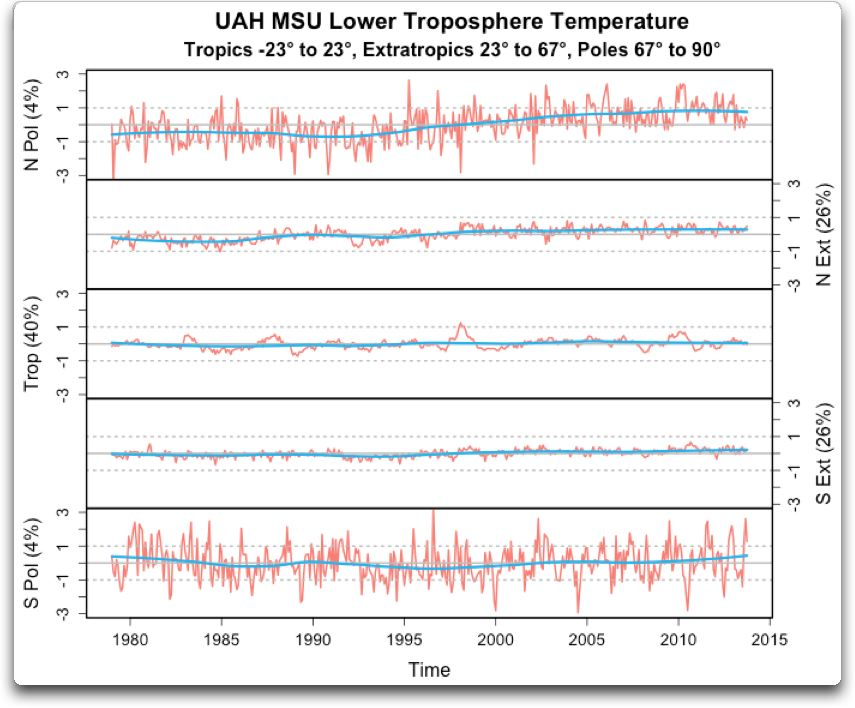
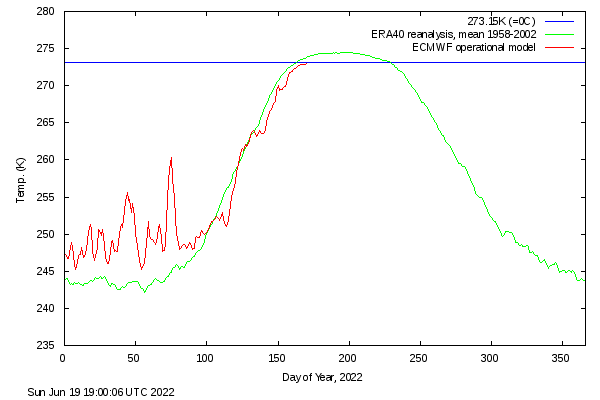
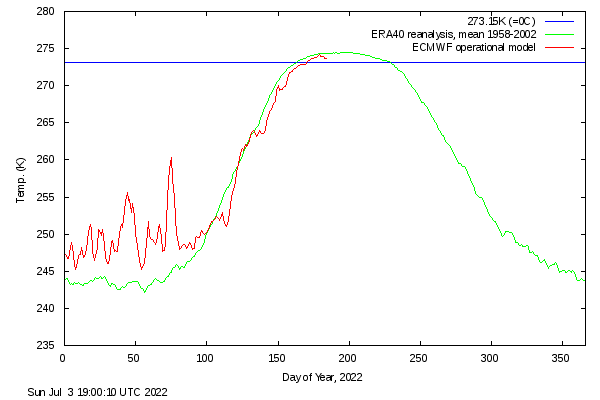
Yes, Dr. Lovelock is still alive at age 102. He was the first to discover the CFC over all the world, but he also found an unexpected amount of dimethylsulphide (DMS) in the atmosphere, and that acted as a condensation point for cloud formation. The concentration was highest in areas rich in nitrates and other “fertilizers” that had been released into the ocean from rivers. The South ocean had the least DMS, while areas with many river outlets had the most. He drew the conclusion that he had been an alarmist. The temperatures are not rising anywhere near as fast as climate models have forecast. We have now 64 years of good temperature data to prove it.
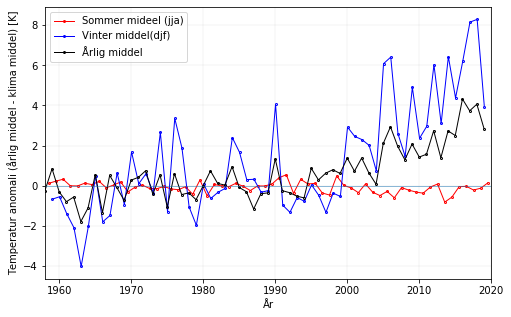
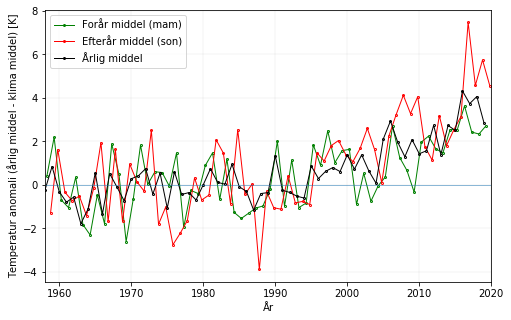
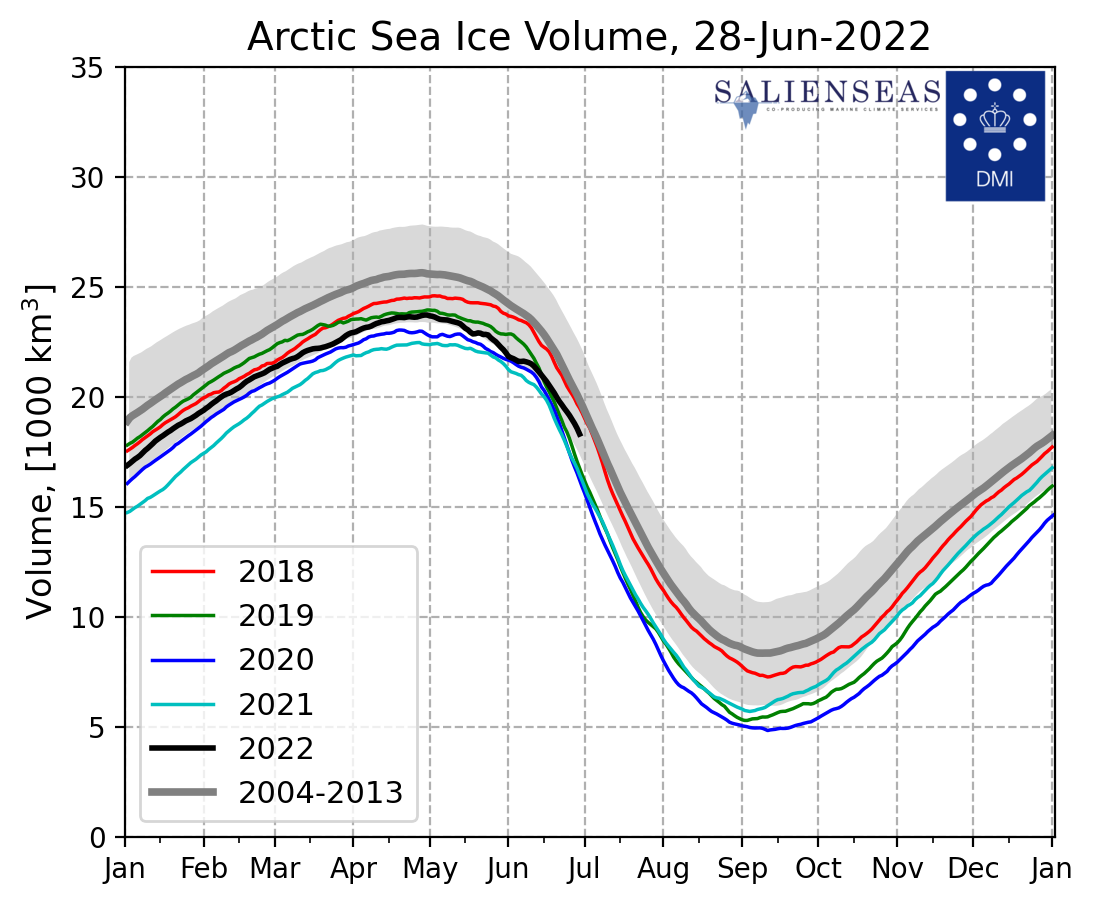
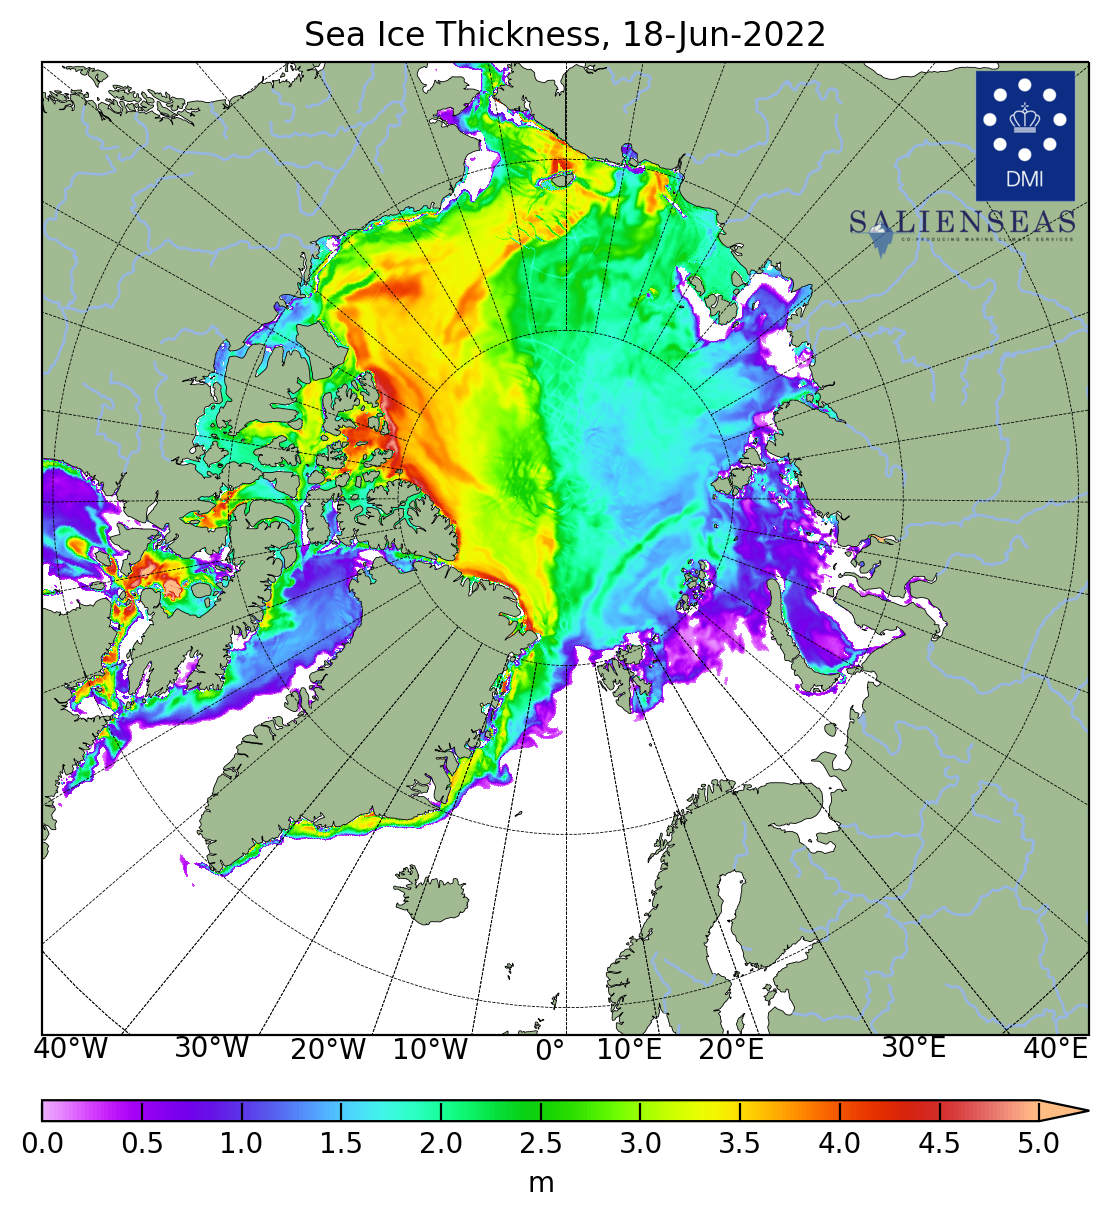
in the South Ocean around Antarctica there is very little DMS, and the South Pole winters, with rising CO2 levels being the dominant climate change factor temperatures are actually decreasing by 2 degree Celsius per century. This would mean we are in a world-wide cooling trend, looking forward to the next ice age. Since base temperatures are getting colder, areas with less rivers fertilizing the oceans will experience less rain, such as the American West coaast from south of San Francisco bay to Santiago de Chile will experience drying conditions, the Mexican Gulf, the Eastern Atlantic, the North Sea, and especially the China east coast and the South china Sea will experience increased precipitation. Because of increased cloudiness the Arctic winters will be warmer, but the Arctic Summers will be marginally cooler above 80 degrees. Source DMI
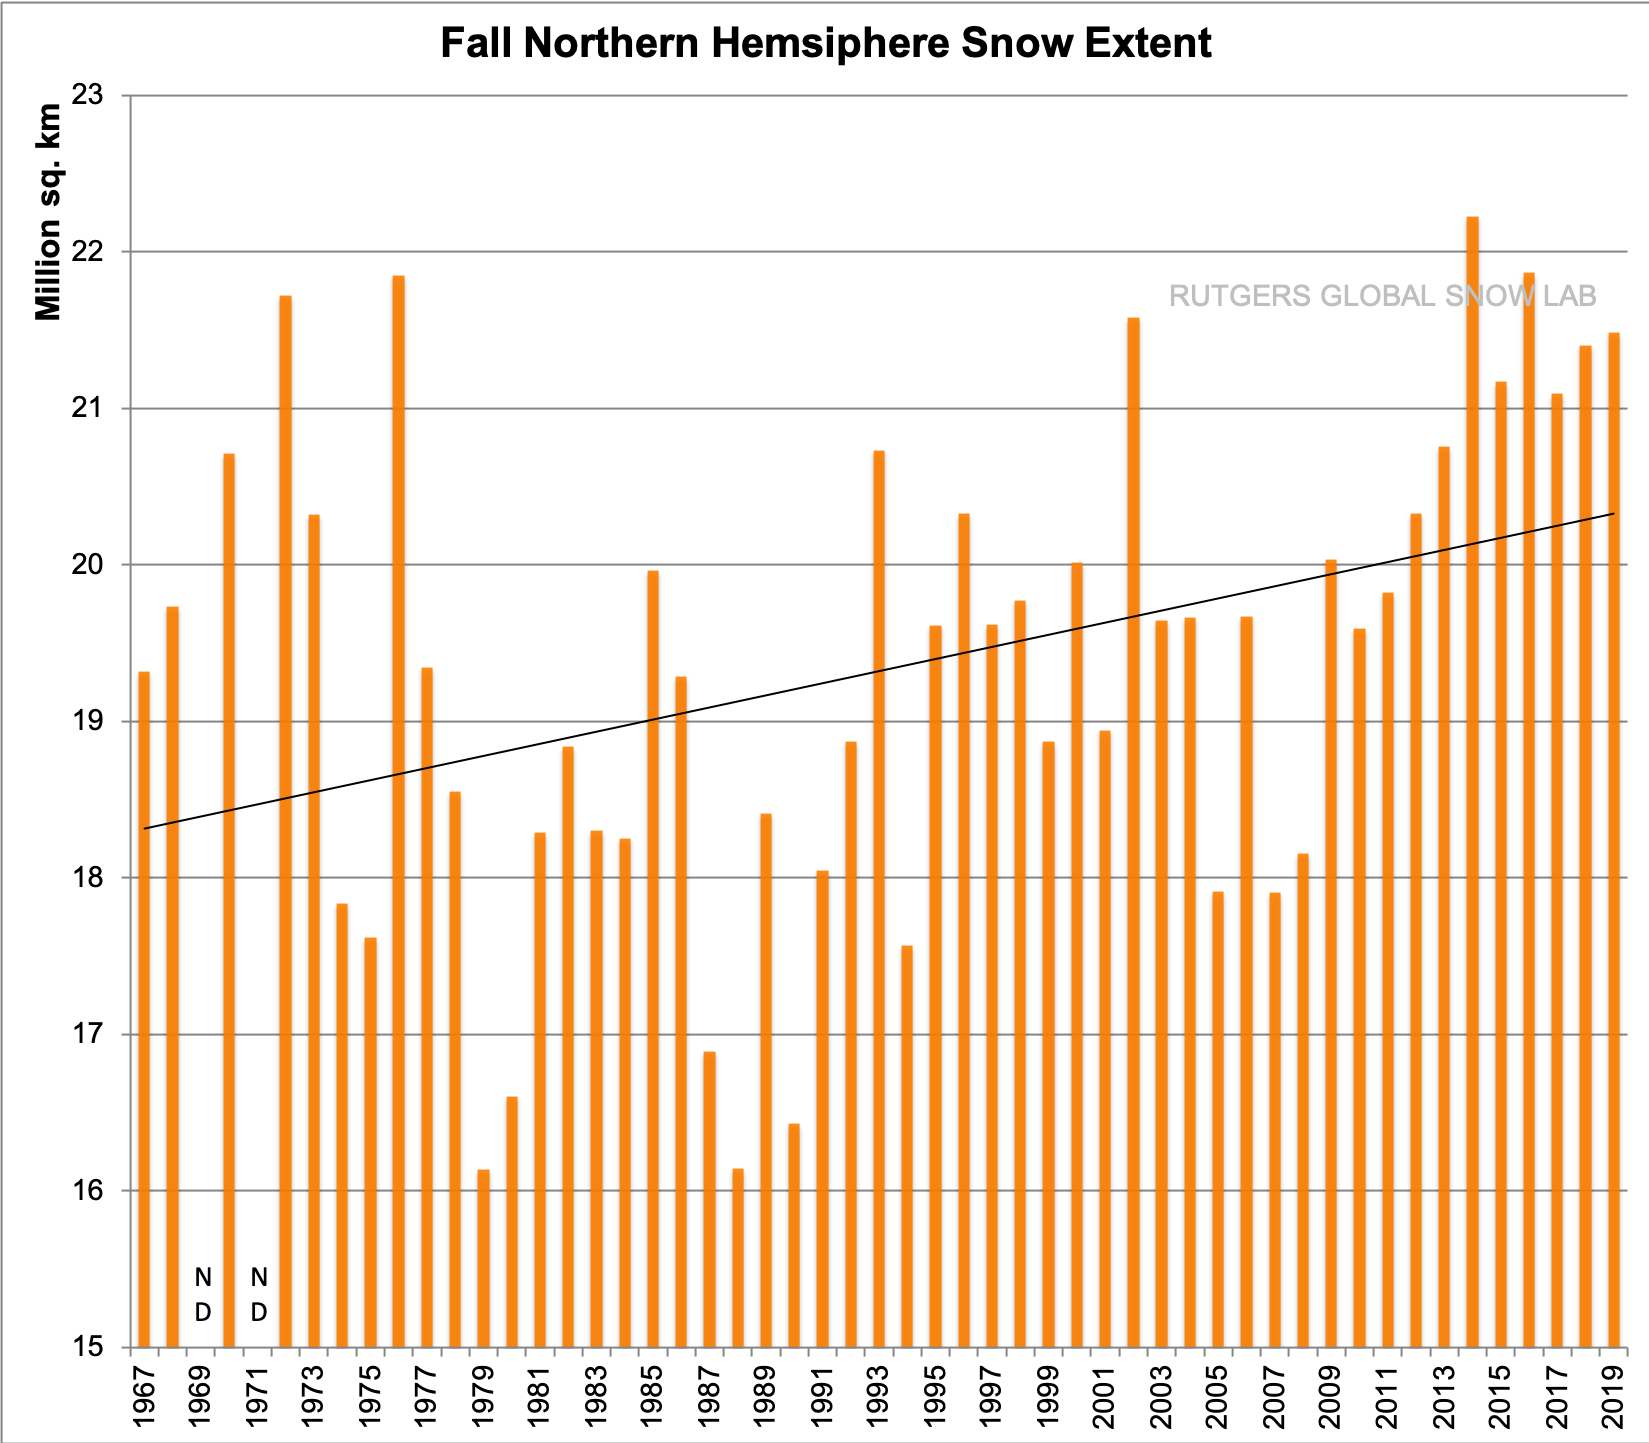
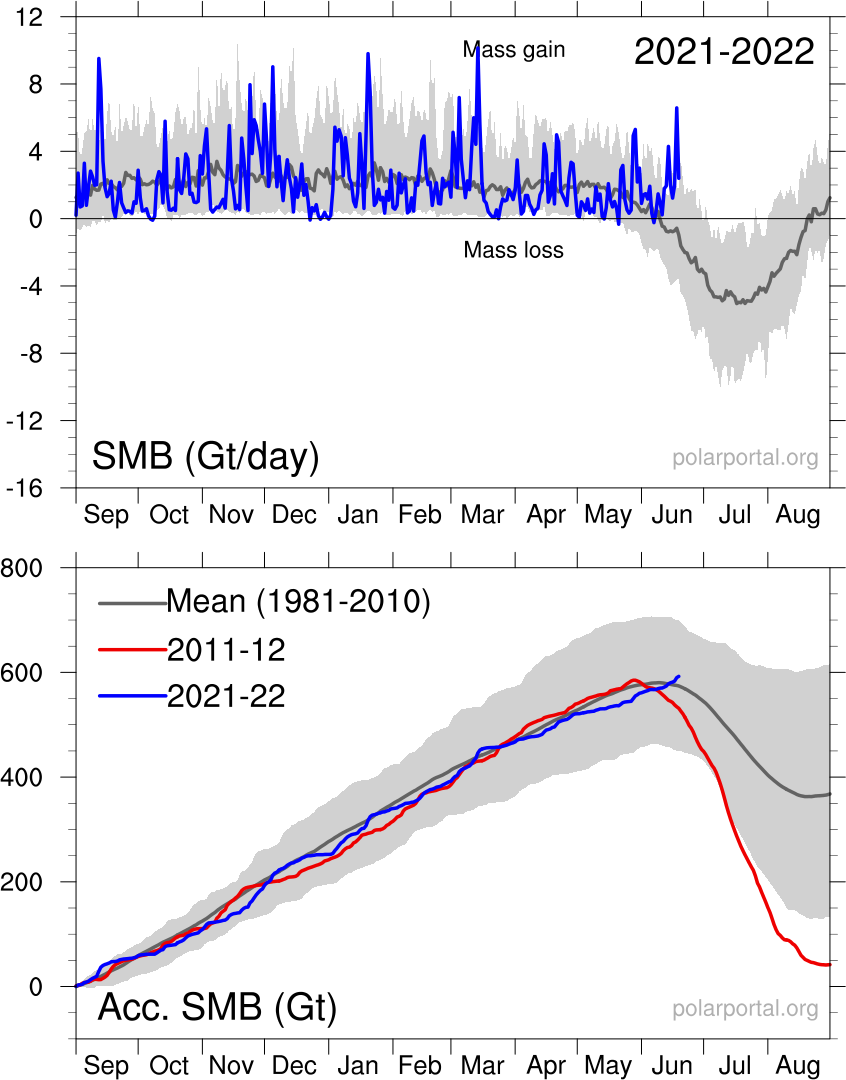
Greenland is starting to accumulate ice again:

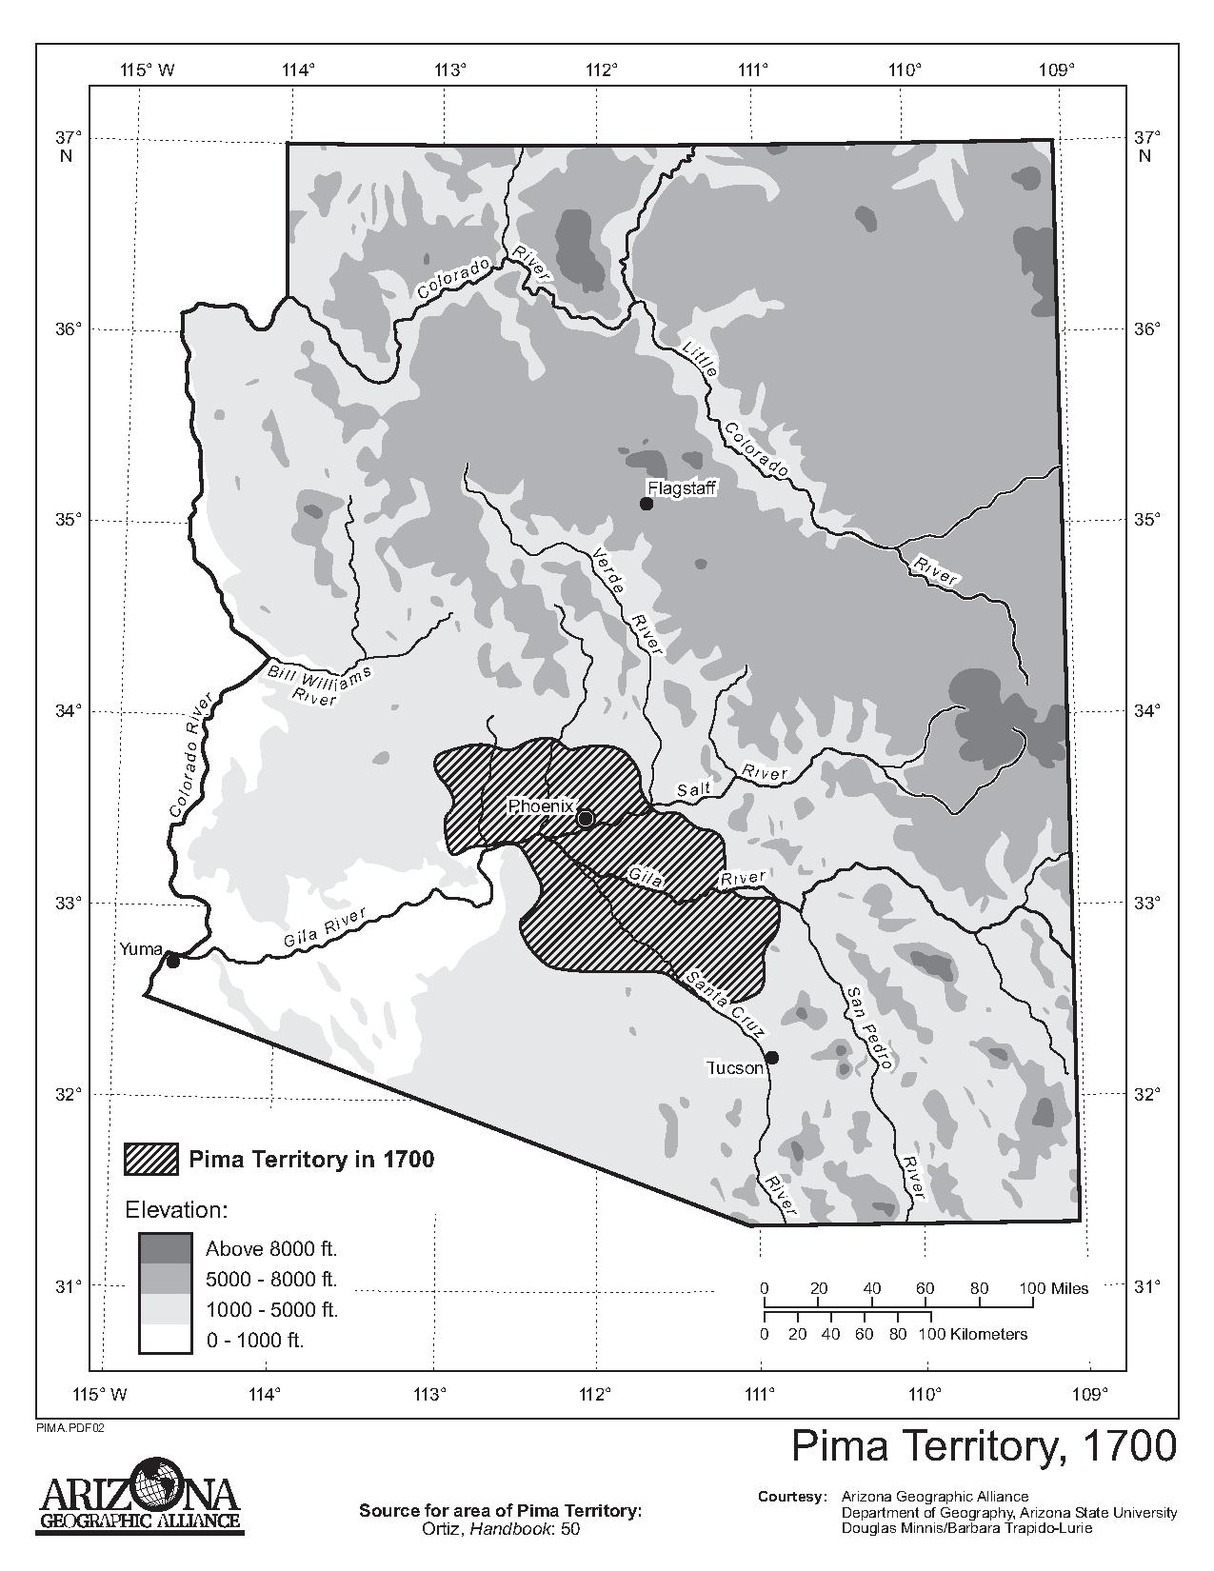
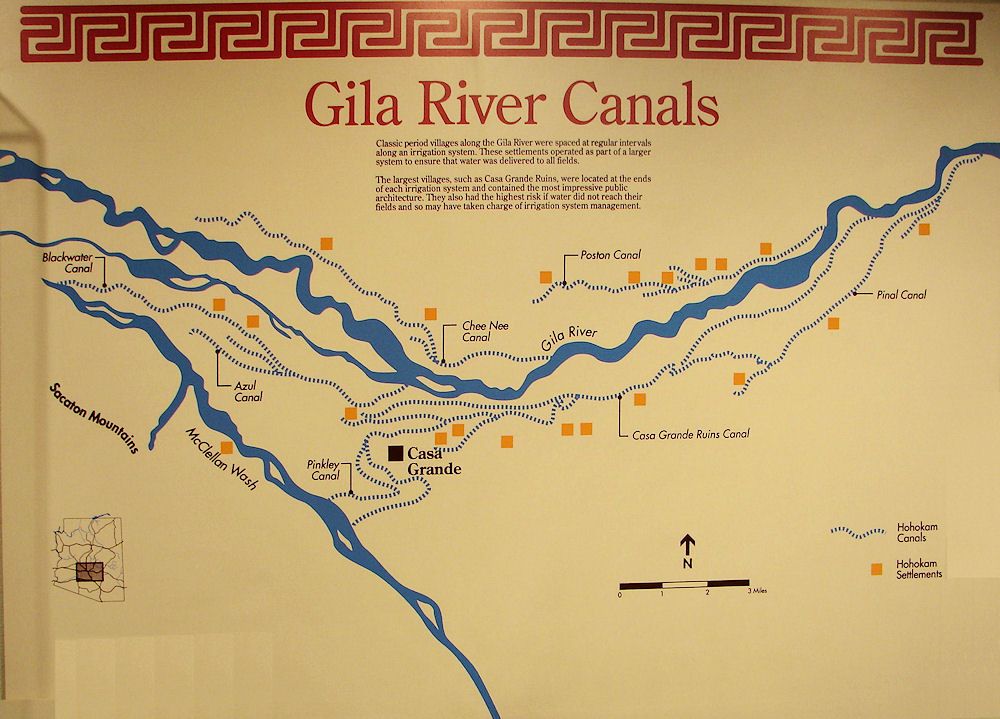
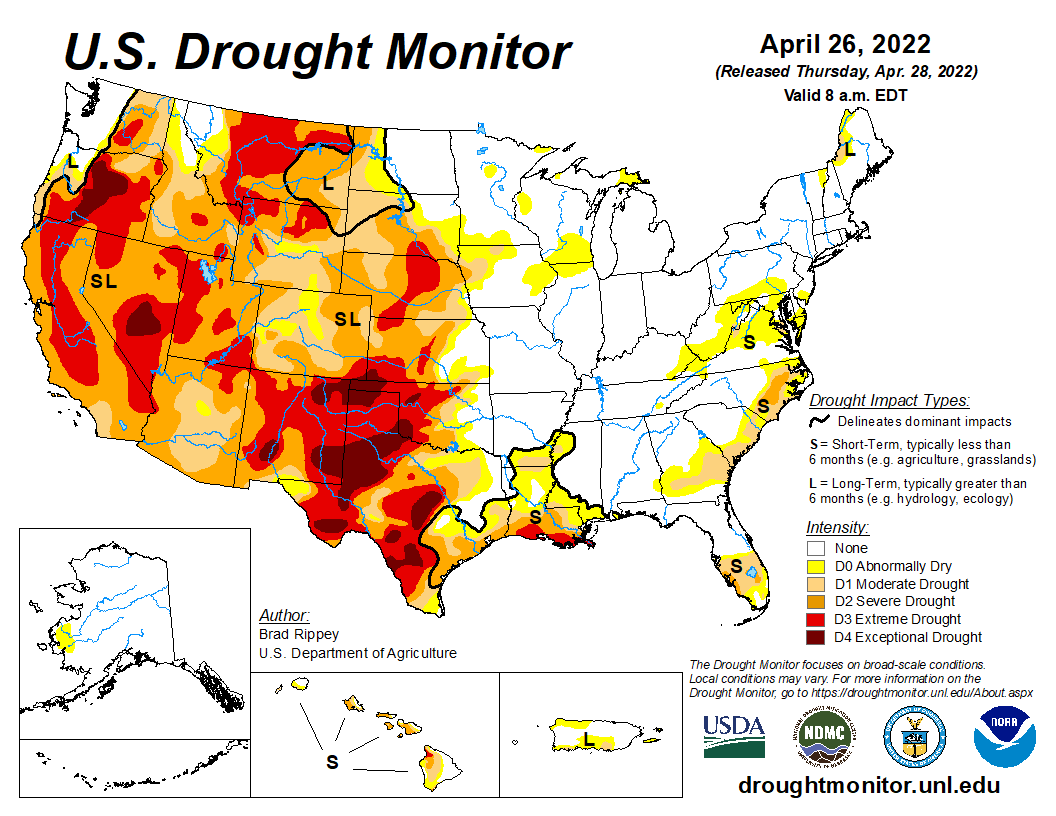
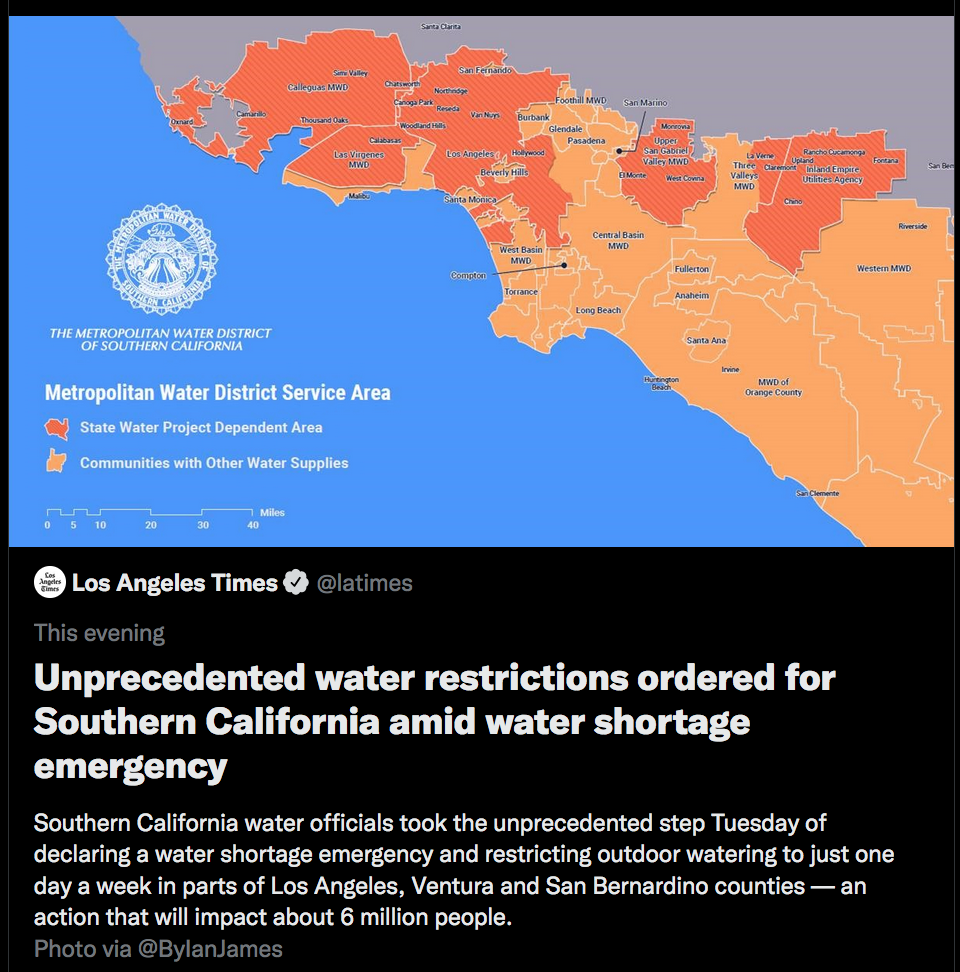
But for the American South West the situation is bleak. Not only is precipitation expected to decrease, the aquifers are being depleted, lake Mead Lake Powell are at about 30% of capacity, in a few years they will be depleted altogether. Lake San Carlos, which supplies the Phoenix area has been empty since April, no water at all flows down Gila river, wells are starting to run dry. When this happens desertification sets in, erosion increases, springs dry up. When it rains it results in the form of flash floods that further increases erosion. This is a disaster in making.
Yet, there is hope. I am making a proposal:
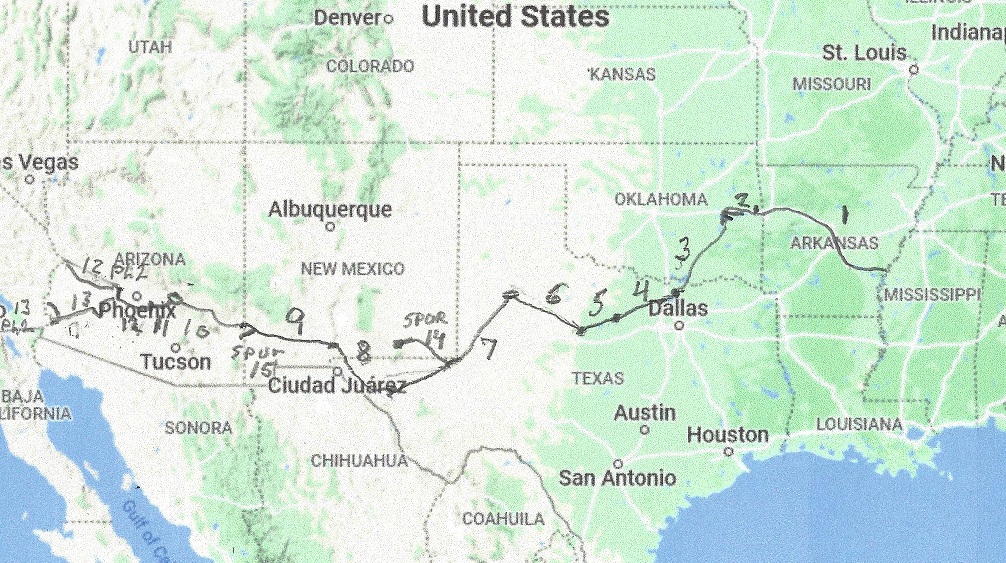
Build a TransContinental Aqueduct. This will solve the water needs for the upper Western Texas, New Mexico, Arizona, lower California, Mexico and the Lower Colorado River basin.
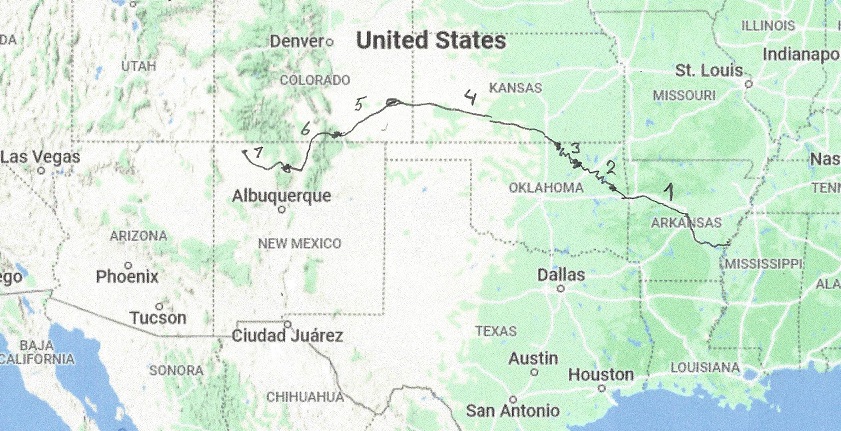
Build a Trans-Rocky Mountain aqueduct. This will solve some of the water needs for Oklahoma, Kansas, Colorado, upper New Mexico and the Upper Colorado river basin.
Build a South Platte River aqueduct. This will solve the water needs for the greater Denver ares and help preserve the northern Ogallala aquifer.
In further blog entries I will further develop what has to be done.
I will leave you with this teaser: