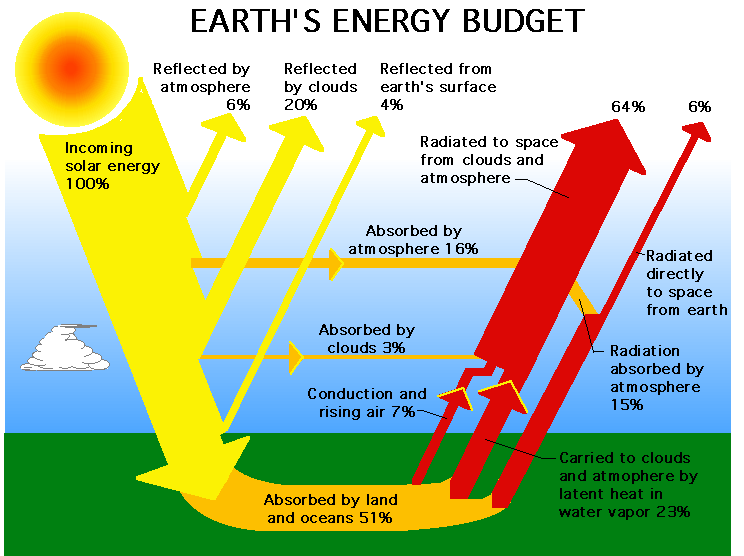
By far, the strongest greenhouse gas is water vapor, not because it is very strong of itself, but it absorbs nearly all outgoing energy in the infrared spectrum except in the so called atmospheric window, where it only partially absorbs. Yet water vapor is missing from the IPCC calculations. Instead is put in a forcing multiplier to account for the water vapor
IPCC has consistently treated the effect of greenhouse gasses as additive, but it is impossible to absorb more than 100% of all emitted energy for a given wavelength. This leads to an overestimation of absorption when 2 or more gases are present. For example, if CO2 absorbs 90% of available energy at 13 μm and water vapor another 50%, the sum is 90% + (1 -0.9} * 0.5 = 95%, not 140%. To see more how the calculations are made, see here.
We have valid satellite data from 1979, and they give very good global averages. so as a test I took a quick look at the temperature rise from 1980 to 2022 and compared what the rise would be, if all greenhouse and other factors would add up to, and to my surprise the result came within 4% of real data, see here.
Between 2022 and 2050 CO2 concentration is expected to increase from 415 ppm to 460 ppm and Methane from 1.9 ppm to 2.23 ppm. these are the most important greenhouse gases after water vapor. The calculations are here.
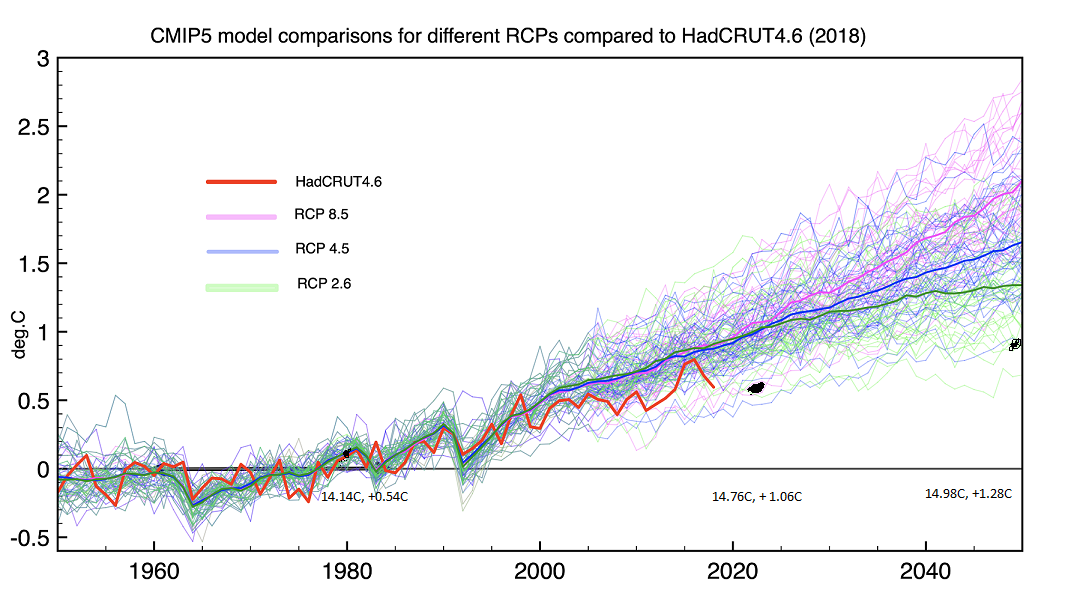
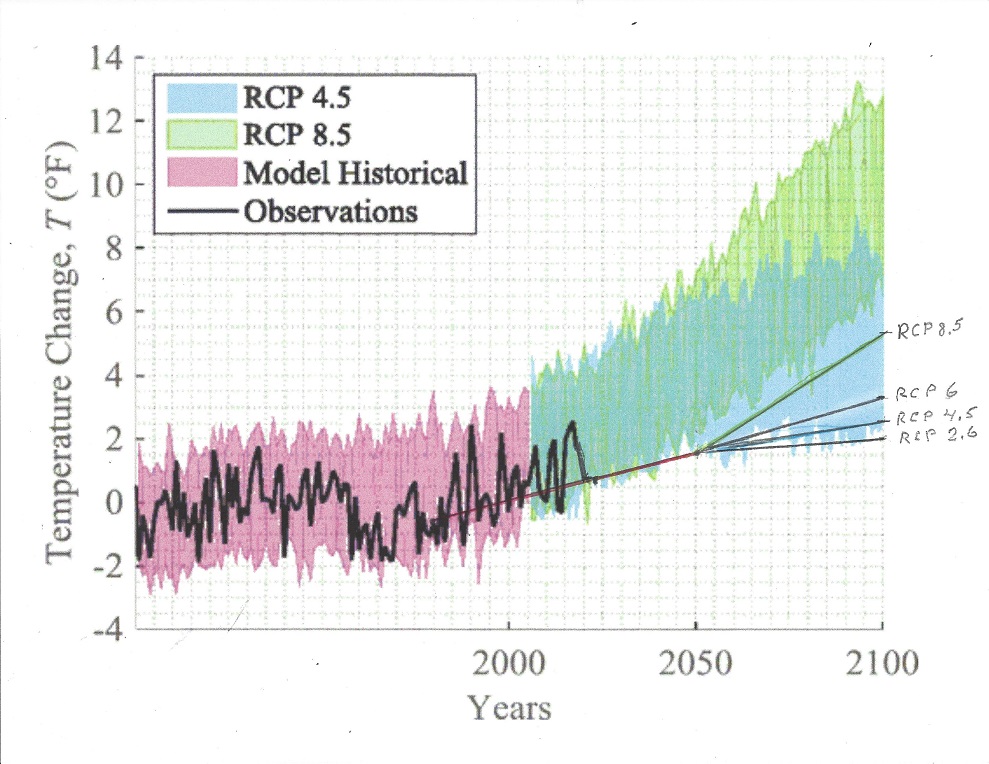
Extended to 2100 IPCC has given 4 scenarios for future temperature development. RCP 8.5 assumes that all future energy growth is provided by fossil fuel, and at least most nuclear energy is phased out. the 8.5 stands for W/m2 for CO2 increase as per IPCC calculation. See further here.
RPC 6 and RPC 4.5 are intermediate stages , while RPC 2.6 achieves net CO2 decline by 2100, but still rising temperature. Here is a figure for the different scenarios.
Calculations:
Scenario 1: RCP 8.5, CO2 1370 ppm, CH4 4 ppm, N2O+20%, HFC +20%, air pollutants -50%, population 12 billion, GDP 170 Trillion$ (2000)
Summary of all greenhouse effect causes for temperature rise from 2050 until 2100:
Effect from water vapor increase: 2.22 C or 10.54 W/m2;
Effect from rising CO2: 0.40C or 1.89 W/m2;
Effect from rising Methane: 0.09C or 0.43 W/m2,
Effect from rising N2O: 0.005C or 0.024 W/m2
Effect from rising Ozone: 0.0005C or 0.002 W/m2
Effect from rising HFCs : 0.006 C or 0.027 W/m2
TOTAL TEMPERATURE CHANGE 2050 to 2100: 2.72 C or 12.9 W/m2
Summary of all non-greenhouse effect causes for climate change from 2050 to 2100:
Long term warming of the sun: 0.0000005C
Temperature decrease from the Milankovitch cycle: – 0.02C or – 0.10 W/m2
Temperature increase from changing solar spot activity + 0.007 C or 0.033 W/m2
Temperature rise from decreasing cloud cover of 0.05 C or 0.24 W/m2.
Change from temperature rise of the Arctic 0.05 C or 0.24 W/m2
Pollution aerosols cause a temperature decrease of – 0.03 C or – 0.12 W/m2
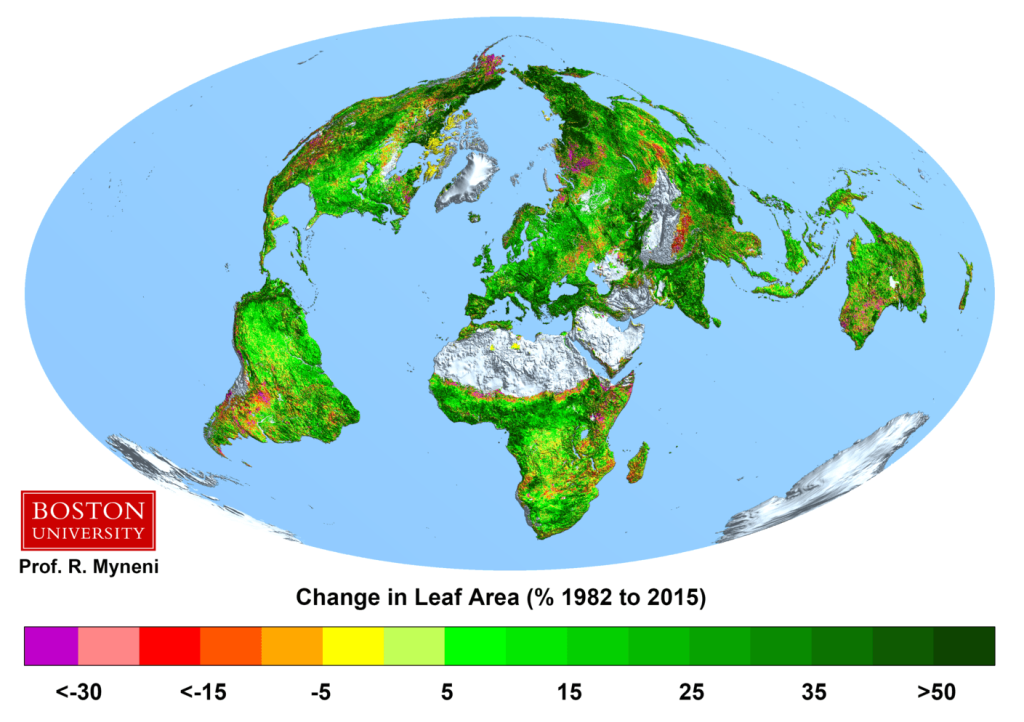
Temperature increase from greening of the earth 0.004C or 0.020 W/m2
Temperature decrease from areas of desertification – 0.001C or 0.005 W/m2.
TOTAL TEMPERATURE RISE FROM OTHER THAN GREENHOUSE GASES FROM 2050 to 2100: 0.060 C or 0.308 W/m2
TEMPERATURE CHANGE FROM 2050 TO 2100 FROM ALL CAUSES: 2.78 C or 13.2 W/m2
Scenario 2: RCP 6.5, CO2 850 ppm, CH4 1.9 ppm, N2O-10%, HFC +20%, air pollutants -50%, population 9.5 billion, GDP 160 T$
Summary of all greenhouse effect causes for temperature rise from 2050 until 2100:
Effect from water vapor increase: 1.28C or 5.95 W/m2;
Effect from rising CO2: 0.20 C or 0.93 W/m2;
Effect from falling Methane: – 0.02C or 0.08 W/m2,
Effect from rising N2O: 0.001C or 0.005 W/m2
Effect from rising Ozone: 0.0005C or 0.002 W/m2
Effect from rising HFCs : 0.006 C or 0.027 W/m2
TOTAL TEMPERATURE CHANGE 2050 to 2100: 1.4665 C or 6.83 W/m2
Summary of all non-greenhouse effect causes for climate change from 2050 to 2100:
Long term warming of the sun: 0.0000005C
Temperature decrease from the Milankovitch cycle: – 0.02C or 0.10 W/m2
Temperature increase from changing solar spot activity + 0.007 C or 0.033 W/m2
Temperature rise from decreasing cloud cover of 0.05 C or 0.24 W/m2.
Change from temperature rise of the Arctic 0.05 C or 0.24 W/m2
Less pollution aerosols cause a temperature increase of 0.05 C or 0.24 W/m2
Temperature increase from greening of the earth 0.002C or 0.010 W/m2
Temperature decrease from areas of desertification – 0.001C or 0.005 W/m2.
TOTAL TEMPERATURE RISE FROM OTHER THAN GREENHOUSE GASES FROM 2050 to 2100: 0.138 C or 0.658 W/m2
TEMPERATURE CHANGE FROM 2050 TO 2100 FROM ALL CAUSES: 1.6 C or 7.5 W/m2
Scenario 3: RCP 4, CO2 650 ppm, CH4 2.0 ppm, N2O-10%, HFC 0%, air pollutants -50%, population 8.7 billion, GDP 280 T$
Summary of all greenhouse effect causes for temperature rise from 2050 until 2100:
Effect from water vapor increase: 0.88 C or 4.19 W/m2;
Effect from rising CO2: 0.08 C or 0.40 W/m2;
Effect from stable Methane: 0.0 C or 0.0 W/m2,
Effect from falling N2O: 0.004C or 0.02 W/m2
Effect from stable Ozone: 0.0 C or 0.0 W/m2
Effect from stable HFCs : 0.0 C or 0.0 W/m2
TOTAL TEMPERATURE CHANGE 2050 to 2100: 0.964C or 4.61 W/m2
Summary of all non-greenhouse effect causes for climate change from 2050 to 2100:
Long term warming of the sun: 0.0000005C
Temperature decrease from the Milankovitch cycle: – 0.02C or 0.10 W/m2
Temperature increase from changing solar spot activity + 0.007 C or 0.033 W/m2
Temperature rise from decreasing cloud cover of 0.05 C or 0.24 W/m2.
Change from temperature rise of the Arctic 0.05 C or 0.24 W/m2
Pollution aerosols cause a temperature increase of 0.05 C or 0.24 W/m2
Temperature increase from greening of the earth 0.002C or 0.010 W/m2
Temperature decrease from areas of desertification – 0.001C or 0.005 W/m2.
TOTAL TEMPERATURE RISE FROM OTHER THAN GREENHOUSE GASES FROM 2050 to 2100: 0.135 C or 0.658 W/m2
TEMPERATURE CHANGE FROM 2050 TO 2100 FROM ALL CAUSES: 1.1 C or 5.3 W/m2
Scenario 4: RCP 2.6, CO2 490 ppm, CH4 1.5 ppm, N2O-15%, HFC -10%, air pollutants -75%, population 9 billion, GDP 320 T$
Summary of all greenhouse effect causes for temperature rise from 2050 until 2100:
Effect from water vapor increase: 0.55 C or 2.55W/m2;
Effect from rising CO2: 0.02C or 0.07 W/m2;
Effect from declining Methane: – 0.01C or 0.06 W/m2,
Effect from stable N2O: 0.0 C or 0.0 W/m2
Effect from stable Ozone: 0.0 C or 0.0 W/m2
Effect from stable HFCs : 0.0 C or 0.0 W/m2
TOTAL TEMPERATURE CHANGE 2050 to 2100: 0.56 C or 2.56 W/m2
Summary of all non-greenhouse effect causes for climate change from 2050 to 2100:
Long term warming of the sun: 0.0000005C
Temperature decrease from the Milankovitch cycle: – 0.02C or 0.10 W/m2
Temperature increase from changing solar spot activity + 0.007 C or 0.033 W/m2
Temperature rise from decreasing cloud cover of 0.02 C or 0.10 W/m2.
Change from temperature rise of the Arctic 0.05 C or 0.24 W/m2
Pollution aerosols cause a temperature increase of 0.08 C or 0.36 W/m2
Temperature increase from greening of the earth 0.002C or 0.010 W/m2
Temperature decrease from areas of desertification – 0.001C or 0.005 W/m2.
TOTAL TEMPERATURE RISE FROM OTHER THAN GREENHOUSE GASES FROM 2050 to 2100: 0.138 C or 0.64 W/m2
TEMPERATURE CHANGE FROM 2050 TO 2100 FROM ALL CAUSES: 0.70 C or 3.2 W/m2
The temperature data from 1980 to 2022 is the control group, and is based on real data.It was then the basis for doing the 2022 to 2050 calculation assuming no mitigation efforts, the most likely result if none of the Paris accord is implemented. The climate target is to stay under + 1.5 C, and this model, that worked better than 95% accurate between 1980 and 2022, comes up with a temperature rise of 1.28C, well below the 1.5C maximum rise since the 1800s