Amnesty by my decree,
myself an alien, don’t you see?
Constitutionality?
I’m Emp’ror, no laws apply to me.
And here is the whole impeachment song: (To the tune of “Please release me, let me go”)
Amnesty by my decree,
myself an alien, don’t you see?
Constitutionality?
I’m Emp’ror, no laws apply to me.
And here is the whole impeachment song: (To the tune of “Please release me, let me go”)
(To the tune of “Freight-train, freight-train” by Elizabeth Cotten)
Train-wreck, train-wreck, I despair. Train-wrecked is Obama-care.
Website broke beyond repair. It is our Obama-scare.
I’ll be lost without health-care, Go without I would not dare
My old plans don’t have a prayer, too good to be deemed fair.
Cost is more than doubled too; Gruber said: “That’s good for you”,
And his attitude comes through: “You are stupid, I fooled you”.
Crony-ism to the sky, Obama gave his reason why:
“No-one is more mad than I.” Wasn’t that a true reply?
Train-wreck, train-wreck, I despair. Train-wrecked is Obama-care.
Common sense was never there. But Obama doesn’t care.
Obama is calling for 6 million new free daycare and pre-K places so they can better educate of the children.
This is the world of modern feminism, stay home mothers contribute nothing to society, only women that “work” do.
And they claim to be pro-choice!
Of all things Obama, now this takes the cake:
“A choice we don’t want any mother to make”.
For the State knows what’s best
You can fill in the rest:
Your children are ours for a new world to make.
 Sharyl Atkisson was framed.
We planted secrets, she’ll be blamed.
But, she found out what we aimed.
A Quisling I am, but not ashamed.
And here is the whole impeachment song: (To the tune of “Please release me, let me go”)
“I’m not on the ballot this fall.”
Obama is showing some gall,
for his polices are
while they got him this far
they’re poised for a voter recall.
Fundamental transform of our land;
A banana republic at hand.
What Obama hath wrought:
From our freedoms, long fought
is defeat under his non-command.
Obama has done immense damage to our country.
I try to summarize it in the impeachment song.
On September 15 a news release was issued by NASA and confirmed by NOAA that August was the warmest August on record.
I tried to look into the data and found the source was a preliminary result of sea surface temperatures for August, which looked ominous indeed

On Sep 9 NOAA issued the following report:
It showed how the data was taken that led to the sudden rise in global temperatures.

We can clearly see the warmer and colder areas, with the read areas (warmer) totally dominating the blue (colder) areas.
However, in this data set, the temperatures in the polar regions are not included, hence conclusions are drawn from incomplete data.
When these areas are included August 2014 was not the warmest August on record, It wad the ninth warmest August and the 89th warmest month on record.
These ate the tabulated data from NASA.
 GLOBAL Temperature Anomalies in 0.01 degrees Celsius    base period: 1951-1980

                  sources: GHCN-v3 1981-08/2014 (meteorological stations only)
                    using elimination of outliers and homogeneity adjustment
                    Notes: 1941 DJF = Dec 1940 - Feb 1941 ;  ***** = missing

                                                                     AnnMean


Year   Jan  Feb  Mar  Apr  May  Jun  Jul  Aug  Sep  Oct  Nov  Dec    J-D D-N    DJF  MAM  JJA  SON  Year
1981    61   58   68   50   32   39   51   52   28   10   22   48     43  41     46   50   47   20  1981
1982    12   25   -2    3   25    5   20    9    9    2   11   40     13  14     28    9   11    8  1982
1983    51   40   46   40   48   28   21   49   57   31   32   17     38  40     44   45   33   40  1983
1984    25   16   38   17   48    5   19   27   26   22   10    4     21  22     19   34   17   20  1984
1985    32    6   26   18   23   28    7   36   26   16    9   16     20  19     14   22   24   17  1985
1986    39   50   38   41   31   16   15   21    2   12   12   20     25  24     35   37   17    9  1986
1987    43   54   24   39   30   55   59   25   35   35   31   57     41  37     39   31   46   34  1987
1988    67   49   57   50   63   60   45   56   56   53   15   36     51  52     58   57   54   41  1988
1989    27   44   47   42   22   18   47   50   53   43   21   36     38  38     36   37   38   39  1989
1990    51   42   86   62   52   46   64   43   30   53   52   47     52  51     43   67   51   45  1990
1991    49   61   48   72   42   70   63   57   61   33   31   33     52  53     52   54   63   42  1991
1992    50   40   53   26   27   30    8   13   -6    7    1   24     23  24     41   35   17    1  1992
1993    39   41   34   30   28   26   39   22   10   22    8   21     27  27     35   31   29   13  1993
1994    40    8   27   53   27   57   38   24   45   41   49   43     38  36     23   36   40   45  1994
1995    56   89   51   58   38   50   64   58   45   67   52   40     56  56     63   49   57   54  1995
1996    42   60   46   48   35   35   53   77   40   32   49   52     47  46     47   43   55   40  1996
1997    49   55   66   39   44   66   34   44   49   60   69   68     54  52     52   50   48   59  1997
1998    71  118   84   83   95  104   91   86   61   66   65   81     84  83     86   87   93   64  1998
1999    69   86   48   43   51   63   64   54   63   62   57   53     59  62     79   47   60   61  1999
2000    32   79   70   76   56   67   63   60   58   34   49   47     58  58     55   67   63   47  2000

Year   Jan  Feb  Mar  Apr  May  Jun  Jul  Aug  Sep  Oct  Nov  Dec    J-D D-N    DJF  MAM  JJA  SON  Year
2001    59   63   70   62   74   66   71   64   70   60   85   72     68  66     57   69   67   72  2001
2002    96   91  113   81   85   65   82   67   82   64   69   53     79  80     86   93   71   71  2002
2003    90   74   71   69   87   64   64   87   81   88   65   85     77  74     72   76   72   78  2003
2004    71   92   87   76   49   64   24   59   60   80   87   66     68  69     83   70   49   76  2004
2005    96   88   93   85   76   82   80   75   98  101   90   90     88  86     84   84   79   96  2005
2006    77   92   81   68   52   77   67   82   73   84   86   92     78  77     86   67   75   81  2006
2007   124   93   92   95   94   67   79   87   84   81   70   71     86  88    103   94   78   78  2007
2008    49   46   90   66   58   53   71   41   82   75   81   76     66  65     56   71   55   79  2008
2009    76   77   67   76   80   83   86   86   92   73   85   76     80  80     76   74   85   83  2009
2010    95  106  114  101   97   88   75   84   88   96  103   72     93  94     92  104   82   96  2010
2011    73   67   78   84   65   72   91   96   79   83   75   78     78  78     70   75   87   79  2011
2012    60   56   70   80   95   70   57   85   88   95   94   70     77  77     65   81   71   92  2012
2013    97   76   86   65   70   89   67   80  101   86   87   84     82  81     81   74   79   91  2013
2014    95   63   75   90  103   78   74   80 **** **** **** ****   **** ***     80   89   78 ****  2014
Year   Jan  Feb  Mar  Apr  May  Jun  Jul  Aug  Sep  Oct  Nov  Dec    J-D D-N    DJF  MAM  JJA  SON  Year

Divide by 100 to get changes in degrees Celsius (deg-C).
Multiply that result by 1.8(=9/5) to get changes in degrees Fahrenheit (deg-F).

Best estimate for absolute global mean for 1951-1980 is  14.0 deg-C or 57.2 deg-F,
so add that to the temperature change if you want to use an absolute scale
(this note applies to global annual means only, J-D and D-N !)

Example      --      Table Value :      40
                          change :    0.40 deg-C  or  0.72 deg-F
abs. scale if global annual mean :   14.40 deg-C  or 57.92 deg-F


The September 15 release was done by the political arm of NASA, and was timed for maximum impact on the United Nations Climate Summit one week later.
The final Aug Data was never taken into consideration even though it was available.
They did not want to release it was the ninth warmest August ever.
For good measure NOAA released it was the warmest summer ever. In reality it was maybe the seventh warmest summer ever.

Do NASA and NOAA lie wilfully? No, they just want to release selected data in such a way as to safeguard future funding.

On September 23 or so President Obama will address the United Nations' Climate Summit and proclaim "This August was the warmest August ever" or words to that effect, pointing to the NOAA and NASA press releases.
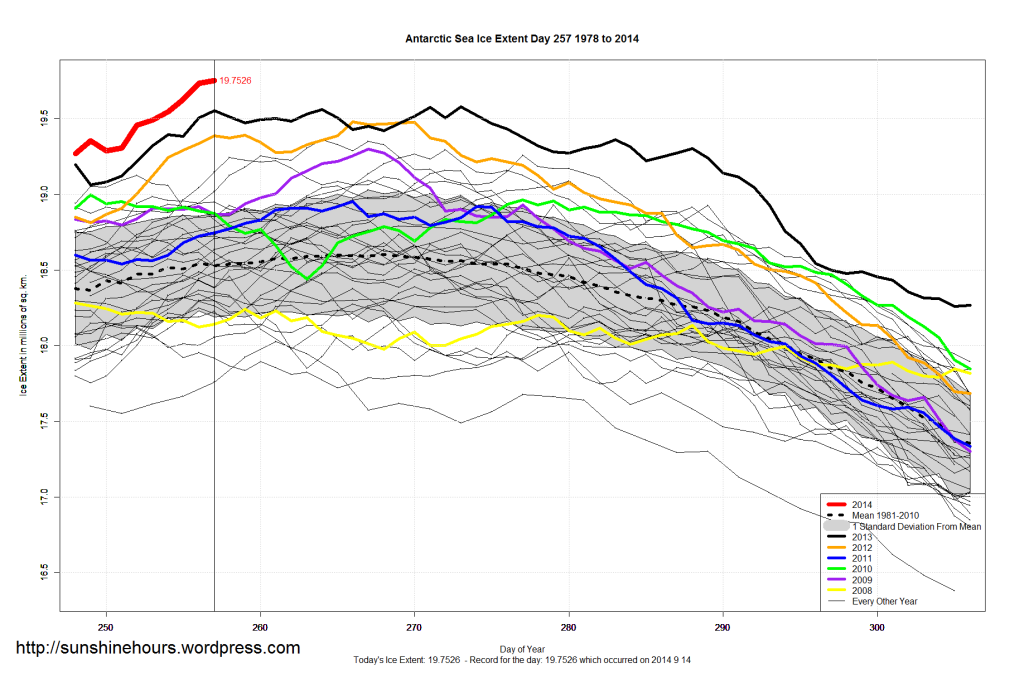
The Antarctic sea ice now covers an area that is larger than United States and Canada combined. The amount of ice over last years absolute record is larger in area than the country of Sweden.
One wonder if this is going to be mentioned at the United Nations’ Summit on Climate Change September 23 in N.Y.
The Climate Summit September 23 in N.Y. is expected to gather 125 heads of State or heads of Government.
Notably absent will be Aussie PM Tony Abbott representing 1.12% of the world’s CO2 emissions, Chinese President Xi Jinping with 24.65%, Indian Prime Minister Narendra Modi with 6%, Canadian Prime Minister Stephen Harper with 1.48%, German Chancellor Angela Merkel with 3% and Russian President Vladimir Putin with 5.18%.
The absences represent about 43% of the world’s CO2 emissions. Of course, when it comes to real pollution, nobody beats China. A good day in Beijing would be an air alert in the U.S.
Here are the 30 highest daily values for sea-ice in millions of square Kilometers.
2014, 09, 17, 20.05401, Absolute record since satellite monitoring begun
2014, 09, 16, 19.91462, Yesterdays Record
2014, 09, 15, 19.81305, Record 2 days ago
2014, 09, 14, 19.75260, Record 3days ago
2014, 09, 13, 19.73444, Record 4 days ago
2014, 09, 12, 19.62641, Record 5 days ago
2013, 09, 30, 19.57892, 2013 final absolute record
2013, 09, 28, 19.57295, 2013 record
2013, 10, 01, 19.57088,
2013, 09, 21, 19.56010, 2013 record
2013, 09, 14, 19.55145, 2013 record
2014, 09, 11, 19.54671,
2013, 09, 20, 19.53172,
2013, 09, 27, 19.51465,
2013, 09, 13, 19.50511, 2013 record
2013, 09, 22, 19.50450,
2013, 09, 29, 19.50390,
2013, 09, 18, 19.50078,
2013, 09, 17, 19.49298,
2014, 09, 10, 19.48881,
2013, 09, 19, 19.48110,
2012, 09, 22, 19.47713, 2012 new absolute record
2012, 09, 25, 19.47159,
2013, 09, 16, 19.47074,
2013, 10, 02, 19.46862,
2012, 09, 26, 19.47649,
2013, 09, 26, 19.46622,
2012, 09, 24, 19.46327,
2012, 09, 23, 19.45940,

New records for sea ice down under.
Obama! Look elsewhere for plunder!
CO2 makes it green,
To reduce it is mean.
It is worse than a crime, it’s a blunder.
Obama, Kerry and Hillary Clinton claim that “Climate Change” is the biggest threat to the world today, bigger than Pakistan and its nuclear arsenal threatened, bigger than North Korea and their ambition to build an EMP bomb, bigger than Russia and its ambition to rebuild the Soviet Empire, bigger than ISIS and their murderous rampages, bigger than the horrors in Nigeria. I could go on, but the irony is that CO2 is necessary for all life as we know it, and more CO2 helps stabilize the climate and improve our environment. The ecosystem is severely challenged by cutting down rain forests in Borneo to make bio-fuel plantations, making ethanol from corn just to name two gross examples. See: /https://lenbilen.com/2014/02/22/co2-the-life-giving-gas-not-carbon-pollution-a-limerick-and-explanation/
Anyhow: here are the new 30 highest values for sea – ice in the Antarctic: (in millions of square kilometers)
2014, 09, 14, 19.75260,
2014, 09, 13, 19.73444,
2014, 09, 12, 19.62641,
2013, 09, 30, 19.57892,
2013, 09, 28, 19.57295,
2013, 10, 01, 19.57088,
2013, 09, 21, 19.56010,
2013, 09, 14, 19.55145,
2014, 09, 11, 19.54671,
2013, 09, 20, 19.53172,
2013, 09, 27, 19.51465,
2013, 09, 13, 19.50511,
2013, 09, 22, 19.50450,
2013, 09, 29, 19.50390,
2013, 09, 18, 19.50078,
2013, 09, 17, 19.49298,
2014, 09, 10, 19.48881,
2013, 09, 19, 19.48110,
2012, 09, 22, 19.47713,
2012, 09, 25, 19.47159,
2013, 09, 16, 19.47074,
2013, 10, 02, 19.46862,
2012, 09, 26, 19.47649,
2013, 09, 26, 19.46622,
2012, 09, 24, 19.46327,
2012, 09, 23, 19.45940,
2014, 09, 09, 19.45600,
2013, 09, 24, 19.44938,
2013, 10, 03, 19.42935,
2013, 09, 23, 19.42799,
2013, 09, 25, 19.42044,


Everybody have heard about lemming years, when a large number of lemmings follow each other over a cliff, falls down into the sea below and drown. Political analogies abound, and so this has become common knowledge: That’s what lemmings do. But why? By the way, 2012 was a lemming year in Northern Sweden. To explain why, there is an even better example with rats. When food is plentiful they multiply fast and after about 4 years there are far too many rats for the food supply. No, they do not die of starvation, virtually all the rats get stressed out and die, all in short order, and the cycle starts anew. It used to be a fairly limited supply of food for the rats, people ate what the land produced, and the number of rats were kept below the stress level. Enter modern day landfills. There is an overabundance of food in a very limited area, so rats congregate there and multiply. Eventually they will hit the stress level die out and the cycle is renewed. Enter the division of rodent control. In their wisdom they put out rat poison to keep the population down. In so doing they manage to keep the rat population just below the stress level, thereby ensuring that every year is a year of plenty of rats rather than every fourth year.
This brings us to Obama and his approach to ISIS. Obama and his lemmings are feeding themselves on the landfill of outdated and toxic liberal ideology that if we are nice to the Muslims they will be nice to us. Even though the DemocRATS would like it to be so, nothing could be further from the truth. ISIS are true followers of Islam as it was “revealed” to Muhammad right before his death following his poisoning. His followers set out on a murderous conquest in 730 A.D. to conquer Mecca and after his death in 732 A.D. they set out to conquer the world, establishing a world-wide caliphate. This dream is still what motivates ISIS taking their cues from the Quran. Islam is a powerful religion, ideology, law, government and mind control all wrapped up in one. You don’t defeat that with bombings, only attacking the root cause will do. Peace with Islam is impossible unless they have a reformation where all references to violence and Jihad are removed and reinterpreted in peaceful terms. If they do not agree to complete freedom of religion they should not be admitted to this country (or to any civilized country for that matter). Barring that, the rats will multiply, and killing them will assure us of a never ending supply of Jihadist warriors.
You may like to read: https://lenbilen.com/2014/08/25/isis-the-true-followers-of-the-quran/
With all this said, ISIS is still the gnats compared to Iran, that may soon be a nuclear power.

