Election was rigged? Only if you look at the data, not if you listen to the media. The President’s “Most Important Speech”.

President Trump Made his “most important speech” on Dec 2, lasting 46 minutes and 7 seconds.

The media’s response to the speech was less than positive.

Factcheck.org Trump’s ‘Most Important’ speech was Mostly False

NYT: Trump delivers 46 minutes diatribe on the ‘Rigged’ election.

Yahoo News: Trump rehashes bogus vote-fraud claims for 46 minutes in his ‘most important speech‘ ever.

Independent.co.uk: Pres Trump in this 46 minute video he just released says this might be the most important speech he has ever given,”

cnn.com: 46 minutes that prove how dangerous Donald Trump is to democracy.

These were the first five suggestions on Google.

I have a great interest in making sure the elections are free from fraud, so in my view this must be fixed and secured. If the banks can do secure transactions, so can voting transactions be made secure. Without secure votes we will no longer have a country.

Arizona: @JennaEllisEsq “In Arizona we have over 500k ballots that were cast illegally. 11,000 are “over-votes”, meaning more votes cast than they have registered voters in a specific precinct. Just that alone would change the outcome of the election.

Georgia: The big news you need to hear about today is Ware County, Georgia. Dominion machines were seized. Equal number of Trump and Biden votes were forensically analyzed. However, the machines reported 87% for Trump and 113% for Biden. Should be 100% for both.

One snippet from Gateway-pundit: Data Expert Edward Solomon analyzed the 2020 election results in Georgia and identified another pattern in the data showing ultimately 200,000 votes transferred from President Trump to Joe Biden at the precinct level.

Nevada: In his ruling Friday, Judge James Russell said there was no evidence of fraud, writing what was shown to him did not prove any of the allegations.

In the state case that was dismissed, lawyers representing the Republican Party’s electors and the campaign said:

  • 1,506 votes cast in the election came from dead voters
  • 2,468 votes were cast by voters who changed their address to another state or country
  • 42,284 voters voted twice
  • About 20,000 voters voted in Nevada without a Nevada mailing address.
  • The evidence, which included 20 binders-worth of materials, was submitted to the court under seal, meaning it could not be viewed publicly. At a news conference on Nov. 5, where surrogates from the Trump campaign announced a federal lawsuit, which was later dropped, speakers told reporters to find the evidence for themselves. That lawsuit was later dismissed voluntarily. During the sole hearing in that case, a lawyer provided no evidence of fraud and did not verbally bring up any evidence to the federal judge.Russell’s 34-page order details the allegations issue-by-issue. This is the first time the public has been able to see the evidence as presented with specific depositions cited.
  • This is to be continued.

Michigan: ANTRIM COUNTY, MI – A man can examine election equipment by court order in the same northern Michigan county that saw early, but since corrected, issues with vote totals in the presidential election.

Judge Kevin Elsenheimer of the 13th Circuit Court in Antrim County ordered that William Bailey of Central Lake could take “forensic images” of the 22 tabulators used for a vote on a marijuana retailer proposal he is challenging.

The order makes no mention of Antrim County’s presidential results, where a software issue initially led to an inaccurate vote count that was corrected after a paper ballot recount, which awarded the county to President Donald Trump.

Instead, Bailey wants to overturn a proposal to allow a marijuana retailer in his village that initially resulted in a 262-262 tie, which was considered a loss for the proposal, the order stated. A retabulation saw the proposal pass by one vote, which Bailey alleges didn’t count three damaged ballots.

It is a “greater public interest” right now to confirm “the accuracy, integrity and security of the election process” than potential future misuse of election software discovered during the examination, Elsenheimer wrote.

The forensic examination took place Sunday with Bailey, Antrim County Clerk Sheryl Guy, county administrator Pete Garwood, county attorney Haider Kazim, three county commissioners, a county IT technician and a member of the Sheriff’s department, said county spokesman Jeremy Scott in a release.

Jenna Ellis, an attorney for Trump, told Fox News on Sunday that Elsenheimer “granted our team” access to the tabulating machines.

It is interesting the judge granted examination for the marijuana ballot initiative but not the presidential vote. Yet there has been a 6000 vore “error” in that county alone.

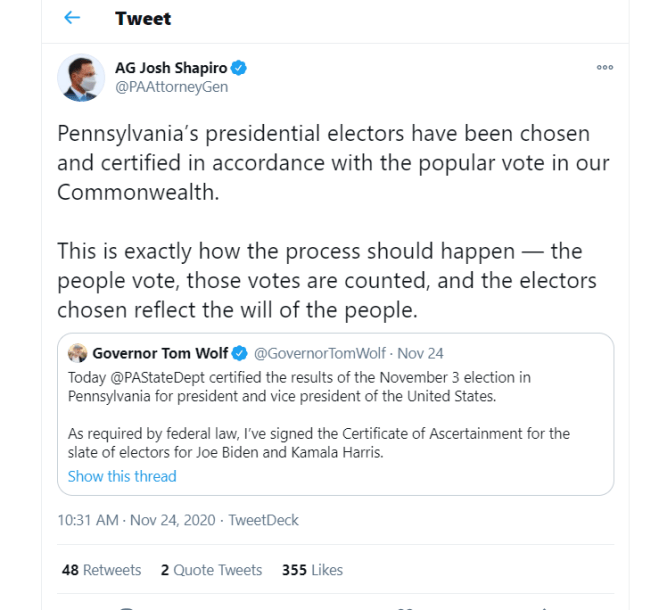
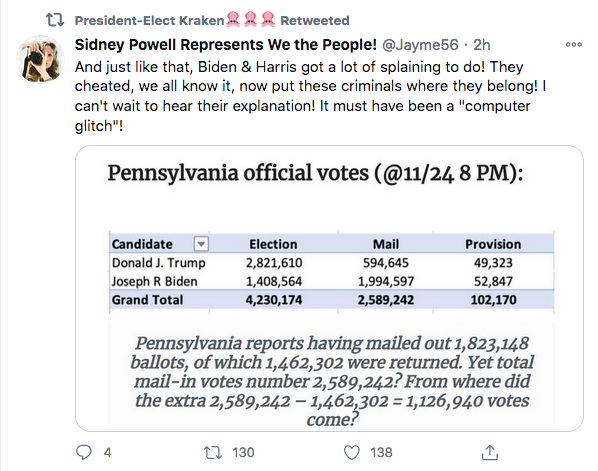
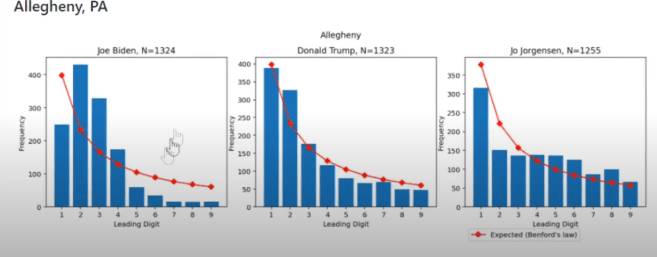
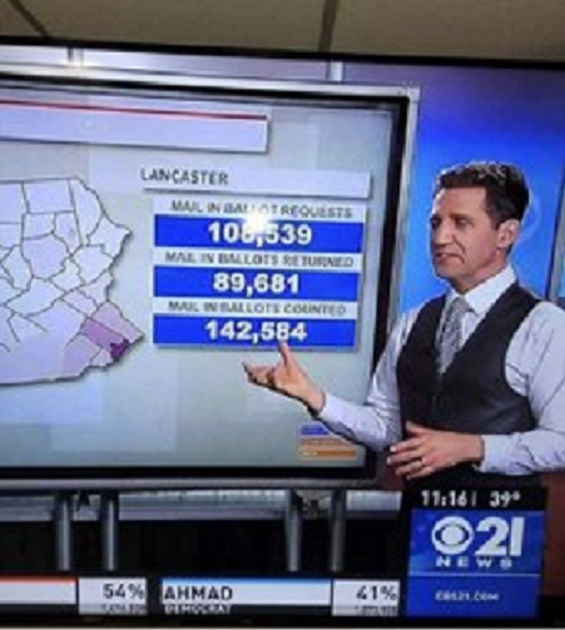
Pennsylvania: Pennsylvania Certified the 2020 vote, fraud and all. The numbers do not add up.

Wisconsin:

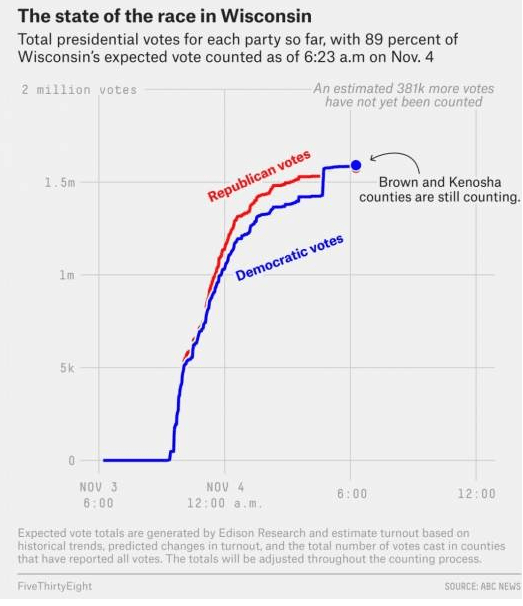
This absentee ballot surge should be recounted by hand to ensure there was no double loading of votes.


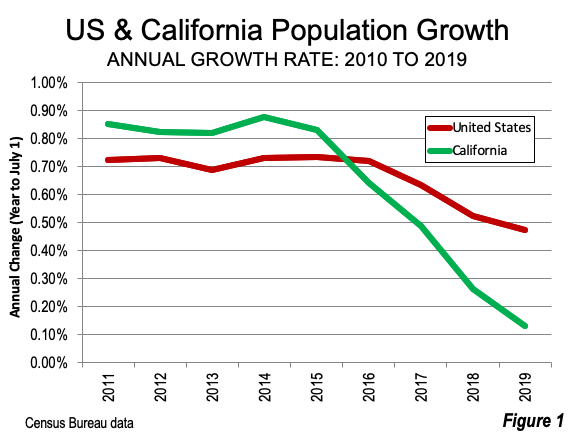
California:  Voter fraud in California? Yes, millions of non-citizens with driver’s Licenses voted!

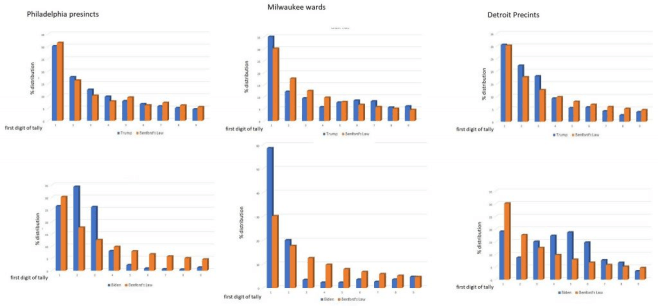
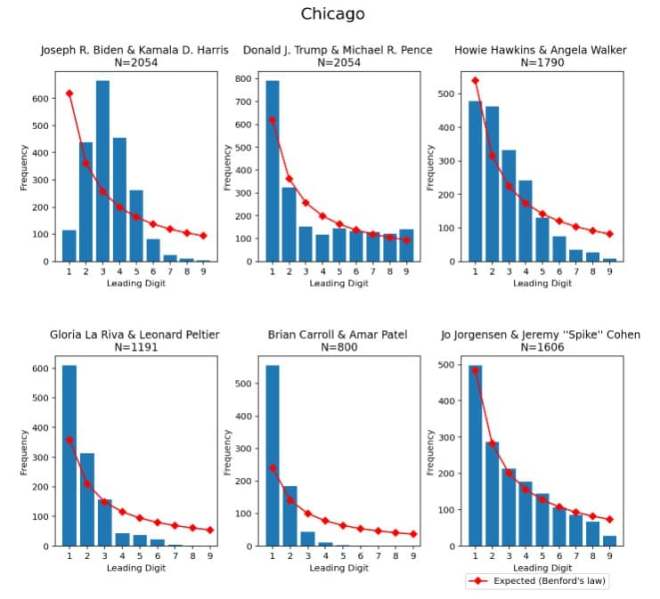
At least 29 states using Dominion voting machines:   Benford’s law and the 2020 election. A Limerick on fraud.

Elections and fraud in this nation

cannot stand a close observation.

Zero Trump votes are added

but Joe Biden’s are padded

an act of the left’s desperation.


Pennsylvania Certified the 2020 vote, fraud and all. The numbers do not add up.


Living in Pennsylvania I take a keen interest in checking the voter result. Somebody took a screenshot of the vote counting in Lancaster Co.

This was partial results. How did it stack up for the whole state? The results are in and certified by none other than Governor Wolf, so these must be true results:

So what were the results? These are the official numbers from Sidney Powell

If all of these counted ballots count we get the following result:

Joseph R. Biden 3,456,008, Donald J. Trump: 3,465,578.

But the official tally was as Pennsylvania Secretary of State Kathy Boockvar made the final count official three weeks after the Nov. 3 election: Biden received 3,458,229 votes, 80,555 more than President Donald Trump’s 3,377,674 votes. Biden won 50.01% of the vote to 48.8% for Trump.

However it is impossible to have more legal mail-in ballots than was officially requested. The mail-in votes for Trump was 22.97% of the total, so we should at least take away 258,813 votes away from President Trump and the remaining overcount of 868,127 votes away from Joe Biden.

This would give a net vote count for President Trump of 3,118,861 votes and a net count for Joseph R Biden of 2,590,102 votes

In other words: President Donald J. Trump won Pennsylvania by 528,759 votes!

Please recount all mail-in ballots and explain what happened!

And while you are at it, recount by hand

7th Congressional District

Votes: D Susan Wild 195,713 51.9%

R Lisa Scheller 181,569 48.1%

8th Congressional District

Votes: D Matt Cartwright 178,407 51.8%

R Jim Bognet 166,201 48.2%

17th Congressional District1

Votes: D Conor Lamb 222,242 51.1%

R Sean Parnell 212,279 48.9%

They could all flip when the mail-in overcount is removed!


Eleven counties that may overturn the election. Their votes in 2012, 2016 and (so far) in 2020.

County          2020  Biden     Trump      %B  %T

                       2016  Clinton   Trump     %C   %T

                       2012  Obama   Romney    %O  %R

Philadelphia 2020 594,005 131,330 81.4% 18%

                       2016 584,025 108,748 82.3% 15.3% 

                       2012 557,024   91,840 85.2% 14.1%

Allegheny      2020 428,876   282,170 59.6% 39.2%

(Pittsburgh)  2016 357,167  259,480  55.9%  39.5%

                        2012 348,151  259,304  56.6%  42.2%

Maricopa co 2020 1.040,774 995,665  50.3% 48.1%

(Phoenix, AZ) 2016 702,907  747,361  44.8%  47,7%

                         2012  532,284 680.089  43.2% 55.1%

Wayne Co       2020  587,074 264,149  68.1%  30.7%

(Detroit)         2016   519,444 228,993  66.4%  29.3%

                         2012   595,253  213,586 73.1%  26.2%

Kent CO           2020  186,753  165.318  52%     46%

(Grand Rapids) 2016 138,683  148,180  44.6% 47.7%

                          2012   134,560  157,801  45.5% 53.4%

Milwaukee co 2020  317,270   134,357  69.4% 29.4%

Wisconsin        2016    288,822 128,069  65.5% 28.6%

                           2012   328,090  158,430  66.8% 32.3%

Dane Co            2020  260,185    78,800  75.7%  22.9%

(Madison)         2016  217,697    71,275   70.4% 23.0%

                           2012   215,389    83,459   71.1%  27.6%

Clark Co            2020   521,852  430,930  53.7%  44.3%

(Las Vegas)       2016   402,227  320,057  52.4%  41.7%

                           2012   387,978  288,223  56.4%  41.9%

Fulton Co          2020  381,144   137,240  72,6%  26.2%

(Atlanta)           2016  297,051  117,783  67.7%  26.8%

                           2012   248,479  133,837   64.2%  34.6%

DeKalb Co         2020   308,140   58,369    83.1%  15.7%

                            2016   251,370   51,469   79.1%   16.2%

                            2012    237,704    64.308  77.9%  21.1%

Gwinnett Co      2020   241,827  166,413  58.4%  40.2%

                            2016   166,153  146,989   50.2%  44.4%

                            2012    131,879  159,563  44.6%  54%

Vote count 2012, 2016 and 2020 by state and (D) vs (R) . (2020 as per 10/15)

State      ·  Clinton (D) Trump (R) D %    R %   D’12  D’16 Margin Total ’12     Total ’16

                     Votes           Votes      2016   2016      Margin   Shift    Votes           Votes  

2020          Biden (D)   Trump (R)                        total 2020

Raw Votes vs. ’12 U.S.

 Total      65,844,610 62,979,636 48.2% 46.1%  3.9% 2.1% -1.8% 129,075,630 136,628,459 

2020        79,982,189 73,288,903                                                       153,271,062  

Swing States

Arizona*     1,161,167 1,252,401 45.1% 48.7% -9.1% -3.5% 5.5% 2,299,254 2,573,165

2020            1,672,054 1,661,677 49.4% 49.1%

Colorado*   1,338,870 1,202,484 48.2% 43.3%  5.4% 4.9% -0.5% 2,569,521 2,780,220

2020            1,803,921 1,364,202 55,4% 41.9%

 Florida*     4,504,975 4,617,886. 47.8% 49.0%  0.9% -1.2% -2.1% 8,474,179 9,420,039

2020            5,297,029 5,668,728  47.9% 51.2%

Iowa*             653,669    800,983  41.7% 51.1%  5.8% -9.4% -15.2% 1,582,180 1,566,031

2020              758,597     897,356  45%    53,2% 

Maine*           357,735.   335,593. 47.8% 44.9% 7.3% 15.3% 3.0% -12.3% 713,180 747,927

2020               430,023    359,502  52.9%  44.2%

Michigan*   2,268,839 2,279,543  47.3% 47.5% 9.5% -0.2% -9.7% 4,730,961 4,799,284

2020             2,795,184 2,649,063 50.6%  47,9%

Minnesota*  1,367,716 1,322,951  46.4% 44.9% 7.7% 1.5% -6.2% 2,936,561 2,944,813

Nevada*         539,260.    512,058. 47.9% 45.5% 6.7% 2.4% -4.3% 1,014,918 1,125,385

2020               703,486     669,890  50.1%  47.7%

N. Hampshire 348,526     345,790  46.8% 46.5% 5.6% 0.4% -5.2% 710,972 744,158

2020                423,291     365,373  52.8% 45.6%

N. Carolina* 2,189,316. 2,362,631. 46.2% 49.8%  -2.0% -3.7% -1.6% 4,505,372 4,741,564

2020              2,683,787  2,757,112  48.7% 50%

Ohio*            2,394,164  2,841,005  43.6% 51.7% 3.0% -8.1% -11.1% 5,580,840 5,496,487

2020              2,603,731  3,074,418  46.5% 52.1%

Pennsylvania2,926,441 2,970,733   47.9% 48.6%  5.4% -0.7% -6.1% 5,753,546 6,115,402

2020             3,434,458  3,361,131  50.0%  48,9%

Wisconsin*  1,382,536 1,405,284   46.5% 47.2%  6.9% -0.8% -7.7% 3,068,434 2,976,150

2020             1,630,683 1,610,139   49.6%  48.9%

Non-Swing States

Alabama*        729,547 1,318,255  34.4% 62.1% -22.2% -27.7% -5.5% 2,074,338 2,123,372

2020                 843,724 1,434,315  36.6% 62.3%

Alaska*           116,454    163,387   36.6% 51.3%  -14.0% -14.7% -0.7% 300,495 318,608

2020   (98%)   150,155    185,807   43%    53.2%

Arkansas*        380,494.   684,872. 33.7% 60.6% -23.7% -26.9 -3.2% 1,069,468 1,130,635

2020                 418,811    757,315   34,6% 62.6%

California*   8,753,788 4,483,810 61.7% 31.6% 23.1% 30.1% 7.0% 13,038,547 14,181,595

2020 (96%) 10,759,316 5,749,736 63.8% 34.1%

Connecticut*   897,572    673,215 ,54.6% 40.9%  17.3% 13.6% -3.7% 1,558,114 1,644,920

2020             1,080,471    714,581  59.3%  39.2%

Delaware*       235,603    185,127  53.4% 41.9%  18.6% 11.4% -7.2% 413,890 441,590

2020                295,493    199,829  58.8%  39.8%

D. C.*              282,830      12,723  90.9%   4.1%  83.6% 86.8% 3.1% 293,764 311,268

2020                307,265       18,172  92.9%  5.5%

Georgia*       1,877,963  2,089,104 45.9% 51.0%  -7.8% -5.2% 2.7% 3,900,050 4,092,373

2020              2,472,002  2,457,880 49.5% 49.2%            

Hawaii*           266,891     128,847  62.2% 30.0%  42.7% 32.2% -10.5% 434,697 428,937

2020  (96%)     365,802    196,602  63.7%  34.3%

Idaho*             189,765     409,055  27.5% 59.3%  -31.9% -31.8% 0.1% 652,274 690,255

2020                 286,991     554,019 33.1%  63.9%

Illinois*        3,090,729   2,146,015  55.8% 38.8%  16.9% 17.1% 0.2% 5,242,014 5,536,424

2020             3.414.236   2,405,750  57.6%  40.6%

Indiana*      1,033,126.  1,557,286.37.8% 56.9% -10.2%-19.2% -9.0% 2,624,534 2,734,958

2020             1,242,163   1,729,472   41%    57.1%

Kansas*          427,005      671,018  36.1% 56.7%  -21.7% -20.6% 1.1% 1,159,971 1,184,402

2020                551,144       752,903  41.3% 56.5%

Kentucky*     628,854   1,202,971 32.7% 62.5%  -22.7% -29.8% -7.1% 1,797,212 1,924,149

2020                 772,285   1,326,418  36.2% 62.1%

Louisiana*      780,154 1,178,638 38.4% 58.1%  -17.2% -19.6% -2.4% 1,994,065 2,029,032

2020                856,034    1,255,776  39.9% 58.5%

Maryland*    1,677,928.     943,169  60.3% 33.9%  26.1% 26.4% 0.3% 2,707,327 2,781,446

2020              1,905,407     958,547   65.3% 32.9%

Mass.*          1,995,196   1,090,893  60.0% 32.8%  23.1% 27.2% 4.1% 3,167,767 3,325,046

2020              2,316,338   1,148,777 65.6%  32.6%

Mississippi*   485,131    700,714  40.1% 57.9%  -11.5% -17.8% -6.3% 1,285,584 1,209,357

2020                514,891       741,571  40.4% 58.2%   

Missouri*     1,071,068   1,594,511 38.1% 56.8%  -9.4% -18.6% -9.3% 2,757,323 2,808,605

2020             1,242,851   1,711,848   41.3% 56.9%

Montana*        177,709       279,240  35.7% 56.2%  -13.7% -20.4% -6.8% 484,048 497,147

2020                 244,833      343,643  40.5% 56.9%

Nebraska*       284,494       495,961  33.7% 58.7%  -21.8% -25.0% -3.3% 794,379 844,227

2020                 371,921      553,793   39.3% 58.6%

N. Jersey*    2,148,278   1,601,933  55.5% 41.4%  17.8% 14.1% -3.7% 3,640,292 3,874,046

2020  (94%) 2,419,324   1,759,713   57.2% 41.6%

New Mexico* 385,234.    319,666.   48.3% 40.0%  10.1% 8.2% -1.9% 783,758 798,318

 2020              499,782      401,361     54.3% 43.5%  901143

New York*  4,547,218   2,814,346  59.0% 36.5%  28.2% 22.5% -5.7% 7,072,083 7,710,126

2020 (81%)  3,804,597   2,890,532  56.1% 42.6%

North Dakota* 93,758       216,794  27.2% 63.0%  -19.6% -35.7% -16.1% 322,932 344,360

2020                114,902      235,595  31.9% 65.5%

Oklahoma*   420,375      949,136 28.9% 65.3%  -33.5% -36.4% -2.8% 1,334,872 1,452,992

2020              503,289     1,018,870 32.3%  65.4%

Oregon*     1,002,106.       782,403. 50.1% 39.1%  12.1% 11.0% -1.1% 1,789,270 2,001,336

2020            1,329,567       949,646   56.9% 40.6%

Rhode Island* 252,525      180,543  54.4% 38.9%  27.5% 15.5% -11.9% 446,049 464,144

2020                306,192       199,830  59.6% 38.9%

 S. Carolina* 855,373 1,155,389 40.7% 54.9% -10.5% -14.3% -3.8% 1,964,118 2,103,027

2020                 1,091,348 1,384,852   43,4% 55.1%

South Dakota*   117,458    227,721 31.7% 61.5%  -18.0% -29.8% -11.8% 363,815 370,093

2020    (94%)       150,467    261,035 35.6% 61.8%

Tennessee*     870,695  1,522,925 34.7% 60.7% -20.4% -26.0% -5.6% 2,458,577 2,508,027

2020                  1,139,666  1,849,211 37.4% 60.7%

Texas*            3,877,868  4,685,047  43.2% 52.2%  -15.8% -9.0% 6.8% 7,993,851 8,969,226

2020                  5,236,610  5,874,547  46.5% 52.1%

Utah*        310,676 515,231 27.5% 45.5% 27.0% -48.0% -18.1% 30% 1,017,40 1,131,430

2020                     555,694      852.677 37.8%  58%

Vermont*       178,573     95,369 56.7% 30.3% 13.1% 35.6% 26.4% -9.2% 299,290 315,067

2020                   242,805       112,688 66.4% 30.8%

Virginia*     1,981,473 1,769,443 49.8% 44.4% 5.8% 3.9% 5.3% 1.5% 3,854,489 3,982,752

2020                   2,404,510   1,961,126 54.3% 44.3%

Washington* 1,742,718 1,221,747 51.8% 36.3% 14.9% 15.5% 0.6% 3,125,516 3,365,644

2020                    3,359,319   1,574,498 58.4%  39%    

West Virginia* 188,794 489,371 26.5% 68.6% -26.8% -42.2% -15.4% 670,438 713,051

2020                       235,657     544,826  29.7% 68.6%

Wyoming*      55,973  174,419 21.9% 68.2% -40.8% -46.3% -5.5% 249,061 255,849

2020                         73,491     193,559 26.7% 70.4%

Voter fraud in California? Yes, millions of non-citizens with driver’s Licenses voted!

After the 2016 election Judicial Watch made an investigation of the California election. The Federal Government maintains a list of its citizens, the state governments don’t. Judicial watch made an investigation of the registered voters and found that eleven counties had more voters registered than the number of eligible voters. Here is a list of them:

County           Vote            Vote       % eligible  Clinton/
—————— Clinton      Trump   registered  Trump
Los Angeles 1,893,770    620,285   144            3.05
San Diego        567,243    386,807   138           1.47
San Francisco 312,445      34,493   114           9.06
San Mateo       192,035      47,627   111           4.03
Solano                94,622      48,712   111           1.94
Yolo                    34,460      13,178   110            2.61
Santa Cruz        85,185      20,158   109            4.23
Monterey          64,733      26,378   104            2.45
Stanislaus         73,939      72,960   102            1.01
Imperial            23,887        9,318   102            2.56
Lassen                 2,224        7,574   102            0.29
11 Co. Total  3,344,543  1,287,490                    2.60

Rest of Calif 2,514,062   1,391,229                   1.81
All Calif.       5,858,605  2,678,719                    2.19

This compilation is remarkable in so many ways.

California has 3.4 million resident aliens (green card holders and special visas). They are not eligible to vote. They also have about 3 million illegal aliens (obviously not eligible to vote)

California has motor voter registration. They issue driver’s licenses to, not only resident aliens but also to illegal aliens. All they have to do to be registered to vote is to check a box indicating they are eligible. No check for its validity is performed.

Los Angeles County is the capital of illegal aliens, so it comes as no surprise that since they now have driver’s licenses and thereby by extension are made eligible to vote, the ratio of 1.44 between registered voters and lawfully eligible voters comes as no surprise.

Silicon valley has more resident aliens than other areas of California, so it is no surprise they have registered voters exceeding eligible voters.

There is one small county located way up in North East California, Lassen County which voted heavily for Trump. It has only two major employers, two state prisons and one federal prison. Could Lassen County have registered ineligible felons?

This calls for a thorough investigation if the integrity of voting means anything.

The link to the letter from Judicial watch to CA, http://www.judicialwatch.org/document-archive/nvra-letter-ca-august-2017/

As far as I know nothing was done to remedy the situation.

California is no longer a growing state. The population may even be declining in 2020. See this chart:

So we would then expect the numbers for the 2020 election to be about the same

County 2020 Vote   020 Vote Increase  Increase
—————— Biden      Trump       Biden     Trump

Los Angeles 2,609,329  984,383   37.8%       58.7%
San Diego        933,468  577,573   64.6%       49.3%
San Francisco 373,186   55,347    19.4%       60.5%
San Mateo       225,185    54,456    17.2%       14.3%
Solano              124,752    65,558    31,8%       34.6%
Yolo                    47,504     16,128    36,7%       22,4%
Santa Cruz       109,745    25,485    28.8%       26.4%

Monterey           93,874   34,893    45.0%         32.3%

Stanislaus          84,668    79,622   16.1%           8.1%
Imperial             34,430    20,577    44.1%      120.8%   
Lassen                   2,772      8,798    24.6%        16.2%

One more county is of interest, Orange Co. It used to be solidly Republican

2020                 792,966     655,811 Total: 1,448,777 Advantage Biden   20.9%

2016                 556,544    472,669  Total: 1,029,213 Advantage Clinton 17.8%

2012                457,077     541,092  Total:    998,169 Advantage Romney 18.4%

2008                518,925     557,370  Total: 1,076,295 Advantage McCain 7.4%


Benford’s law and the 2020 election. A Limerick on fraud.

Elections and fraud in this nation

cannot stand a close observation.

Zero Trump votes are added

but Joe Biden’s are padded

an act of the left’s desperation

This is a map of the extent to which Dominion voting machines software is presently used. When votes are tallied it produces results that are not credible according to statistical science.

Joe Biden’s votes violate Benford’s Law, President Trump’s do not.

Benford’s law or the first-digit law, is used to check if a set of numbers are naturally occurring or manually fabricated. It has been applied to detect the voting frauds in Iranian 2009 election and various other applications including forensic investigations.

Benford’s Law, also called the Newcomb–Benford law, the law of anomalous numbers, or the first-digit law, is an observation about the frequency distribution of leading digits in many real-life sets of numerical data. The law states that in many naturally occurring collections of numbers, the leading digit is likely to be small. For example, in sets that obey the law, the number 1 appears as the leading significant digit about 30% of the time, while 9 appears as the leading significant digit less than 5% of the time. If the digits were distributed uniformly, they would each occur about 11.1% of the time. Benford’s law also makes predictions about the distribution of second digits, third digits, digit combinations, and so on.

Plots of the first digits of counts in various precincts and wards for selected counties/cities.

This is Pittsburgh.

But even cities where we know the outcome, the numbers have been manipulated such as

When this fraud is corrected the electoral map will look quite different, and may even swing a few house and senate votes.

Europe and shutdowns, Sweden and “herd immunity”. The results are in on coronavirus response success

The Corona-virus pandemic has now been with us nine months and for the first time the trends ate looking better, giving us hope that the worst is over.

In the beginning the worldwide death rate was 8,65% and it is now down to 1.31%, a reduction of 84.8%. Total deaths worldwide are about 1,200,000 which is still less then the annual TB deaths that amount to 1.6 million, of which 300,000 are HIV positive.

The corresponding numbers for U.S.A :  7.02%  death rate at the beginning of the disease. It is now down to 1.04%, an 85.2% decrease. With unrestricted availability to take HCQ+ we can reduce the death rate even further.

Now it is getting interesting. While nearly all industrialized nations shut down their non-essential functions, such as schools, elective surgery, elective medical diagnostics, non food stores, flights, travel, restaurants, non essential government services and the like Sweden took a different approach. They kept their elementary schools open, did not close stores and restaurants, only large gatherings, mandated increased hygiene and to practice social distancing, and then they let the virus rage as a normal flu, and waited for the so called “herd immunity.” Wearing masks were never mandated, only encouraged when social distancing was impossible to maintain. Sweden did their best though to protect the vulnerable.

In the beginning the results were disastrous. The initial death rate was over 21%, it seemed  like a failed attempt, but then things started to calm down. In late spring the death rate had settled down to 9.2%, but then came a second wave of cases and everyone was bracing for the worst. But the death rate  did not rise, and is now down to 0.24%. (Oct 30)

The rest of Europe (except Belarus) did try to limit the spread of the coronavirus  using heavy lockdowns. This limited the spread of the virus for a while, and through the summer it looked like it was the right thing to do, but “herd immunity was never achieved. Now, when the flu season has arrived the cases are rising again, and for the western Europe nations cases are now rising, and so are deaths. In Germany the death rate has increased 14-fold since the summer minimum, in Spain the death rate is increased 80-fold, in France the death rate is increased 30-fold.  The United Kingdom death rate is increased 35-fold and the kingdom is ready to issue another draconian lockdown, other countries are also issuing curfews and other restrictions.

The virus will run its course until herd immunity is achieved. Vaccines will finally limit the pandemic. Thanks to President Trump’s “warp speed” initiative, paying private enterprise to produce the vaccine at the same time level 3 testing is underway so the vaccine is available as soon as it is approved, vaccines will be available weeks from now rather than years from now.

This is expensive, but if any of the 6 vaccines succeed, it was worth it, if all fails we are no worse off than if we wreck the economy with another lockdown that only delays the inevitable, herd immunity achieved years from now with more deaths than if we had followed the example of Sweden.

U.S.A. corona virus death rate as of September 5 is 3.00%, 41 countries have higher death rates. 15 countries giving HCQ+Zinc+Z-pak to COVID-19 patients as soon as symptoms occur have much lower death rates.

In 1956, the U.S. Food and Drug Administration approved HCQ for symptoms of lupus and rheumatoid arthritis, particularly skin inflammation, hair loss, mouth sores, fatigue, and joint pain. It was deemed safe to take in perpetuity with a weight appropriate daily dose, typically 250 to 500 mg/day. In fact it is deemed so safe that pregnant women and nursing mothers can take it without restrictions.

The number of corona-virus cases for U.S.A as of September 5 is 6,452,833 and  deaths are  193,121 making the death rate 3.00%. There are four states: New York, New Jersey, Pennsylvania and Michigan, under DOJ  investigation because they required nursing homes to admit and readmit COVID-19 cases resulting in many deaths. If these states are excluded from the count the death rate would be 2.30%

The Democratic convention speakers assured us that this was the worst result of any country in the world, thanks to President Trump’s inaction and refusal to accept science. So, how does U.S.A. compare to the rest of the world? The cases, deaths and death rates for all countries with higher death rates are listed below:

(All numbers are received from  https://www.worldometers.info/coronavirus/)

1. Yemen                                                      1,987                      572   28.8%

2. Italy                                                      277,634                 35,541    12.8%

3. United Kingdom                               347,152                 41,551      12.0%

4. Belgium                                                87,825                   9,906      11.3%

5. Mexico                                                 629,409                 67,326     10.7%

6. France                                                 324,777                 30,724       9.5%

7. Netherlands                                         74,787                   6,243        8.4%

8. Channel Islands                                        631                        48        7.6%

9. Hungary                                                 8,387                        624      7.4%

9. Chad                                                      1,034                           77        7.4%

10. Isle of Man                                               337                        24        7.1%

11. Canada                                              131,858                    9,145       6.9%

11. Sweden                                                84,985                    5,835       6,9%

13 Liberia                                                   1,307                       82          6.3%

14. Sudan                                                   13,407                      832        6.2%

15. Ireland                                                 29,672                  1,777        6.0%

16. San Marino                                             716                         42       5.9%

16. Niger                                                      1,177                       69        5.9%

18. Iran                                                     386,658                22,293      5.8%

19. Ecuador                                             118,045                  6,724       5.7%

19. Spain                                                  517,133                 29,418      5.7%

21. Egypt                                                    98,062                  5,342       5.4%

22. Switzerland                                        44,401                  2,013       4.5%

22. Mali                                                       2,842                     127        4.5%

22. Bolivia                                             120,241                  5,398          4.5%

25. Andorra                                                1,215                       53        4.4%

26. Slovenia                                                3,165                     135        4.3%

26. Peru                                                   683,702               29,687        4.3%

28. Indonesia                                         194,109                 8,025         4.1%

28. Finland                                                  8,291                   336          4.1%

28. North Macedonia                            15,090                    617           4.1%

28. Tanzania                                                509                       21           4.1%

32. Barbados                                                 178                         7         3.9%

32. Burkina Faso                                      1,408                       55          3.9%

32. Bulgaria                                             17,050                   671           3.9%

35. Germany                                         251,456                 9,401          3.7%

35. Sint Maarten                                         511                      19           3.7%

35. Guatemala                                         77,481                2,845          3.7%

35. Afghanistan                                      38,398                1,412           3,7%

39. Denmark                                           17,883                   627           3.5%

40. Brazil                                             4,123,000             126,266          3.1%

41. Poland                                                70,824                 2,120           3.0%

That’s right! U.S.A. ranks as 42th worst country!

Now there are countries that do better, some much better. One group has this in common: They administer a proper therapy of hydroxychloroquine, most often with Zinc and Z-max as soon as symptoms occur, with or without a positive test. Some of the countries are so poor that it is all they can afford. The result?

Country               Cases     Deaths

1. Qatar                120,905          203    0.17%   The country of Qatar consists of 88% temporary workers between the ages of 20 and 60 and most of the deaths occurred in the remaining 12% of the original population.  This means that the death rate of persons between the ages of 20 and 60 is less than 0.2% if given HCQ + Zinc  as soon as symptoms occur or as a prophylactic administered instead of contact tracing and quarantine. If this regimen would be implemented immediately we could fully open schools and universities, have college and professional sports again and fully open all businesses. The most vulnerable would of course still have to be protected.

2. Bahrain               54,771        199     0.3%  Again, about half of the population are  immigrants or guest workers. They have a high rate of obesity and diabetes, but HCQ seems to be working excellent in Bahrain

3. UAE                      73,984        388     0.5%  The United Arab Emirates is a nation of 88% non-citizen immigrants and guest workers. there are over twice as many males as there are females.

4. Israel                 130,157      1,012    0.8%

5. Costa Rica            46,920        478    1.0%

6. Malaysia               9,397         128    1.4%

7. South Korea      21,177          334    1.6%

8. India              4,202,562     71,687   1.71%

9. Russia             1,025,505   17,820    1.74%

10. Morocco           72,394       1,361   1.9%

11. Ukraine          135,894       2,846   2.1%

12. Senegal             13,987         290     2.1%

13. Cuba                    4,309          101   2.3%

14. Turkey            279,806      6,673    2.4%

15. Greece               11,524         284    2.5%

There are countries that are not doing as well as U.S.A. in combating the corona pandemic, even though they freely administer HCQ. They are

16. Algeria                 46,364     1,556   3.4%

17. Indonesia          194,109     8,025   4.1%

and probably others. Many countries’ health statistics are of dubious accuracy. That is why China is excluded.

Other countries, such as

Iceland                        2,141          10      0.5%

Faeroe Islands              413             0     0.0%

Japan                        70,876        1,349   1.9%   have had success with a thorough contact tracing and quarantine. This can only be done if caught at the earliest stages of the disease. Remember, Japan never allowed the people from the infected cruise ship to enter Japanese soil and be treated in hospitals.

Vaccine may not be as effective as first thought. The china corona virus has mutated into 11 strains, and continues to mutate, so a universal vaccine cannot be developed, but like the flu, every year will have a new regional strain to combat.

The solution is to implement a hydroxychloroquine + Zinc + Zitromax regimen, both as a prophylactic and as a therapy as soon as symptoms occur.

According to the Ford study treatment with hydroxychloroquine cut the death rate significantly in sick patients hospitalized with COVID-19 – and without heart-related side-effects, the new study published by Henry Ford Health System. The death rate was cut in half for patients treated with HCQ. It is even more dramatic if HCQ is administered as soon as symptoms occur, over 40 international studies have shown an up to 80+% reduction in death rates. For some reason FDA and CDC do not acknowledge international studies. They rather let people die than accept a drug that has been approved for 64 years, and given freely to people with Lupus. It is so safe it is even given to pregnant women and nursing mothers.

How many extra deaths are we talking about? HCQ is already administered under right to try by about 16% of all cases. If it had been recommended in April, one month after President Trump recommended it based on excellent results in french studies, about half the deaths from then on could have been avoided. It adds up, about 1.5% of all cases since April 15, or about 78,000 deaths could have been avoided,  and moving forward about 600 deaths a day. This is in my opinion a low estimate.

Another significant moment in the hydroxychloroquine debate came on July 23 in the form of an opinion piece. Harvey A. Risch, MD, PhD, a professor of epidemiology at Yale School of Public Health with many years of healthcare experience, wrote in favor of the medication, calling it “highly effective” and describing physicians who use it “in the face of widespread skepticism” as heroes.

In his opinion piece, Risch listed several studies that have pointed to the benefits of treating COVID-19 with hydroxychloroquine. He also wrote about how the medication has been politicized and said it “has not been used properly in many studies.”

“In the future, I believe this misbegotten episode regarding hydroxychloroquine will be studied by sociologists of medicine as a classic example of how extra-scientific factors overrode clear-cut medical evidence,” he concluded. “But for now, reality demands a clear, scientific eye on the evidence and where it points. For the sake of high-risk patients, for the sake of our parents and grandparents, for the sake of the unemployed, for our economy and for our polity, especially those disproportionally affected, we must start treating immediately.”

His assessment of lives saved with HCQ ++ was 70,000 lives would have been saved as of Aug 1 if HCQ had been used as early as possible. He is the scientist, I am using public data drawn from a population of 2 billion people, and we reached a very similar conclusion.

Do it! The fact that President Trump has advocated it as early as March should not be a hindrance to save 600 lives a day!

Of umbrellas and such. A study in contrasts. A Limerick.

Umbrellas: A hard task for some.

To Barry as hard as they come.

The most powerful man:

See him do what he can.

To fold it, try using your thumb!

This was the former President Barack Obama

He always had trouble handle an umbrella.look down on his notes and talk at the same time, so he commandeered the Marines to hold the umbrella for him. To be fair he commandeered another Marine to keep President Erdogan of Turkey dry. No such consideration  was given the audience.

But he couldn’t keep his own wife out of the rain either. It is difficult to hold an umbrella, wave, walk down the stairs and keep your wife dry, all  at the same time.

HAVANA, CUBA – MARCH 20: First lady Michelle Obama, President Barack Obama, Malia Obama and Sasha Obama arrive at Jose Marti International Airport for a 48-hour visit on Airforce One March 20, 2016 in Havana, Cuba. Obama is the first President in nearly 90 years to visit Cuba, the last one being Calvin Coolidge. (Photo by Joe Raedle/Getty Images)

No, This is the way to handle an umbrella!

Nothing fancy, just do it. And keep your wife dry at the same time.