In addition he signed one Executive Order restoring Science to the Golden Standard: Free from politics!
In the presentation of the Executive Orders the CEO of Oklo, James DeWitte mentioned that we are restarting a technology that has been inactive for over 40 years. This can only mean he meant without saying so the Oak ridge Molten Salt Thorium reactor. It was going great, but President Nixon wanted to go with the fast breeder reactor and move nuclear development to California, so they started to badmouth the MSR. One false accusation was that it was unreliable and needed to be shutdown frequently. The real reason was it was routinely shut down on weekends to save money and personnel. The Molten Salt Reactor does not have a poison time after shutdown as does conventional power station but can be scaled up and down including small power stoppages. I see this as an advantage. Anyhow, this is what Mr. DeWitte said:
One of many new options
There are only a few fissionable options, Uranium 233, Uranium 235 and Plutonium 239. Uranium 233 is produced by bombarding Thorium 232 with neutrons. Plutonium 239 is produced by bombarding Uranium 238 with neutrons.
Right now only 0.5% of the mined uranium is used. The rest goes to nuclear waste. Molten Salt reactors can use the nuclear waste as raw material and use the other 99.5% of the available energy. Another exciting use of Plutonium is when we finally dismantle the nuclear arsenal and burn it for peaceful use. And there is four times as much Thorium as there is mine-able Uranium, enough for thousands of years!
This is the beginning!
Here are 30 reasons why Thorium is a superior source for nuclear power:
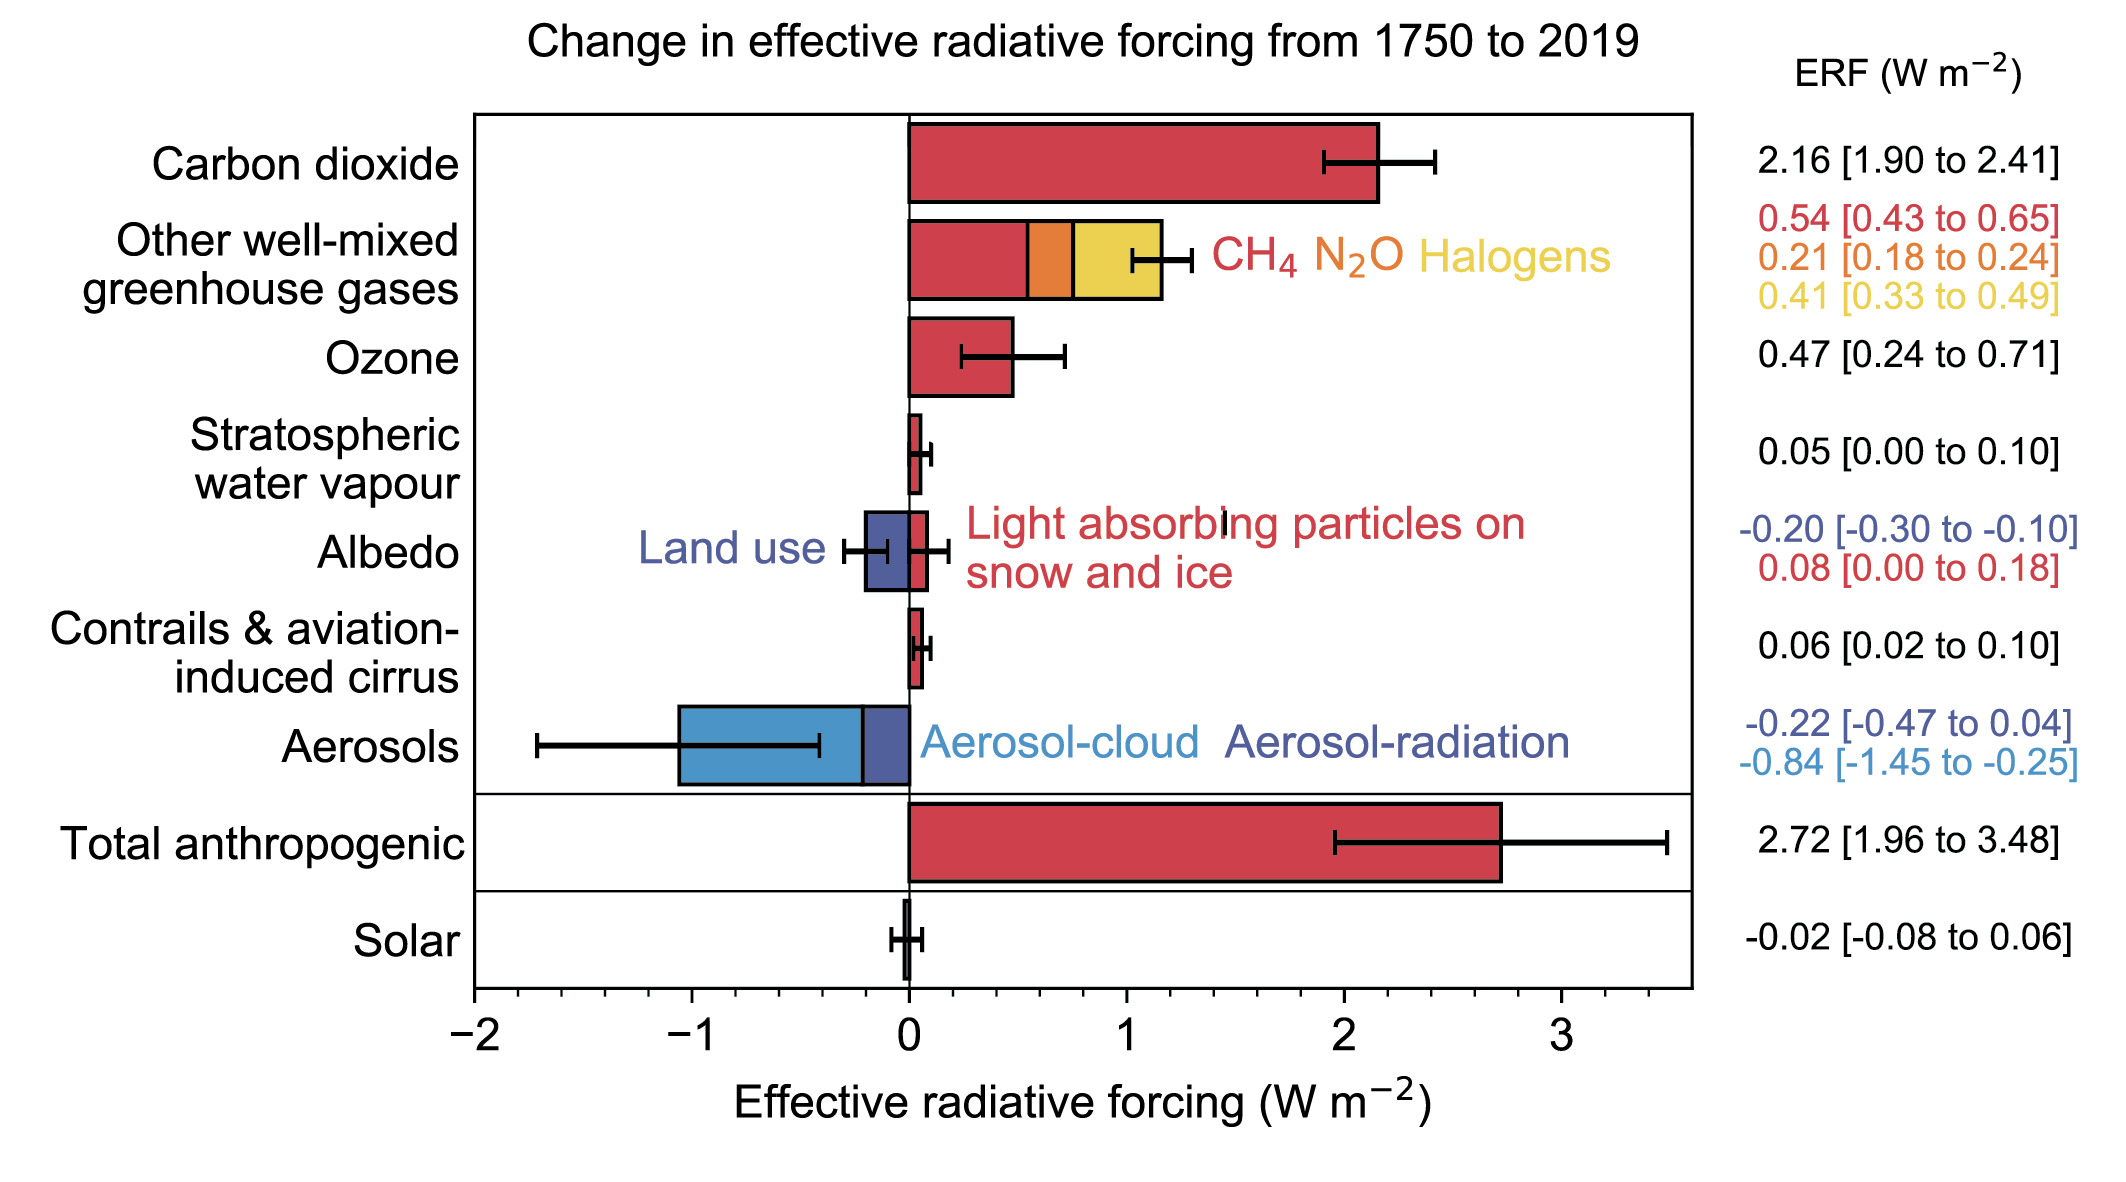
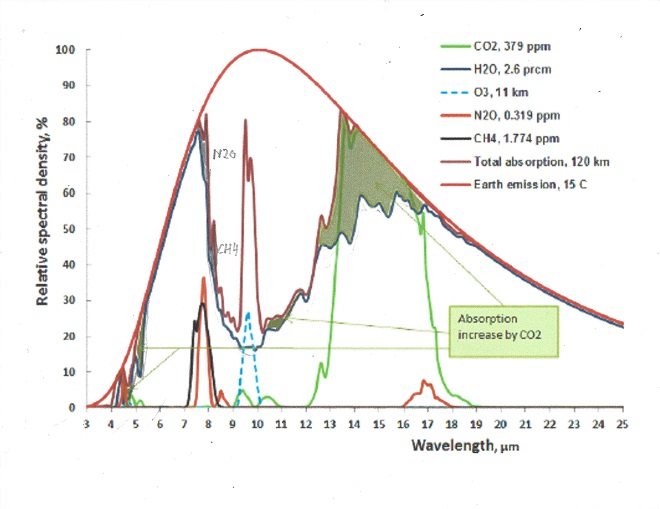
By far, the strongest greenhouse gas is water vapor, not because it is very strong of itself, but it absorbs nearly all outgoing energy in the infrared spectrum except in the so called atmospheric window, where it only partially absorbs. Yet water vapor is missing from the IPCC AR6 chart seen here:
IPCC has consistently treated the effect of greenhouse gasses as additive, but it is impossible to absorb more than 100% of all emitted energy for a given wavelength. This leads to an overestimation of absorption when 2 or more gasses are present. For example, if CO2 absorbs 90% of available energy at 13 μm and water vapor another 50%, the sum is 90% + (1 -0.9} * 0.5 = 95%, not 140%
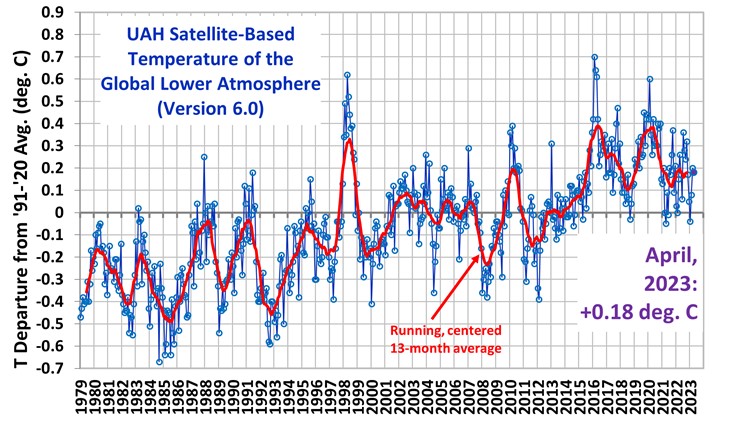
This will change the relative importance of greenhouse gasses drastically so it must be tested against reality. We now have a good global satellite temperature record from 1980 to 2022 or 43 years:
During this time the temperature rise was 0.5 C, which translates to 2.375 W/m2 ERF
Water vapor.
This is a good chart to see the relative importance of all major greenhouse gasses:
It is to be noted that water vapor also absorbs the incoming solar radiation in certain wavelengths, but solar influx is assumed to be constant.
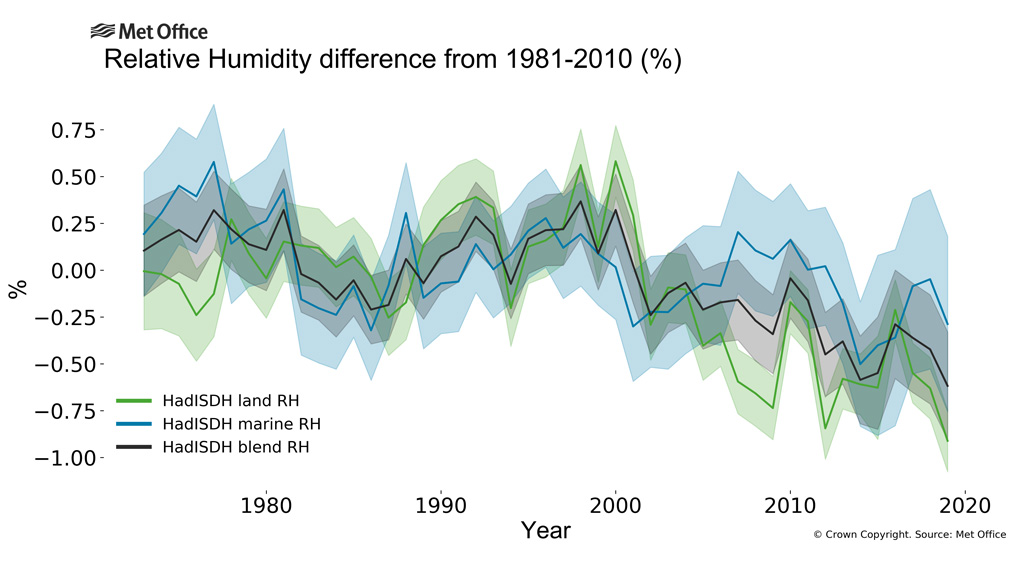
When average temperature rises 0.5 C, the possible absorption rises by 2.375 W/m2 minus the energy that escapes through the atmospheric window.Water vapor through saturation: is responsible for all of this increase except where other gasses also absorb in the atmospheric window, and in the atmospheric window the absorption must be proportionally shared, subject to the 100% absorption limitation.The atmospheric window is about 26% of all the emitted radiation so net water absorption is 0.74 * 2.375 = 1.6 W.m2 or 0.34 C. However, the relative humidity is also decreasing, see picture:
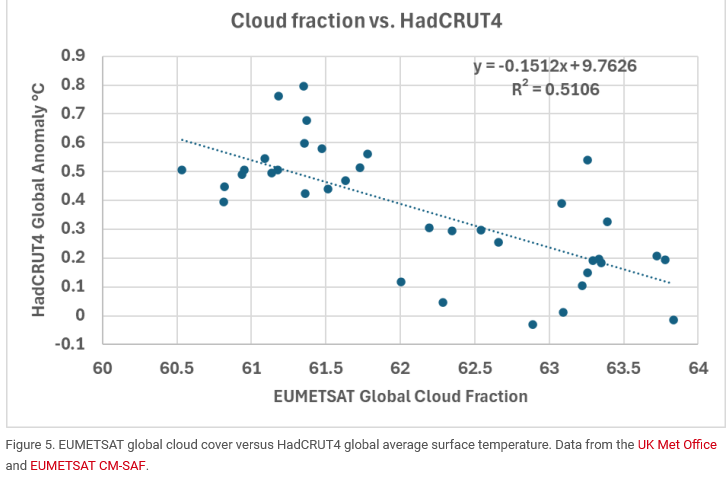
Between 1980 and 2022 the net humidity increase is 3.6% minus 0.75% relative humidity for a net increase of 3.54%. This increase only matters in the atmospheric window which is on average 25% saturated, so the total increase from water vapor increase is 0.26 * 2.375 * 0.25 * 0.9925 = 0.15 W/m2 or 0.03 C., to be added to the total before increase in humidity.This means that for a 0.5C temperature increase between 1980 and 2022 the total sensitivity to water vapor is 1.75 W/m2 or 0.37 C. A confirming picture of the total cloud cover shows the , but temperature sensitivity to the decline in cloud cover between 1980 and 2015
This is of course a very crude method, since it incorporates all temperature rises from all sources, which is 0,5C degrees, from which should be deducted the 0.08C rise from all. This is of course a very cruse assessment of the influence of clouds vary greatly between low clouds, middle clouds and high clouds; as well as when they occur, day or night, and even what time of day they appear. Because of this complexity IPCC has consistently failed to give clouds their full respect. The clouds are the main regulator of temperature on earth!
Carbon dioxide
CO2 is the strongest greenhouse gas after water vapor. The only wavelength band that is meaningful is 13 to 17.4 μm and absorption occurs from both CO2 and water vapor. Since they exist together, the effect of each of them must be proportionally allocated, or the sum of them added would exceed 100%
Between 1980 and 2022 the CO2 levels rose from 335 ppm to 415 ppm or 24% increase. The temperature increase 0.5 C. The net temperature increase or ERF in the 13 to 17.4 μm band is 0.035C or +0.17 W/m2 for the water vapor and 0.04C or +0.19 W/m2 for the CO2. To see how the calculation was made, go to Appendix 1.
Methane.
Methane gas is created from a variety of sources, both man made and natural. See pie chart
The good thing about methane is that its lifetime in the atmosphere is only 10 to 15 years, and the real contribution to climate change is only 1/5th of what is commonly advertised, since iits absorption bands occur together with partly saturated absorption from water vapor. See appendix 2.
In 1980 the CH4 concentration was 1.6 ppm and will be 2.0 ppm in 2022 which results in an increase of the greenhouse effect of 0.035 C or 0.17 W/m2 ERF from rising levels of Methane since 1980.
N2O.
Atmospheric N2Olevels averaged 336 ppb (parts per billion) during 2022, about and was 301 ppb in 1980. It is a 300 times stronger greenhouse gas than CO2 by itself, because its absorption is not saturated in the atmosphere. When water vapor is dominant it is diminished by over 70% since it is at the edges of the Atmospheric window. For calculations see Appendix 3.
In 1980 the N2O concentration was 0.3 ppm which results in an increase of the greenhouse effect of 0.0065 C or 0.031 W/m2 ERF from rising levels of N2O since 1980 .
Ozone.
Ozone occurs as stratospheric O3 which is good. It protects us from uv radiation. O3 in the troposphere is considered harmful if it is over 0.08% It is normally around 0,01% in the troposphere. For calculations and figures, see appendix 4.
When the earth’s temperature rises by 0.5C, from 1980 to 2022, the amount of tropospheric O3 probably rises by 2% (Lacking good data I am guessing wildly, in urban areas it may be much more, but this is global average). This comes to 0.0034C temperature increase or 0.016 W/m2 ERF from O3, from 1980 to 2022.
CFC gasses.
CFC’s are cheap and efficient gasses to use in refrigerators and air conditioners.Their use rose rapidly until it was discovered they destroyed the protective ozone layer in the stratosphere, so its use, got banned in 1994, later diminished including its use in inhalers. CFCs has since diminished slowly and is maybe already below the levels in 1980. See also Appendix 5.
HFC gasses.
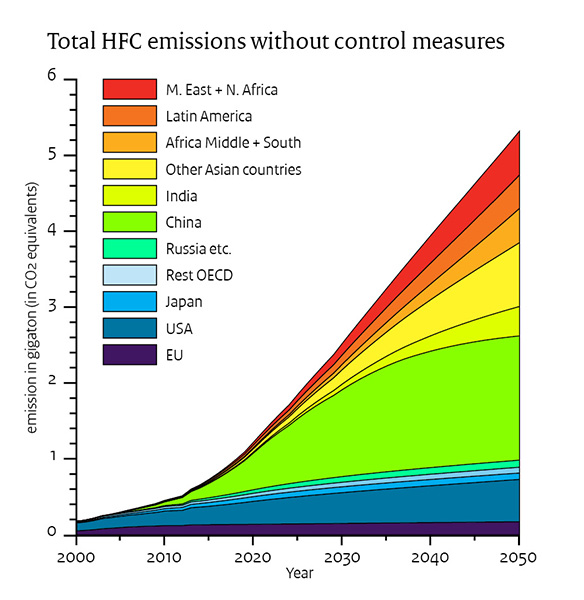
HFCs replaced CFCs and are rapidly growing in use, and the compressor seals still leak. For pictures on why they are a growing concern for the future, see Appendix 6.
The temperature increase from 1980 to 2022 was 0.0015 C or 0.007 W/m2 ERF.
Summary of all greenhouse effect causes for temperature rise from 1980 until 2022:
Effect from water vapor increase: 0.37 C or 1.75 W/m2; 80.9% of total
Effect from rising CO2: 0.04C or 0.19 W/m2; 8.78% of total
Effect from rising Methane: 0.036 C or 0.17 W/m2, 7.86% of total
Effect from rising N2O: 0.0065 C or 0.031 W/m2 1.4% of total
Effect from rising Ozone: 0.0034C or 0.016 W/m2 0.7% of total
Effect from rising HFCs : 0.0015 C or 0.007 W/m2 0.3% of total
TOTAL TEMPERATURE CHANGE 1980 to 2022: 0.4544C or 2.164 W/m2
Conclusion
CO2 amounts to less than 10% if the temperature increase since 1980, and so does Methane. The green new deal is a pipe dream that does not solve the climate problem, but will make it worse.the price of lithium carbonate used in batteries has risen sixteen-fold between 2020 and late 2022. Since then, it has dropped to one third of its peak price. China has corned the market in Lithium for now. There is not enough Lithium to be economically and ecologically justifiable to mine to meet demand in the future. Since solar and wind power are intermittent supplier of electricity they can never be used as base supplier of energy. Other solutions must be offered
Actions to be taken
What congress is doing to solve the problem.
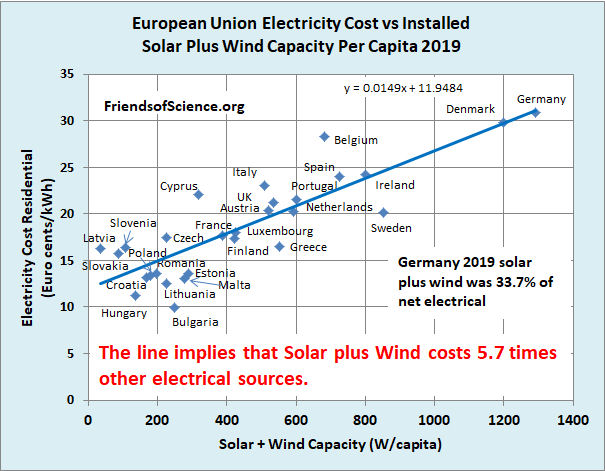
Congress has passed the anti-inflation bill that included over 300 billion to fight climate change, and it included more solar panels and wind turbine motors to be imported from China. The experience from Europe is that electricity from solar panels and windmills is 5.7 times as expensive as conventional power generation.
This analysis was done for 2019, before COVID. The situation is worse now, with electricity rares up to 80 c/kWh, topping $1 /kWh last winter in some countries before subsides.
Even at the current increased European Gas prices, the estimated excess expenditures on Weather-Dependent “Renewables” in Europe is still very large: $0.5 trillion in capital expenditures and $1.2 trillion excess expenditures in the long-term.
These simple calculations show that any claim that Wind and Solar power are now cost competitive with conventional fossil fuel (Gas-fired) generation are patently false. The figures give an outline of the financial achievements of Green activists in stopping fracking for gas in Europe, close on to $1.2 trillion of excess costs.
It would be better not to import any solar panels and wind power generators from China and let them pay for the extra cost rather than building more coal burning plants. After all they were planning to build over a thousand new plants between now and 2030, all legal under the Paris accord. This would benefit the world climate much more, since Chinese coal plants are far more polluting, since China has far less stringent environmental regulations than U.S.
U.S. uses 13.5% of the world’s coal, and eliminating U.S. CO2 emissions would in time reduce the world temperature by 0.023C, providing no other country, such as China and India would increase their use of Coal, which they are, to the total of 1300 new coal plants between now and 2030. This would raise global temperature by more than 0.06 C.
What congress should do instead.
a. What congress should do immediately.
Immediately stop downblending U 233 and pass The Thorium Energy security act SB 4242a. See more here.
2. Remove Thorium from the list of nuclear source material. The half-life of Thorium232 is 14 billion years, so its radioactivity is barely above background noise. More importantly, while Thorium is fertile, it is not fissile and should therefore not be included in the list. This would make it far easier to mine rare earth metals, as long as the ore consists of less than 0.05% Uranium, but any amount of Thorium is allowed without classifying the ore “Source material”.
3. Separate nuclear power into 3 categories. a. conventional nuclear power. b. Thorium breeder reactors that make more U233 than it consumes.c. Thorium reactors that reduce nuclear waste, and d. Plutonium and other trans uranium depletion reactors.
4. Stop buying solar panels from China. Stop buying wind turbine generators from China. Let them install those in China and pay 5 times as much for their electricity.
5. Immediately form a commission led by competent people, not politicians; to decide how to best expand the electric grid and to best harden it against electro-magnetic pulses, whether solar or nuclear and to safeguard it against sabotage.
6. Remove all subsidies on electric cars, solar panels and wind generators, but continue to encourage energy conservation.
7. Encourage research and development of Thorium fueled reactors, especially liquid salt reactors by drastically simplifying and speeding up the approval process. President Trump issued an executive order in the last month of his presidency EO 13972 specifying that the United States must sustain its ability to meet the energy requirements for its national defense and space exploration initiatives. The ability to use small modular reactors will help maintain and advance United States dominance and strategic leadership across the space and terrestrial domains. This EO should be expanded to include civilian small modular reactors, including Liquid salt Thorium reactors less than 200 MW, which are the only valid reactors for space exploration.
Appendix 1, CO2
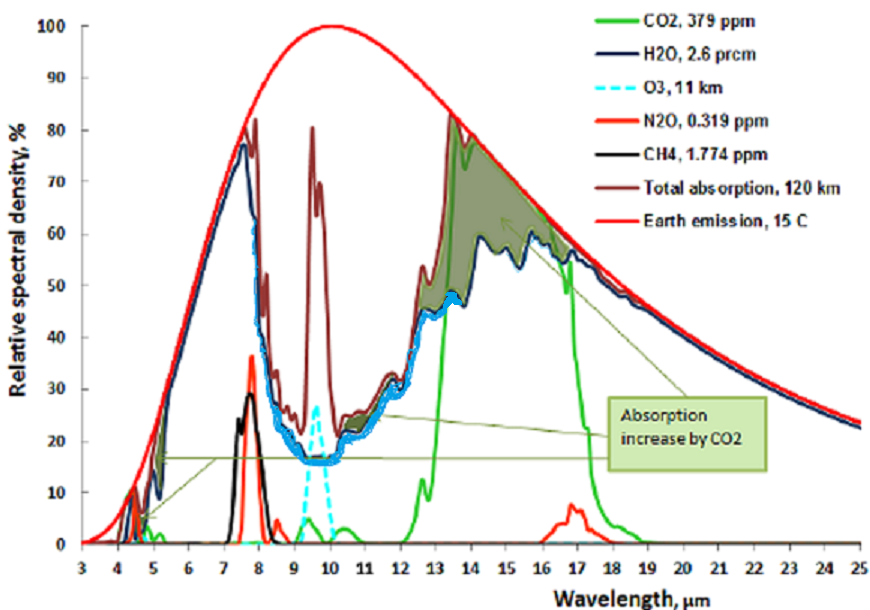
The following chart shows both CO2 and H2O are absorbing greenhouse gases, with H20 being the stronger greenhouse gas, absorbing over a much wider spectrum, and they overlap for the most part. But it also matters in what frequency ranges they absorb.
For this we will have to look at the frequency ranges of the incoming solar radiation and the outgoing black body radiation of the earth. It is the latter that causes the greenhouse effect. Take a look at this chart:
The red area represents the observed amount of solar radiation that reaches the earth’s surface. the white area under the red line represents radiation absorbed in the atmosphere. Likewise, the blue area represents the outgoing black body radiation that is not absorbed. The remaining white area under the magenta, blue or black line represents the retained absorbed energy that causes the greenhouse effect.
Let us now take a look at the Carbon Dioxide bands of absorption, at 2.7, 4.3 and 15 μm. Of them the 2.7 and 4.3 μm bands absorb where there is little black body radiation, the only band that counts is at 14.9 μm, and that is in a band where the black body radiation is near its maximum. Let us first consider the CO2 alone in a dry atmosphere, that is one with no water vapor at all. We will investigate the concentration of 335 ppm (in 1980) and 415 ppm (in 2022)
The very top line of the top black band represents total absorption at 415 ppm, the bottom of the black black band represents absorption at 335 ppm. Divide the frequency spectrum in 3 parts, below 14 μm, 14-16 μm, and above 16 μm, In the 13 to 14 μm band 66% of available energy is absorbed at 335 ppm, 70% at 415 ppm. in the 14 to 16 μm band 100% of available energy is absorbed at both 335 and 415 ppm. In the > 16 μm the numbers are also 66 and 70%. In addition, temperature is 0.5 C higher at 415 than at 335 ppm, so available energy is 0.7 % higher at 415 ppm.
The net result is greenhouse gas contribution for CO2 is 5.10 C at 335 ppm and 5.26 C at 415 ppm and 1.5C higher ambient temperature for a dry atmosphere.
The normal way to account for greenhouse gasses contribution is to simply add together the CO2 contribution and the contribution from water vapor. This leads to the wrong result for in doing so, the total result is more than 100% for some energy band, because it is impossible to add more than 100% of all available energy for a given wavelength. Again, the spectrum of interest is 13 to 17.4 μm.
The first thing to notice is that no absorption exceeds 100% , so at 14.9 μm wavelength CO2 absorbed 100%, and water vapor absorbed another 75%, the total sum is still 100%. It is impossible to absorb more than 100% of the total energy available for that wavelength. Therefore between the wavelengths 14 and 16 μm all energy was absorbed regardless of CO2 concentration and water vapor concentration. The only fair way to allocate the absorption is proportionally, 57% to CO2 and 43% to water vapor. Likewise, the 13 to 14 μm band is not fully saturated, so the total absorption is 62% of available energy for CO2 and 33% for water vapor. In the 16 to 17.4 μm range the total absorption is 44% for CO2 and 55 % for water vapor. For CO2 at 335 ppm and average temp 13.5 C the total temperature rise, when proportionally allocated comes to 2.73 C for the CO2 and 2.30 C for the water vapor. For CO2 at 415 ppm and an average temp 0.5 C higher, at 14 C average the net temperature increase or ERF in the 13 to 17.4 μm band is 0.035C or +0.17 W/m2 for the water vapor and 0.04C or +0.19 W/m2 for the CO2.
Appendix 2, Methane
Atmospheric methanelevels averaged 2.0 ppm (parts per million) during 2022, or around 25% greater than in 1980. It is a 28 times stronger greenhouse gas by itself unlike CO2, because its absorption is not saturated in the atmosphere. On the other hand the lifetime of Methane in the atmosphere is 10 to 15 years, some of the Methane eating bacteria will do its job. There is only one significant absorption band that absorbs in the atmospheric window at 7.7 μm, at the edge of the atmospheric window.
The picture shows a small peak at 7.7μm. This is because at lower wavelengths absorption from water vapor has nearly eliminated the CH4 contribution. Remember that total absorption can never exceed 100 %, so the maximum absorption from CH4 occurs at 7.7μm. At 1.6 ppm it amounts to a greenhouse effect of 0.68 C for a dry gas.
The only major absorption line at 7.7 μm has two side lobes, at 7.5 and 7.9 μm. In the 7.5 μm sideband water vapor already absorbs nearly all energy, so the NH4 is of little effect. In the 7.9 μm sideband water vapor is 50% saturated at that level and the NH4 net absorption is 20% the net greenhouse effect is one fifth of the effect for a dry gas, or 0.14 C. In 1980 the CH4 concentration was 1.6 ppm and will be 2.0 ppm in 2022 which results in an increase of the greenhouse effect of 0.035 C or 0.17 W/m2 ERF from rising levels of Methane since 1980
Appendix 3, N2O.
Atmospheric N2Olevels averaged 336 ppb (parts per billion) during 2022, about and was 301 ppb in 1980. It is a 300 times stronger greenhouse gas than CO2 by itself, because its absorption is not saturated in the atmosphere. When water vapor is dominant it is diminished by over 70% since it is at the edges of the Atmospheric window. On the other hand the lifetime of N20 in the atmosphere is short and is typically greatest at 5 p.m. One of the major reasons for the N2O increase is the increase of fertilization with nitrates, the other is from diesel fumes from trains, boats, ships, trucks and mining equipment
The picture shows a double N2O peak at 7.4 and 7.8 μm. . At 0.336 ppm in 2022it amounts to a greenhouse effect of 0.325 C for a dry gas. In the 7.4 μm band water vapor is saturated, in the 7.8 μm band 80% is saturated by water vapor.In 1980 the N2O concentration was 0.3 ppm which results in an increase of the greenhouse effect of 0.0065 C or 0.031 W/m2 ERF from rising levels of N2O since 1980 .
N2O is commonly called laughing gas, and is hazardous in high concentrations, and should be limited in confined places, but in concentrations of under 1 ppm nobody laughs because of that.
Appendix 4, Ozone.
Ozone or 03 is good if it is in the stratosphere. There it helps to absorb the ultraviolet and cosmic rays from the sun and other cosmic radiation. Ozone is bad if it is near the ground. The total proportion of O3 in the troposphere is about 0.01 ppm, yet it is a substantial greenhouse gas because it forms by uv radiation in the stratosphere and mesosphere, and thus protecting us from uv damage. See figure:
The O3 in the troposphere on the other hand is bad. It is normally around 0.01 ppm, but is considered damaging if people are exposed to more than 0.08 ppm in an 8 hour period. This can happen in urban environments in warm and stagnant weather, typically through car traffic. It is a great greenhouse gas because its main absorption band is at 9.5 μm, right in the atmospheric window where the outgoing black body radiation is the greatest. See fig:
The dotted blue line at 9.5 μm represents the tropospheric absorption, the total absorption is between the brown and the solid blue line. The total greenhouse effect from O3 is 0.88C, but the stratosphere does not interact very much with the troposphere, so the stratospheric O3 does not count as a greenhouse gas, only tropospheric O3. The total contribution to the greenhouse effect from tropospheric O3 is about 1/5 of the total, because atmospheric O2 absorbs in the same band limits the temperature rise to 0.17C When the earth’s temperature rises by 0.5C, from 1980 to 2022, the amount of tropospheric O3 probably rises by 2% (Lacking good data I am guessing wildly, in urban areas it may be much more, but this is global average). This comes to 0.0035C temperature increase or 0.016 W/m2 ERF from O3, from 1980 to 2022.
Appendix 5, CFC gasses.
ChloroFluoroCarbon (CFC) gasses started to be manufactured at the beginning of the refrigeration age, replacing ice as the refrigerant. It soon appeared in the atmosphere, mostly due to leaks in the air conditioner compressor seals. It didn’t amount to much as a greenhouse gas even though it was five thousand times more efficient than CO2 as a greenhouse gas. It was discovered that CFCs ate up the Ozone in the stratosphere, and if it continued to increase it could deplete the protective Ozone layer faster than it could be produced. In fact it created an Ozone hole over Antarctica. So it got forbidden Jan 17, 1994, In 2020 even China stopped production. Since 1994 CFC are decreasing by about 1% per year, but cheating persisted, especially among poorer nations and China. By 2022 it will probably have a greenhouse effect of 0.01C or 0,05 W/m2 ERF.
Appendix 6, HFC gases.
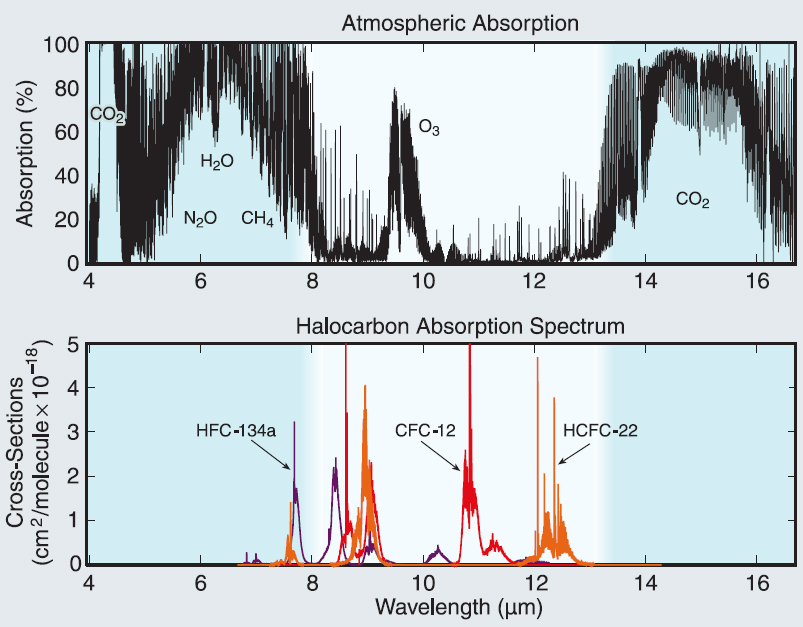
CFC started to be phased out and replaced by HydroFluoroCarbons (HFC), less efficient and more expensive, but at least they do not deplete the Ozone layer that protects us from cancer. Some of the HFCs are even bigger greenhouse effect generators than CFC, but well worth it to protect the Ozone layer. Their biggest absorption bands are in the middle of the atmospheric window.
If nothing is done to control them they will increase from nothing in 1980 until 2022 and beyond. See fig: NOAA Research News
The temperature increase from 1980 to 2022 was 0.0014 C or 0.007 W/m2 ERF..
I have been praying for a revival for a few years, This time it is critical, and when it comes it will be worldwide thanks to the power of internet and what it means for both good and evil. It has enabled the spiritual warfare to increase to unprecedented levels. There was a time not long ago when people communicated with each other, went to church on Sunday and endured yet another sermon they had heard three years ago and it was time to preach it again according to the three year cycle, and not much happened, but there was a few people who prayed for a revival, such a one that had happened before in their youth. Such it was on the Lewis part of the island of Lewis and Harris in the outer Hebrides, and this short video will tell the story vividly. This was while Donald Trump was still president:
More than four years have passed, and the world is no longer the same. In 2020 the Abraham accords were signed, and we were looking for and anticipated transitioning into a time of peace. The opposite did indeed happen; the time was not yet ready for a revival. People were still asleep, not aware of the fullness of evil. The 2024 election is upon us, and we are still not fully aware of who the contestants really are, 28% of the people want to know more about Kamala Harris, but only 9% want to know more about Donald Trump. I didn’t know this about him until a few days ago, when I looked up Duncan Campbell and the1949 Hebrides’ revival, the beginning of which he vehemently denied he had originated. He claimed the revival had already started when he arrived, thanks to the two old ladies and the young Donald Smith.
Anyhow the Bible given to Donald Trump by his mother was used at the 2017 presidential. inauguration together with the 1861 Bible used by Abraham Lincoln at his taking the oath of office.
This is an example of the synergy of the ages .Two elderly shut-in ladies prayed for years for a revival, and nothing happened, but suddenly it did, and the effect lasts for generations
Pray for the revival. God uses the most unlikely characters to accomplish His purposes.
I have been praying for a revival for a few years, This time it is critical, and when it comes it will be worldwide thanks to the power of internet and what it means for both good and evil. It has enabled the spiritual warfare to increase to unprecedented levels. There was a time not long ago when people communicated with each other, went to church on Sunday and endured yet another sermon they had heard three years ago and it was time to preach it again according to the three year cycle, and not much happened, but there was a few people who preyed for a revival, such a one that had happened before in their youth. Such it was on the island of Lewis in the inner Hebrides, and this short video will tell the story vividly:
This is the day of the one and only presidential debate, and 28% of the people want to know more about Kamala Harris, but only 9% want to know more about Donald Trump. I didn’t know this about him until a few days ago, when I looked up Duncan Hines and the Hebrides revival, a fact he vehemently denied. He claimed the revival had already started when he arrived, thanks to the two old women and the young Donald Smith.
Anyhow the Bible given to Donald Trump by his mother was used at the 2017 presidential. inauguration together with the 1861 Bible used by Abraham Lincoln at his taking the oath of office.
This is an example of the synergy of the ages .Two elderly shut-in ladies prayed for years for a revival, and nothing happened, but suddenly it did, and the effects goes down for generations
Pray for the revival. God uses the most unlikely characters to accomplish His purposes.
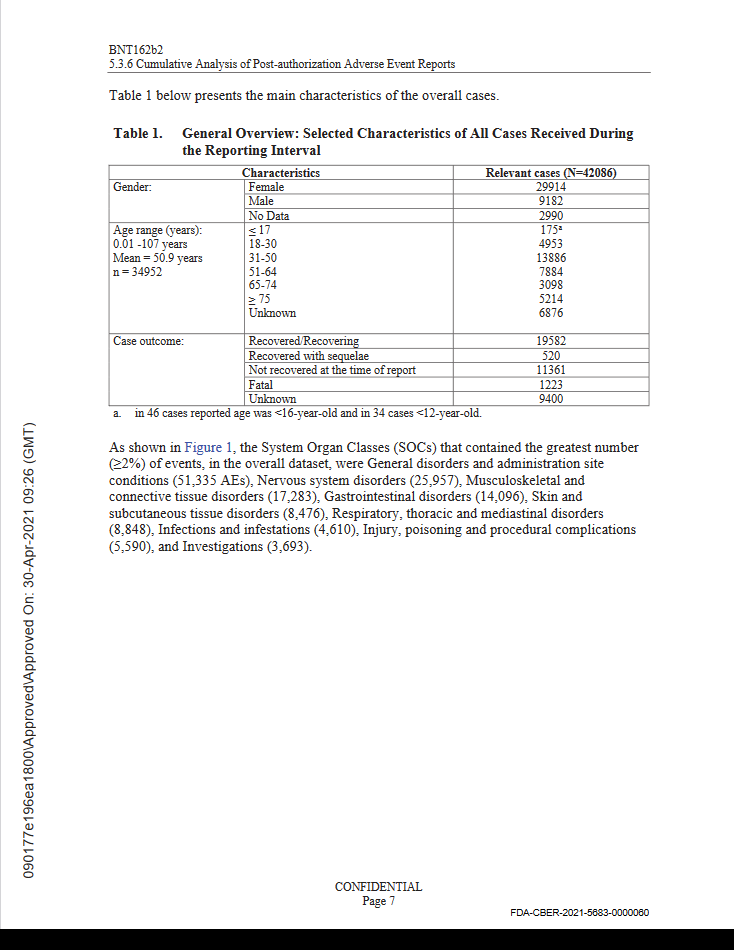
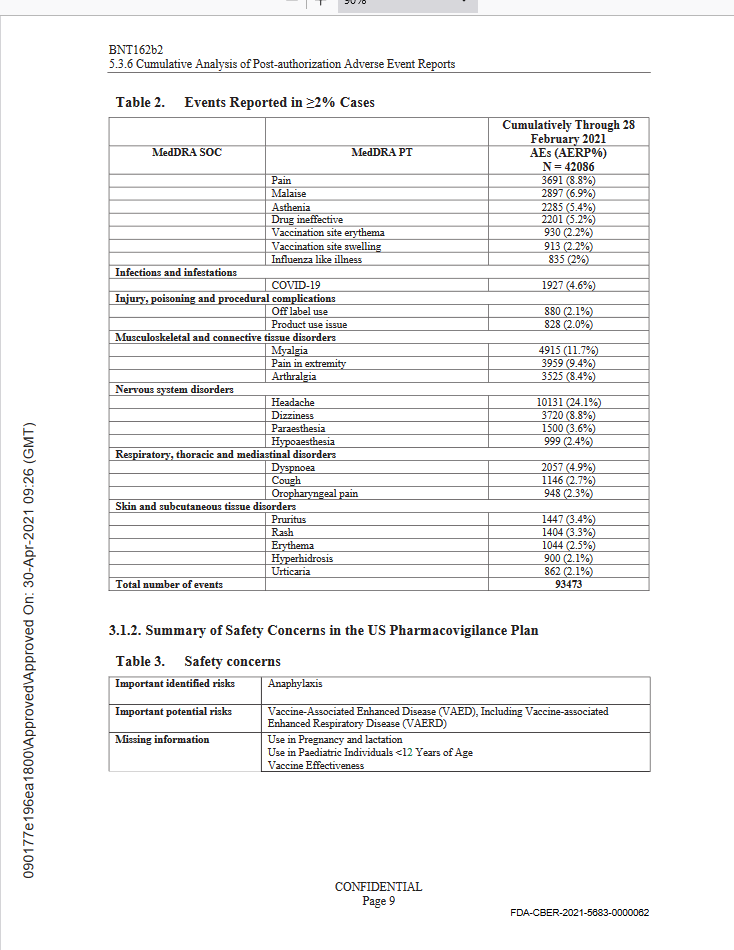
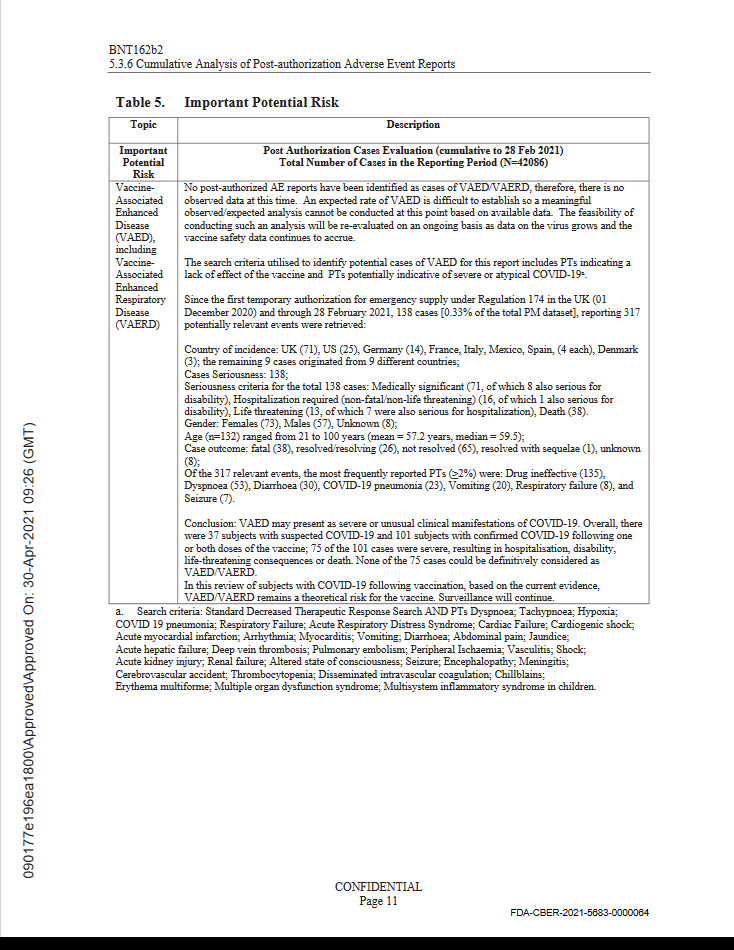
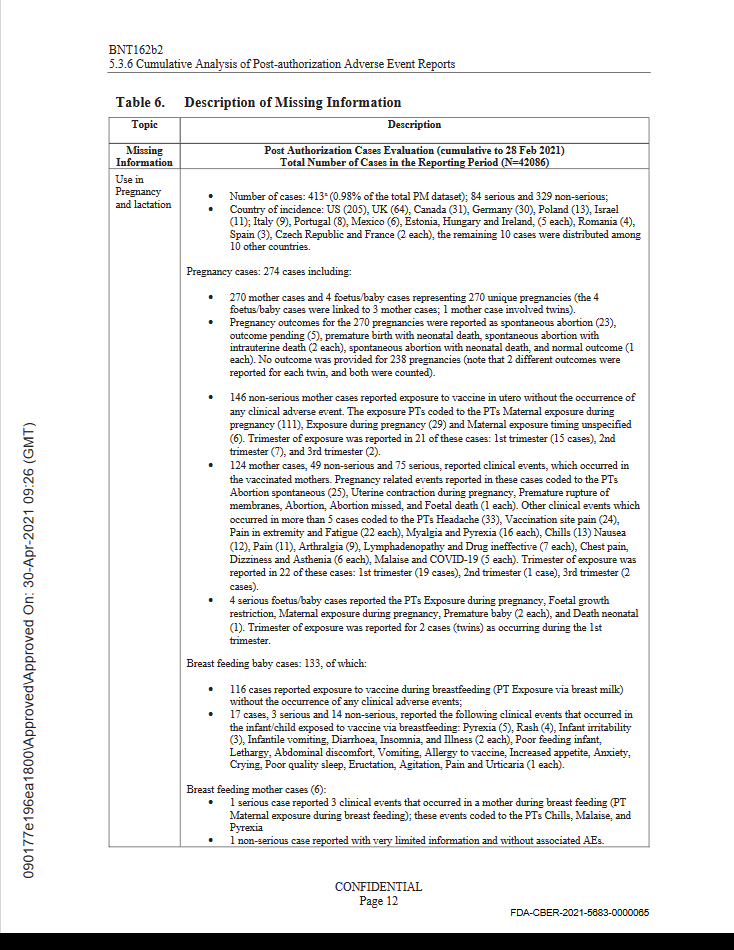
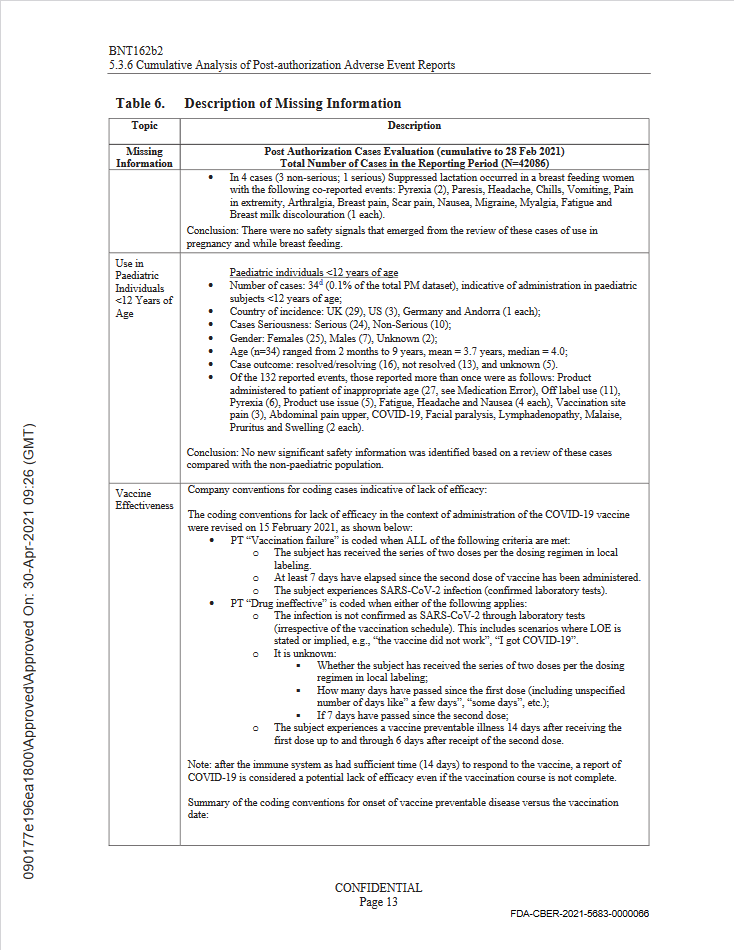
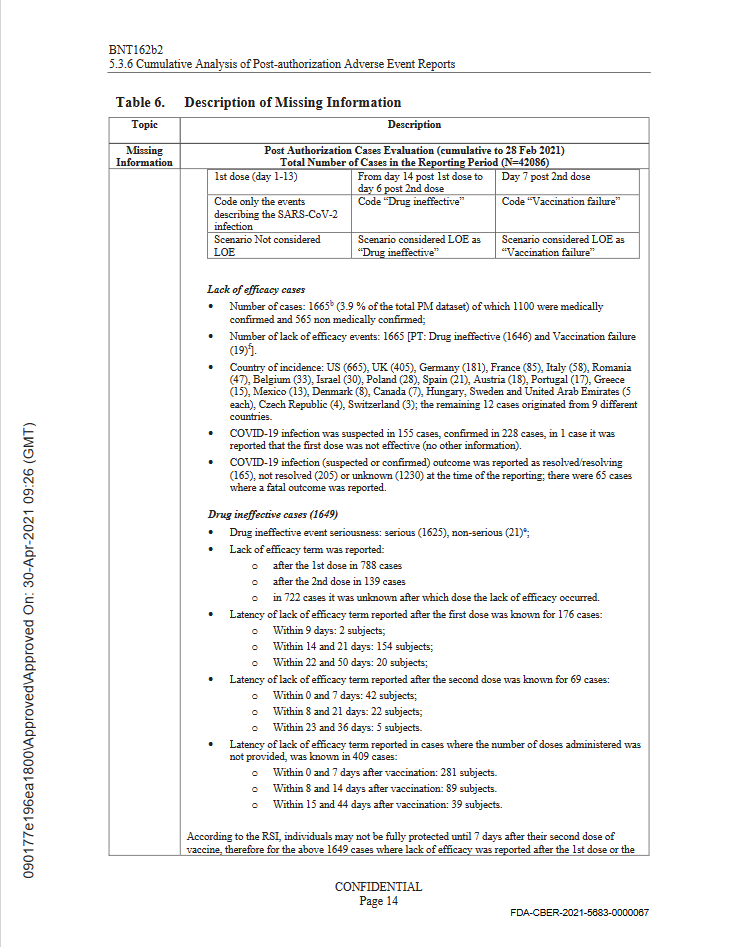
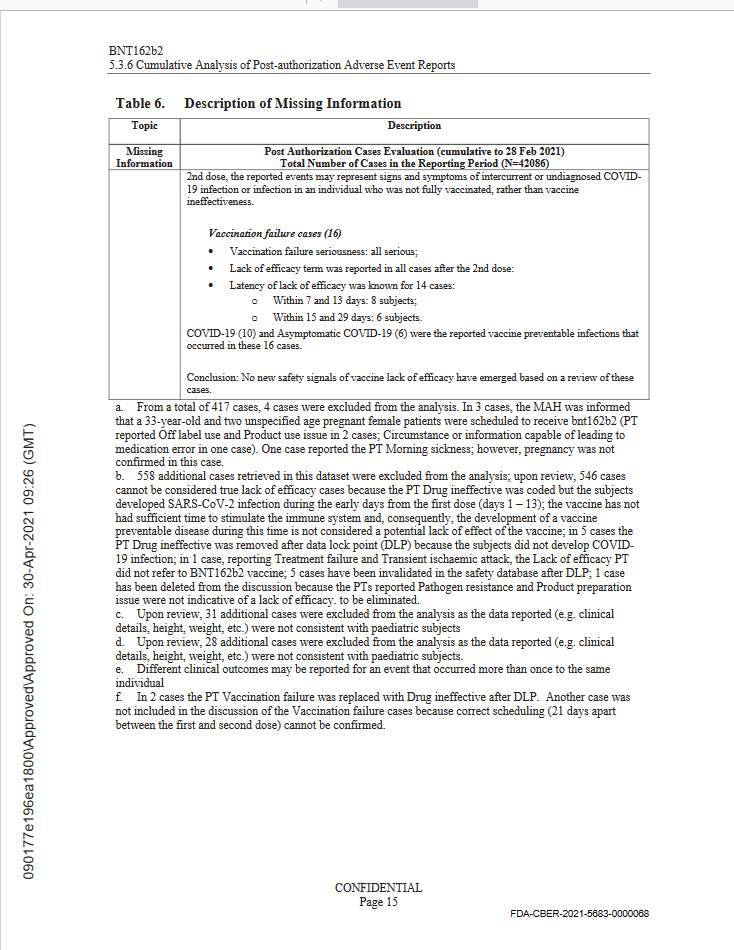
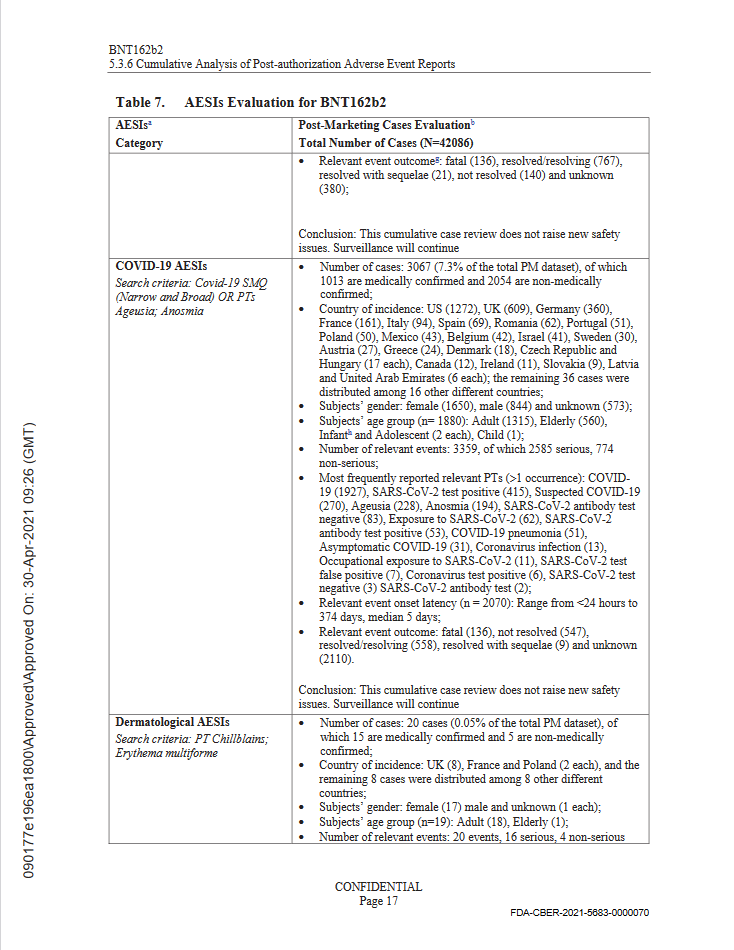
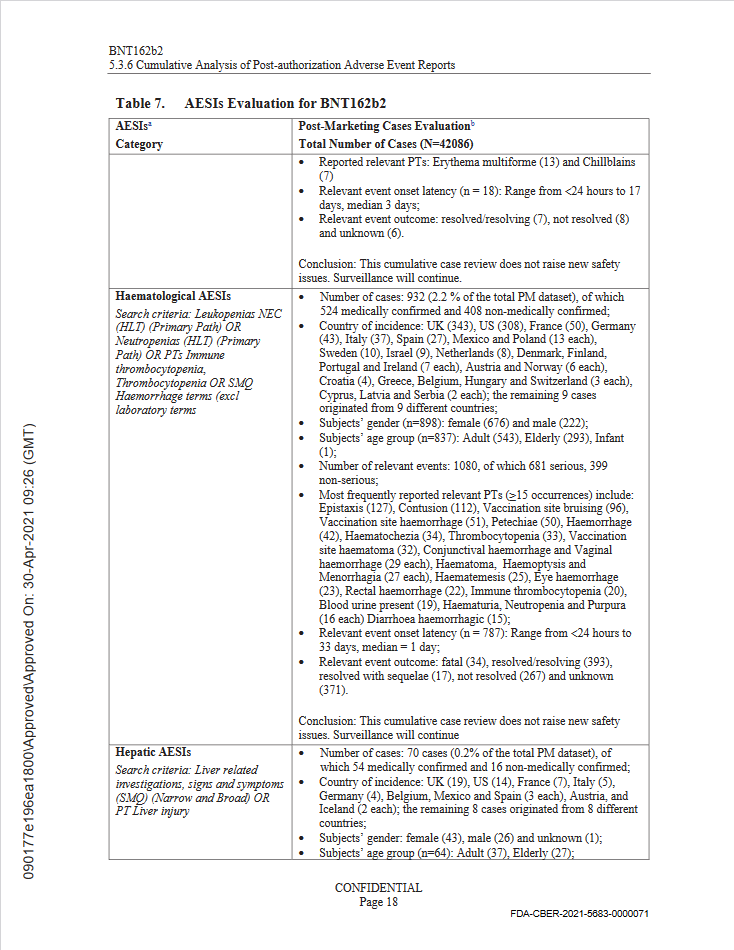
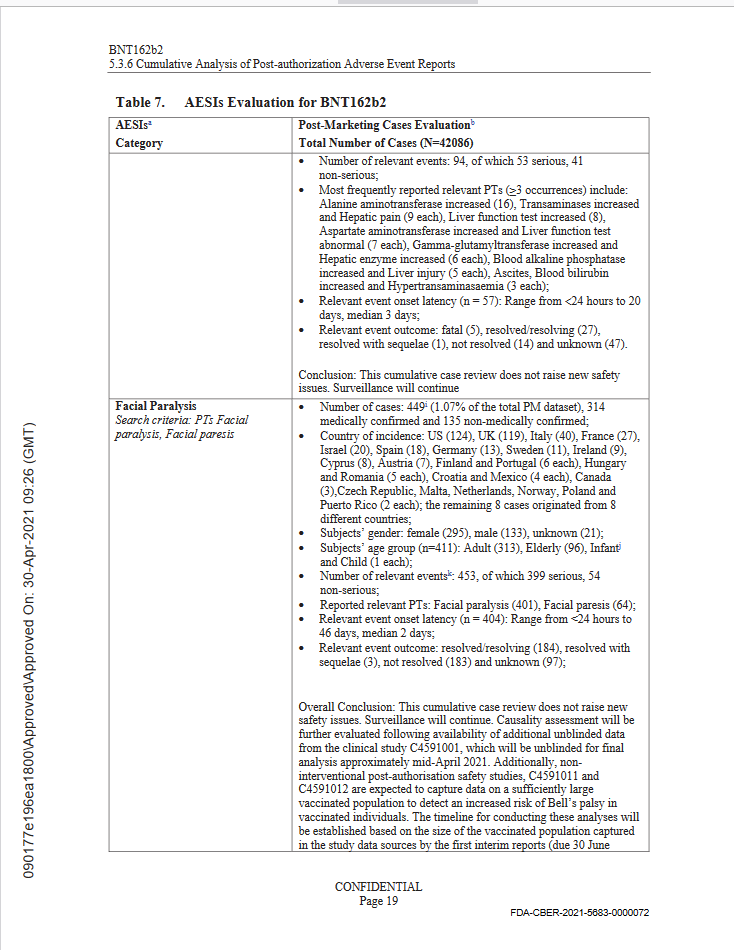
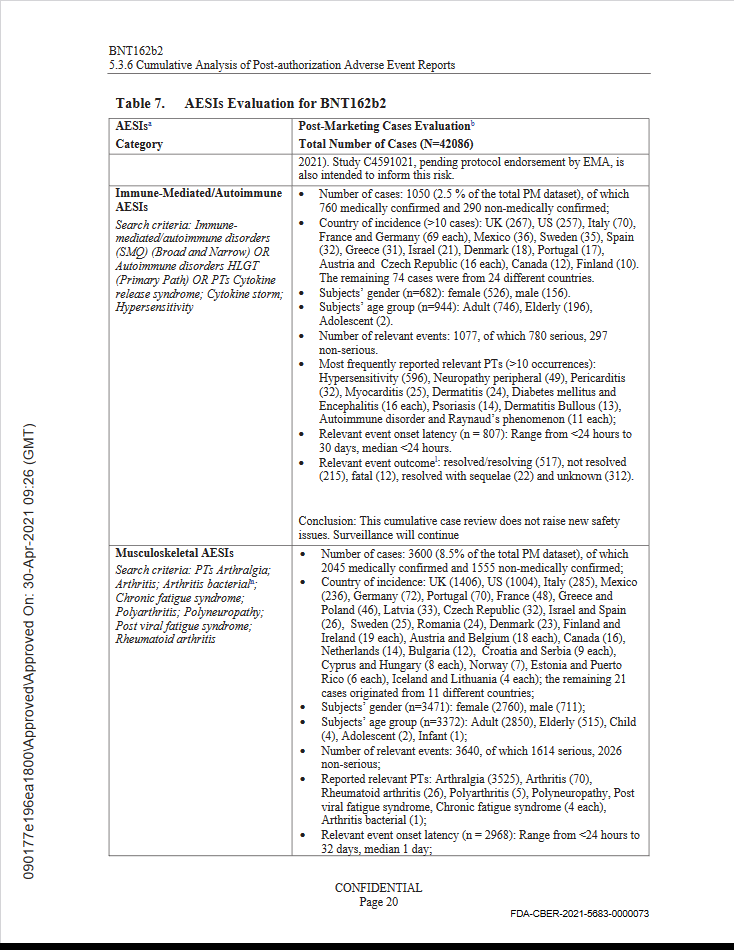
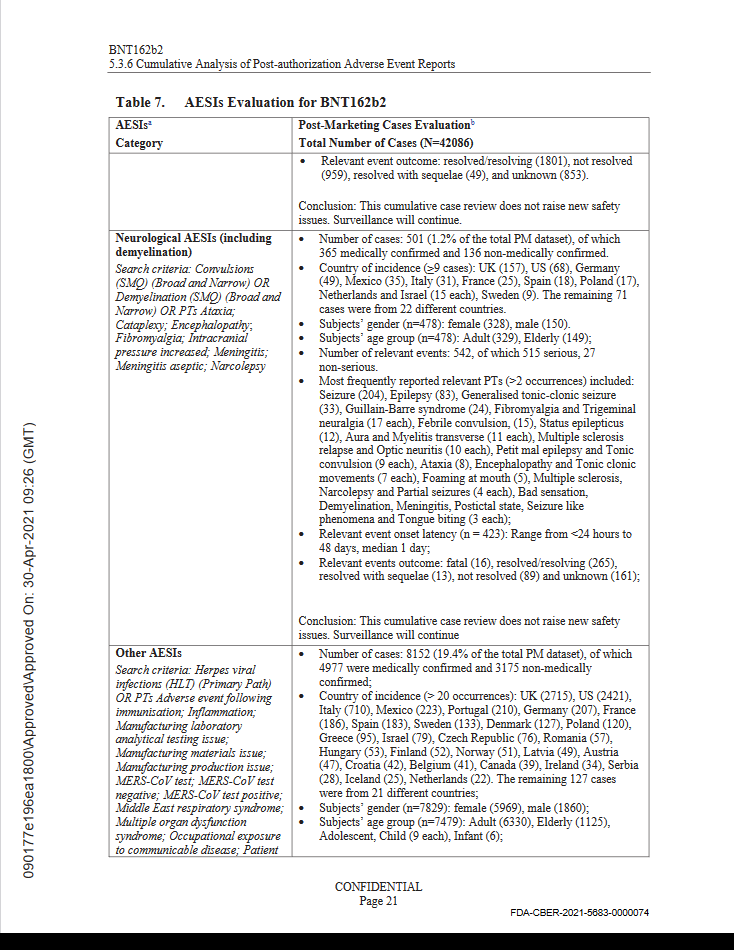
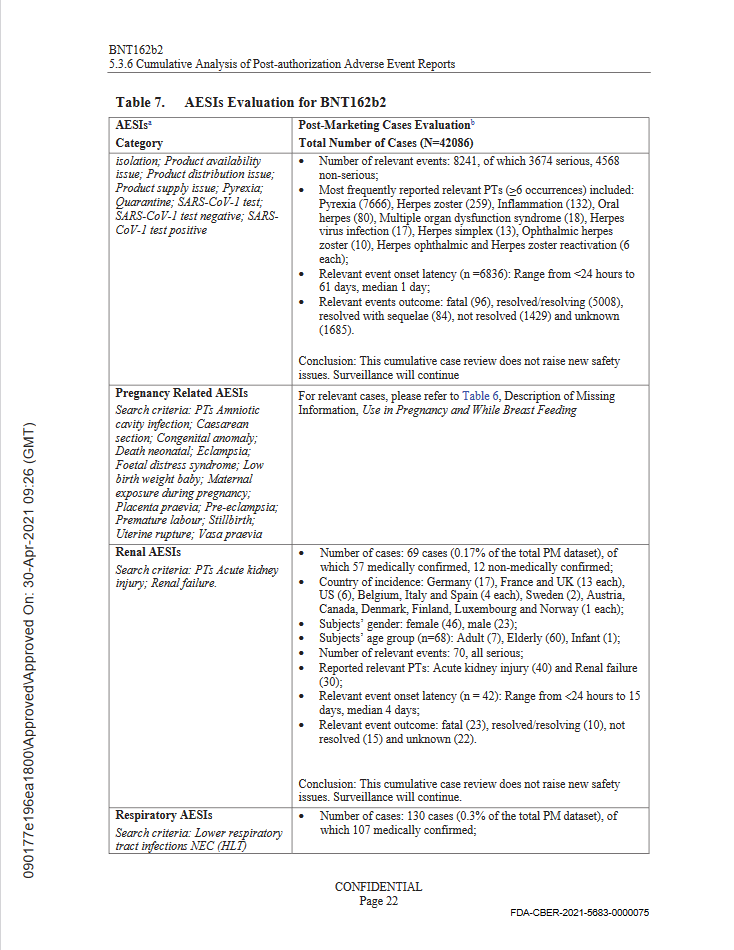
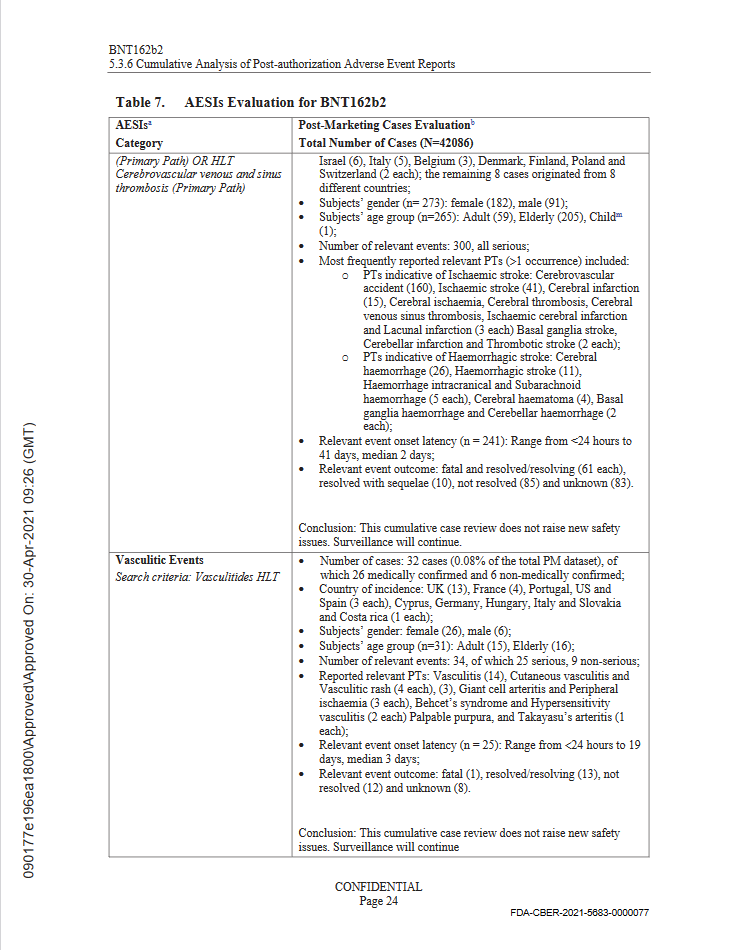
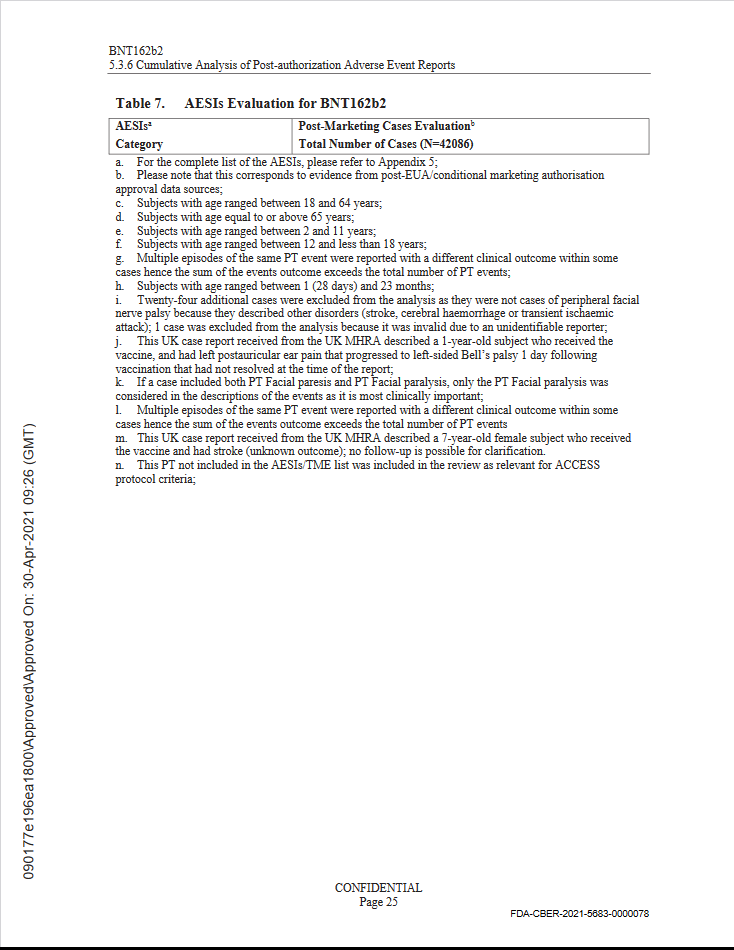
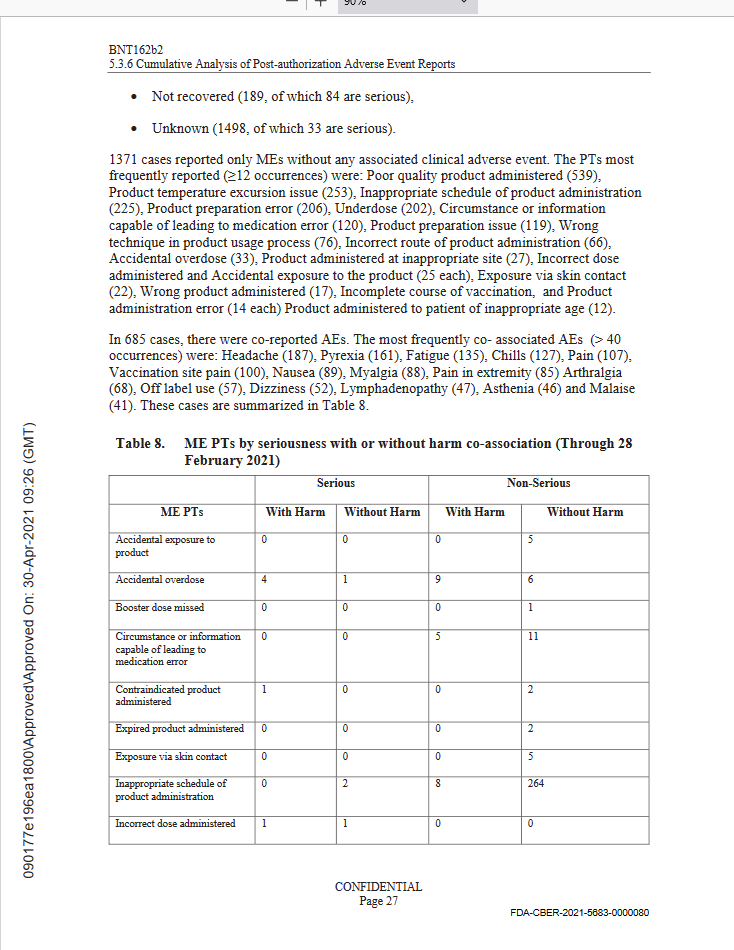
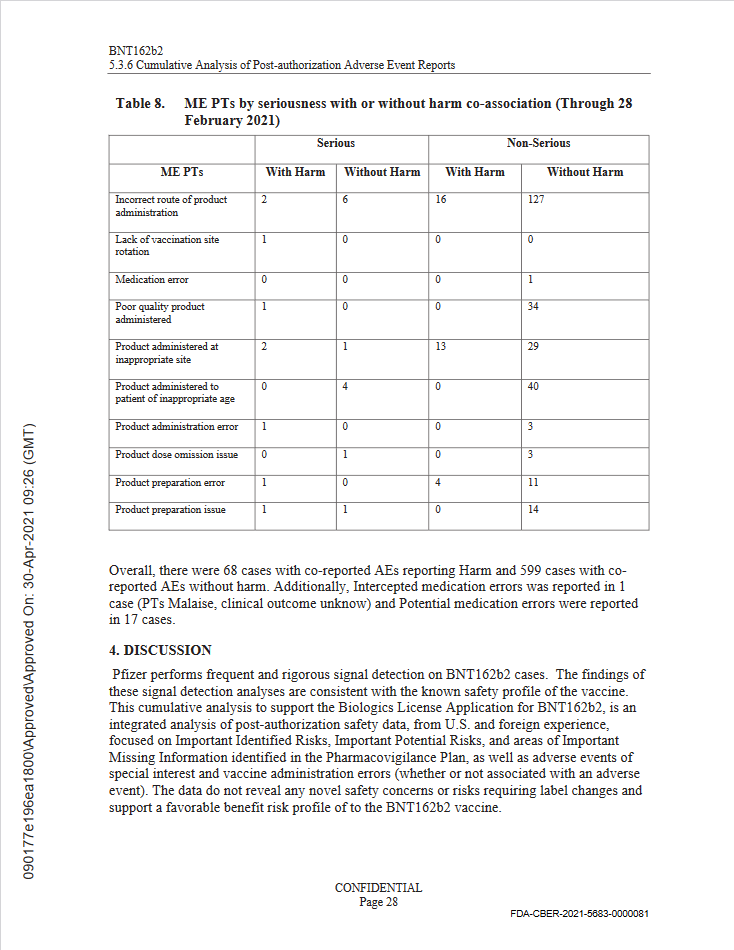
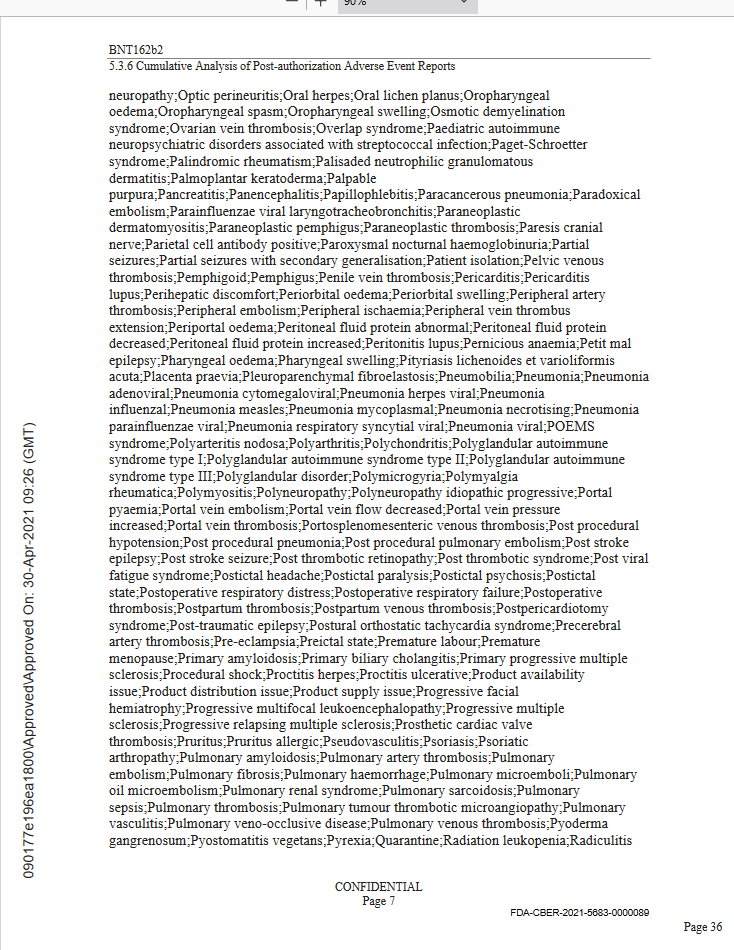
Moderna invented a new way of making vaccines in late 2010’s and Pfizer did likewise. It got patented. All they had to do was to wait for the right pandemic, prophesied by Anthony Fauci in the beginning of Trump’s presidency: He will have to deal with a “surprise outbreak”. The opportunity came with the outbreak of COVID-19, and within 10 days Pfizer and Moderna had a suggested vaccine ready to be mass produced. President Trump jumped at the opportunity to develop it at “warp speed” by promising to buy the first few million doses whether they worked or not. To further speed it up they skipped the animal steps and went directly to human subjects, whether pregnant or not. The initial few months looked promising, so one week after the 2020 election the vaccine was approved for emergency use. (It takes 9 months to complete a pregnancy). The first doses were administered mid December , and the VAERS results were evaluated, and Pfizer compiled the data up to Feb 28 2021. The results were publicized internally Apr 30, 2021 and subsequently shared with the White House senior staff, including the Surgeon General. The White House freaked out and held a number of emergency meetings, and May 21 published comforting words that there was nothing to be afraid of, the vaccine is working perfectly as designed.
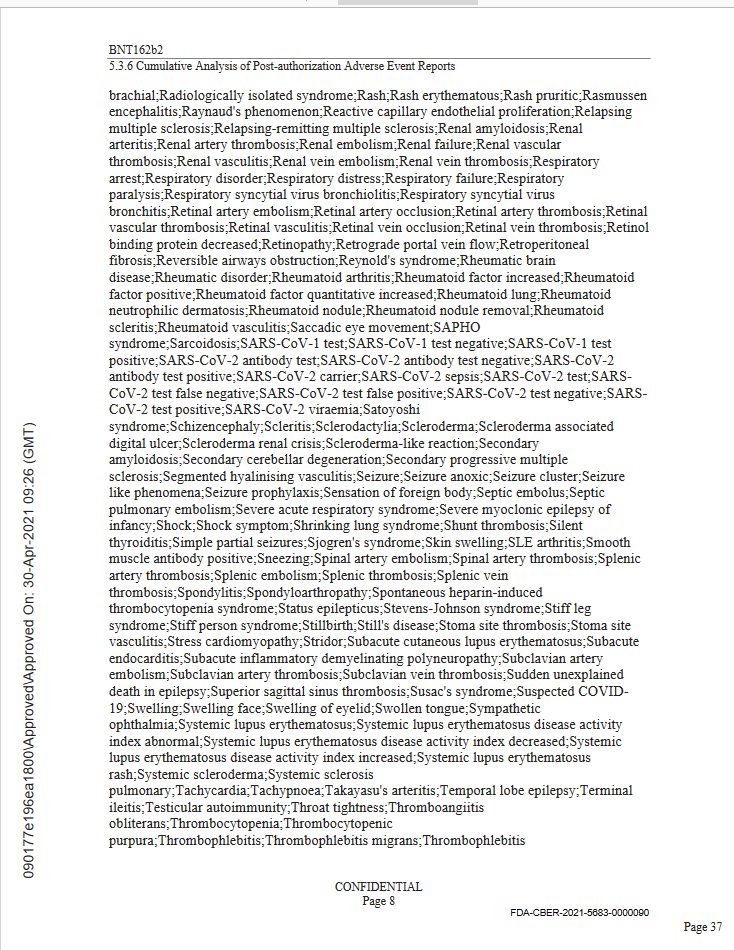
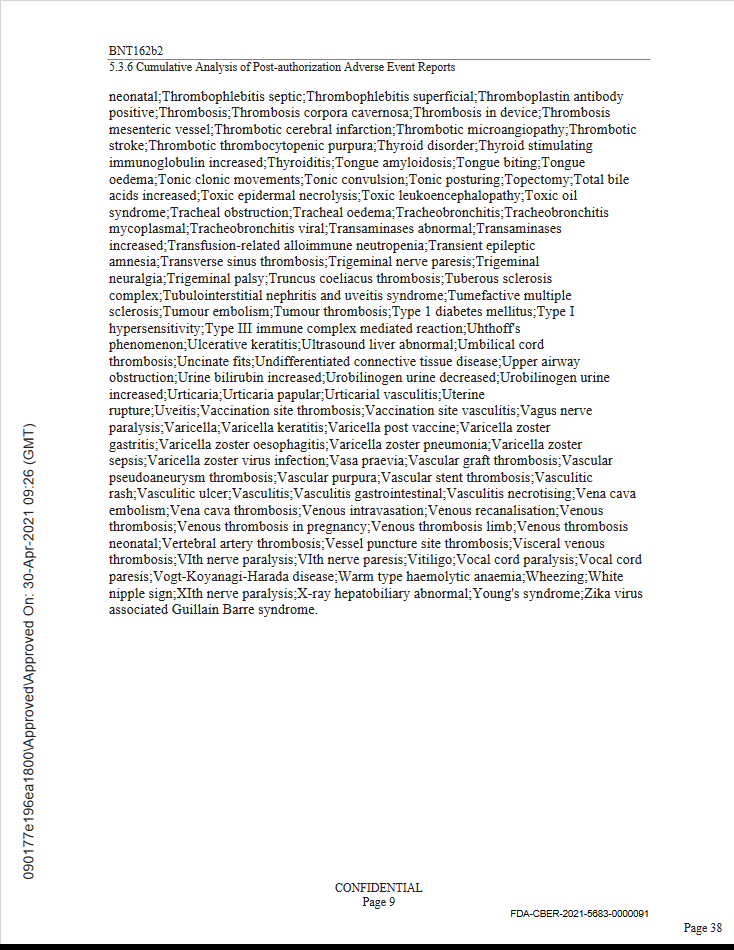
Be that as it may, here is the Pfizer report as of Apr 30 2021.
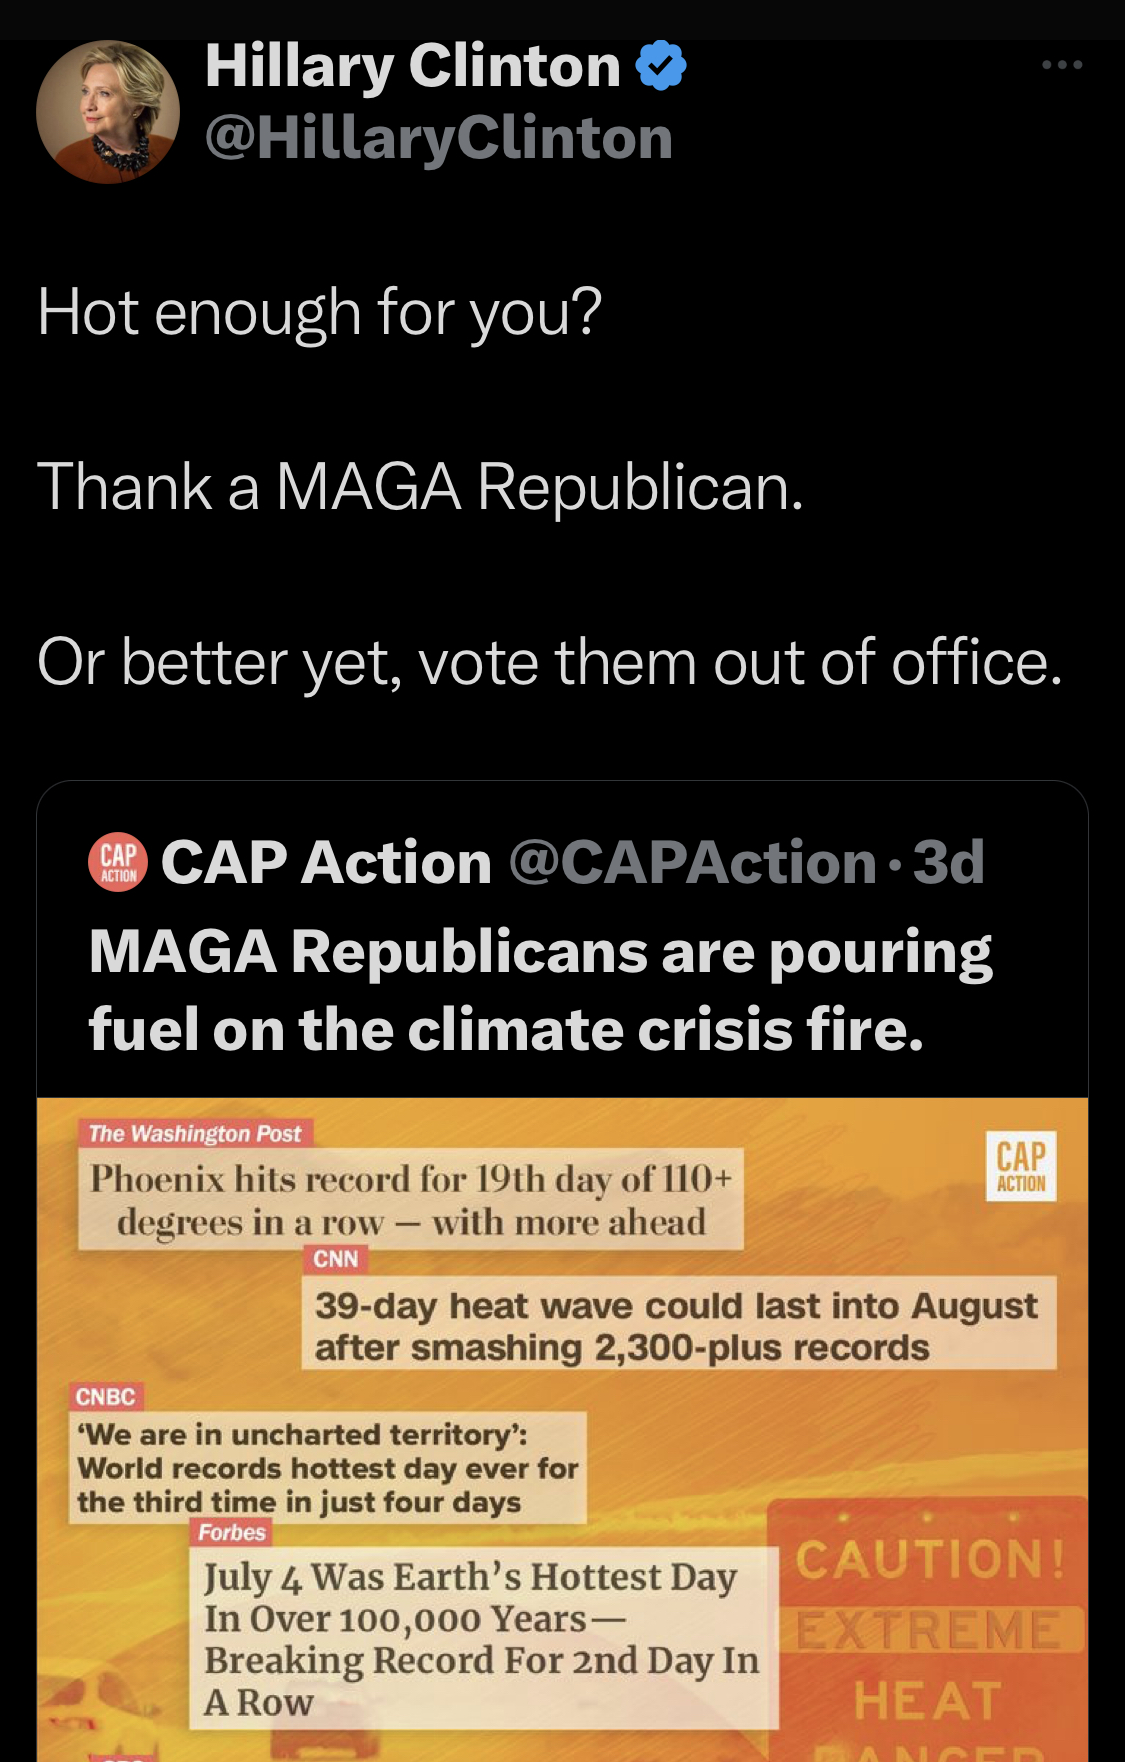
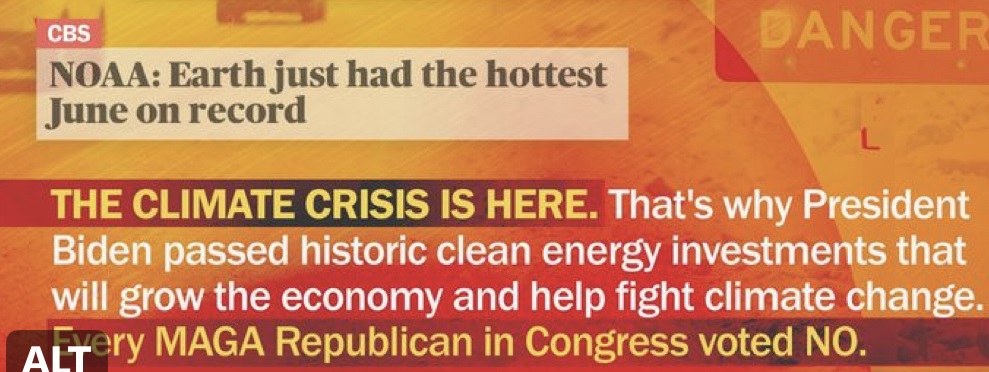
This tweet from the twice defeated presidential candidate and 2016 election denier Hillary Clinton caught my attention for its many factual errors. This is the forwarded tweet:
It begins with factual recording from the Washington Post. It is a record string of very hot days in Phoenix. In fact, today is the 25th day of over 110F, and continuing.
The next headline is from CNN tells of the heat wave all over the south, where nearly every community in the area shows one heat record after another. The count is more than twice as high now. The heat wave continues. About the only record not broken is the maximum temperature in Death Valley, still standing at 134°F (57°C) on July 10, 1913.
Not to be outdone, MSNBC chimes in with “We are in uncharted territory”, which is true since worldwide satellite measurements didn’t start until 1979. So it isn’t very surprising that new records will be set. The time frame is only 44 years.
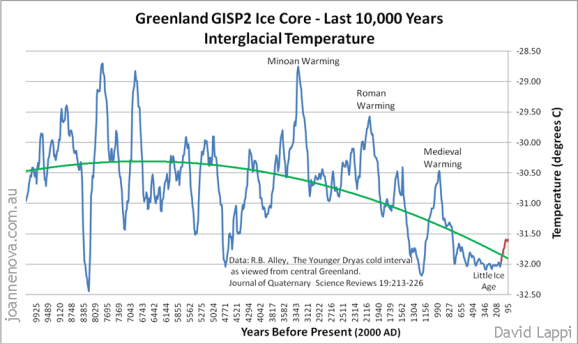
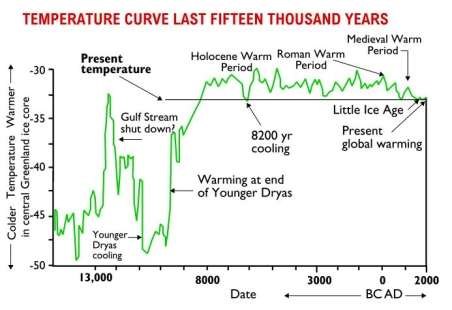
But Forbes magazine takes the cake: The once serious business publication states that July 4 was the hottest day in over 100,000 years! The real temperature after the little ice age isn’t even back to the medieval warm period, much less the Roman warm period, even less than the Minoan warming
Even more interesting is the temperature in the Holocene Climate optimum:
From this chart we can see, even as there were no global measurements taken it was warmer during 8000 of the last 10,000 years, at least according to the Greenland Ice Cores.
But back to the Hillary tweet: CBS claimed that Earth just had the hottest June on record. What they forgot to mention was “since worldwide satellite records began in 1979”
This calls for a Limerick
The Climate change pace in this plot
shows voting next fall means a lot.
No original sin
if Republicans win
since temperatures will be less hot.
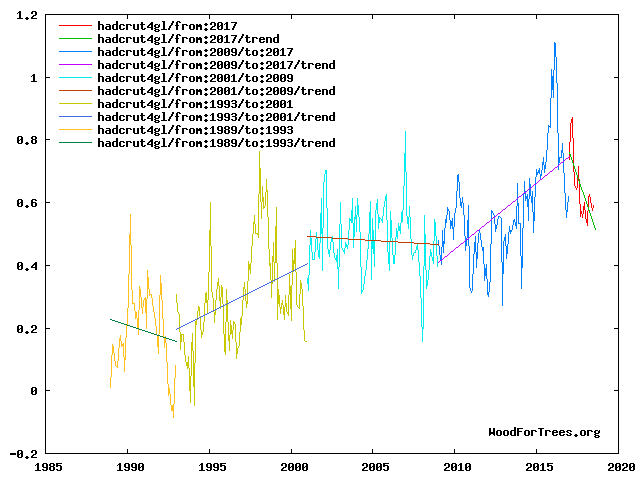
From Wattsupwiththat.com comes this interesting plot: (Thanks, David Middleton)
From this we can see that the global temperature changes according to hadcrut4gl are:
During the presidency of George H W Bush temperatures fell by 0.20 C/decade
During the presidency of Bill Clinton temperatures rose by 0.26 C/decade
During the presidency of George W Bush temperatures fell by 0.04 C/decade
During the presidency of Barack H Obama temperatures rose by 0.42 C/decade
So far , during the Presidency of Donald J Trump global temperatures have receded 0.24 C.
President Donald J Trump ended his presidency with a temperature decline of 0.37C/decade.
So far, during Joe Biden ‘s presidency temperatures are up 0.18C, and that was before the latest heatwave.
It seems the hot air is coming from Democrats, and with Republicans cooler minds prevail
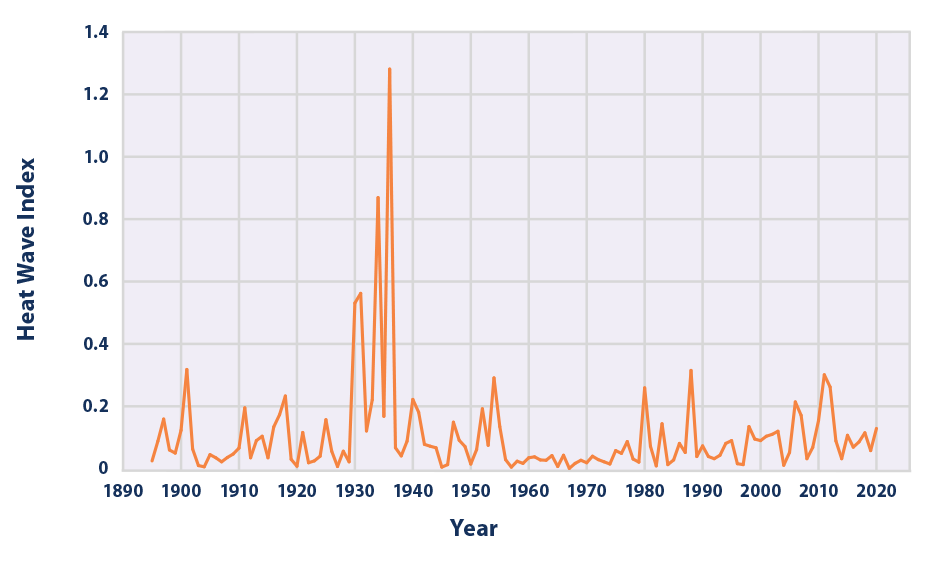
And a bonus question. During the 1930s the number, length and severity of U.S heatwaves was much worse. Who was president for most of that time?
Oh and by the way, in the 1930s the CO2 level was around 300 ppm. It is now 418.4 ppm or 40% higher.
Section 1. Purpose. Nuclear energy is critical to United States national security. That is why I have taken a series of actions to promote its development and facilitate its use. On June 29, 2017, I announced an initiative to revive and expand the nuclear energy sector and directed a complete review of United States nuclear energy policy to help find new ways to revitalize this crucial energy resource. On July 12, 2019, I signed a Presidential Memorandum entitled “The Effect of Uranium Imports on the National Security and Establishment of the United States Nuclear Fuel Working Group,” with the goal of examining the current state of domestic nuclear fuel production and reinvigorating the nuclear fuel supply chain, consistent with United States national security and nonproliferation goals. On August 20, 2019, I signed National Security Presidential Memorandum-20, entitled “Launch of Spacecraft Containing Space Nuclear Systems,” calling for development and use of space nuclear systems to enable or enhance space exploration and operational capabilities.
The purpose of this order is to take an important additional step to revitalize the United States nuclear energy sector, reinvigorate America’s space exploration program, and develop diverse energy options for national defense needs. Under this action, the United States Government will coordinate its nuclear activities to apply the benefits of nuclear energy most effectively toward American technology supremacy, including the use of small modular reactors for national defense and space exploration. This work is critical to advancing my Administration’s priorities for the United States to lead in research, technology, invention, innovation, and advanced technology development; its mission to promote and protect the United States national security innovation base; its drive to secure energy dominance; and its commitment to achieving all of these goals in a manner consistent with the highest nuclear nonproliferation standards.
The United States was the first nation to invent and develop the technology to harness nuclear energy. Since the 1950s, the United States Navy has been operating and advancing transportable nuclear reactors, resulting in powerfully enhanced marine propulsion for its aircraft carriers and allowing nuclear-powered submarines to remain submerged for extended periods of time.
The United States must sustain its ability to meet the energy requirements for its national defense and space exploration initiatives. The ability to use small modular reactors will help maintain and advance United States dominance and strategic leadership across the space and terrestrial domains.
Sec. 2. Policy. It is the policy of the United States to promote advanced reactor technologies, including small modular reactors, to support defense installation energy flexibility and energy security, and for use in space exploration, guided by the following principles:
(a) A healthy and robust nuclear energy industry is critical to the national security, energy security, and economic prosperity of the United States;
(b) The United States should maintain technology supremacy for nuclear research and development, manufacturing proficiency, and security and safety;
(c) The United States Government should bolster national defense and space exploration capabilities and enable private-sector innovation of advanced reactor technologies.
Sec. 3. Demonstration of Commercial Reactors to Enhance Energy Flexibility at a Defense Installation. (a) Micro-reactors have the potential to enhance energy flexibility and energy security at domestic military installations in remote locations. Accordingly, the Secretary of Defense shall, within 180 days of the date of this order, establish and implement a plan to demonstrate the energy flexibility capability and cost effectiveness of a Nuclear Regulatory Commission-licensed micro‑reactor at a domestic military installation.
(b) If the demonstration is successful, the Secretary of Defense shall identify opportunities at domestic military installations where this capability could enhance or supplement the fulfillment of installation energy requirements. In identifying these opportunities, the Secretary of Defense shall take into account considerations that are unique to national defense needs and requirements that may not be relevant in the private sector, such as:
(i) the ability to provide resilient, independent energy delivery to installations in the event that connections to an electrical grid are compromised;
(ii) the ability to operate for an extended period of time without refueling;
(iii) system resistance to disruption from an electro‑magnetic pulse event; and
(iv) system cybersecurity requirements.
Sec. 4. Defense Capabilities. (a) The Department of Defense is one of the largest consumers of energy in the world, using more than 10 million gallons of fuel per day and 30,000 gigawatt-hours of electricity per year, nearly all of which is provided through civilian electrical grids. Fuel demands for a modern United States military have dramatically grown since World War II and are anticipated to continue to increase in order to support high-energy-usage military systems. In this context, nuclear power could significantly enhance national defense power capabilities.
(b) The Secretary of Defense shall, in consultation with the Secretary of State, the Secretary of Commerce, the Secretary of Energy, and the Administrator of the National Aeronautics and Space Administration (NASA Administrator):
(i) determine whether advanced nuclear reactors can be made to benefit Department of Defense future space power needs;
(ii) pilot a transportable micro-reactor prototype;
(iii) direct an analysis of alternatives for personnel, regulatory, and technical requirements to inform future decisions with respect to nuclear power usage; and
(iv) direct an analysis of United States military uses for space nuclear power and propulsion technologies and an analysis of foreign adversaries’ space power and propulsion programs.
Sec. 5. Space Exploration. (a) Nuclear power sources that use uranium fuel or plutonium heat sources are essential to deep space exploration and in areas where solar power is not practical. NASA uses radioisotope power systems, such as radioisotope thermoelectric generators and radioisotope heater units, to provide power and heat for deep space robotic missions. Nuclear power sources in the kilowatt range may be needed for demonstrating In-situ Resource Utilization (ISRU) and robotic exploration of permanently shadowed craters on the Moon that contain frozen water. Nuclear reactors up to 100 kilowatts may be needed to support human habitats, ISRU, other facilities, and rovers on both the Moon and Mars. Power sources in the megawatt range would be necessary for efficient, long‑duration deep space propulsion. Affordable, lightweight nuclear power sources in space would enable new opportunities for scientific discovery. The sustainable exploration of the Moon, Mars, and other locations will be enhanced if small modular reactors can be deployed and operated remotely from Earth.
(b) Within 180 days of the date of this order, the NASA Administrator, in consultation with heads of other executive departments and agencies (agencies), as appropriate, shall define requirements for NASA utilization of nuclear energy systems for human and robotic exploration missions through 2040 and analyze the costs and benefits of such requirements. In defining these requirements, the NASA Administrator shall take into account considerations unique to the utilization of nuclear energy systems in space, such as:
(i) transportability of a reactor prior to and after deployment;
(ii) thermal management in a reduced- or zero-gravity environment in a vacuum or near-vacuum;
(iii) fluid transfer within reactor systems in a reduced or zero-gravity environment;
(iv) reactor size and mass that can be launched from Earth and assembled in space;
(v) cooling of nuclear reactors in space;
(vi) electric power requirements
(vii) space safety rating to enable operations as part of human space exploration missions;
(viii) period of time for which a reactor can operate without refueling; and
(ix) conditioning of reactor components for use in the space environment.
Sec. 6. Domestic Fuel Supply. (a) A thriving and secure domestic nuclear fuel supply chain is critical to the national interests of the United States. A viable domestic nuclear fuel supply chain not only supports defense and national security activities, but also enables the success of the commercial nuclear industry. Many advanced reactor concepts, however, will require high-assay, low-enriched uranium (HALEU), for which no domestic commercial enrichment capability currently exists. The United States must take steps to ensure a viable United States-origin HALEU supply.
(b) The Secretary of Energy shall complete the Department of Energy’s ongoing 3-year, $115 million demonstration of a United States-origin enrichment technology capable of producing HALEU for use in defense-related advanced reactor applications. Within funding available for the demonstration project, the Secretary of Energy should develop a plan to promote successful transition of this technology to the private sector for commercial adoption.
(c) The Secretary of Energy shall consult with the Secretary of Defense, the Director of the Office of Management and Budget, and the NASA Administrator regarding how advanced fuels and related technologies can best support implementation of sections 3, 4, and 5 of this order.
Sec. 7. Common Technology Roadmap. (a) The Secretary of State, the Secretary of Defense, the Secretary of Commerce, the Secretary of Energy, and the NASA Administrator shall develop a common technology roadmap through 2030 that describes potential development programs and that coordinates, to the extent practicable, terrestrial-based advanced nuclear reactor and space-based nuclear power and propulsion efforts. Agencies shall remain responsible for funding their respective mission-unique requirements. The roadmap shall also include, at a minimum:
(i) assessments of foreign nations’ space nuclear power and propulsion technological capabilities;
(ii) pathways for transitioning technologies developed through Federally supported programs to private-sector activities; and
(iii) other applications supporting the goals provided in section 1 of this order.
(b) The roadmap shall be submitted to the President by the Director of the Office of Management and Budget, the Assistant to the President for Domestic Policy, the Director of the Office of Science and Technology Policy, the Assistant to the President for National Security Affairs, the Assistant to the President for Economic Policy, and the Executive Secretary of the National Space Council before submissions of budget proposals by the Secretary of State, the Secretary of Commerce, the Secretary of Energy, and the NASA Administrator.
Sec. 8. Definitions. For purposes of this order:
(a) The term “small modular reactor” refers to an advanced nuclear reactor of electric generation capacity less than 300 megawatt-electric. Because of the smaller size, small modular reactors can generally be designed for factory fabrication and modular construction to take advantage of economies of serial production and shorter construction times.
(b) The term “micro-reactor” refers to a nuclear reactor of electric generation capacity less than 10 megawatt-electric that can be deployed remotely. Micro-reactors are a subset of small modular reactors and are also known as “very small modular reactors.”
(c) The term “transportable micro-reactor” refers to a micro-reactor that can be moved by truck, ship, or large military transport aircraft and is capable of both rapid deployment and teardown or removal, typically with safe teardown or removal less than 1 week after 1 year of full-power operation.
(d) The term “space exploration” refers to in-space scientific and resource exploration, in-space economic and industrial development, and development of associated in-space logistical infrastructure.
(e) The term “national defense” refers to the protection of the United States and its interests from foreign attack or other natural danger, including phenomena occurring on Earth and in space.
Sec. 9. General Provisions. (a) Nothing in this order shall be construed to impair or otherwise affect:
(i) the authority granted by law to an executive department or agency, or the head thereof; or
(ii) the functions of the Director of the Office of Management and Budget relating to budgetary, administrative, or legislative proposals.
(b) This order shall be implemented consistent with applicable law and subject to the availability of appropriations.
(c) This order is not intended to, and does not, create any right or benefit, substantive or procedural, enforceable at law or in equity by any party against the United States, its departments, agencies, or entities, its officers, employees, or agents, or any other person.
DONALD J. TRUMP THE WHITE HOUSE, January 5, 2021. WhiteHouse.gov
This video catalogs the problems with Thorium, beginning with the regulatory nightmare of seemingly endless regulations that makes no sense from a research perspective, to political bias, and to protect the status quo. It is very informative.
Radioactive waste from an LFTR (Liquid Fluoride Thorium Reactor) decays down to background radiation in 300 years instead of a million years for U-235 based reactors. Initially LFTRs produce as much radioactivity as an U-235 based nuclear reactor, since fission converts mass to heat, but the decay products have a much shorter half-life. See the figure below.
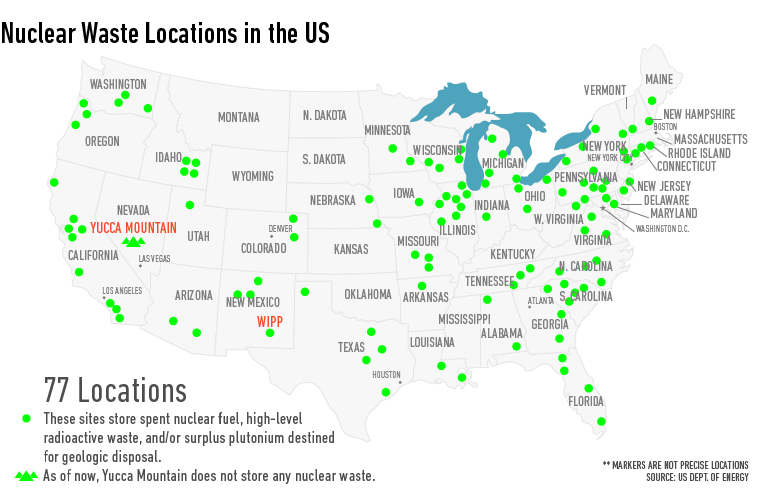
Where is the storage for spent nuclear fuel and other nuclear waste now? Look at the map, it is scary.
And these are just the U.S. installations!
Many years ago I studied Engineering at Chalmers’ University in Sweden and I thought I would become a nuclear engineer. Sweden had at that time a peaceful heavy water based nuclear power program together with Canada and India. The advantage with heavy water as moderator is that it can use natural, un-enriched Uranium. One of the end products is of course Plutonium 239, the preferred material to make nuclear bombs, but it could also use Thorium, and the end product is then mostly Plutonium 238, used in space exploration, and we were dreaming big. One of the advantages of Thorium as fuel is that it produces about 0,01% of trans-Uranium waste compared to Uranium as fuel. About that time the U.S. proposed we should abandon the heavy water program and switch to light water enriched Uranium based nuclear power. They would sell the enriched Uranium, and reprocess the spent fuel at cost. They also had the ideal final resting place for the radioactive waste products in Nevada. This was an offer the Swedish government could not refuse, at the height of the cold war. This was in the 1960’s! India on the other hand did refuse, and they eventually got the nuclear bomb. Since that meant Sweden was never going to use Thorium as nuclear fuel, and I could not figure out how to get rid of all the radioactive waste products, I switched my attention back to control engineering.
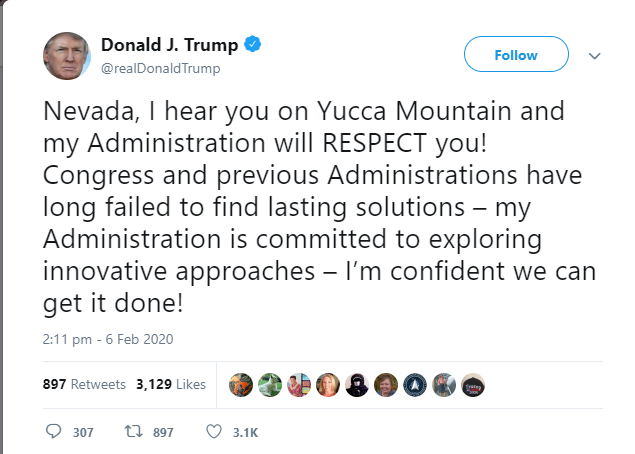
.What did President Trump mean with innovative approaches?
Is this where Thorium comes in!? Thorium solves many problems with nuclear energy. Meanwhile the Biden administration and Congress keep hoarding nuclear waste in local storages.
By far, the strongest greenhouse gas is water vapor, not because it is very strong of itself, but it absorbs nearly all outgoing energy in the infrared spectrum except in the so called atmospheric window, where it only partially absorbs. Yet water vapor is missing from the IPCC AR6 chart seen here:
IPCC has consistently treated the effect of greenhouse gasses as additive, but it is impossible to absorb more than 100% of all emitted energy for a given wavelength. This leads to an overestimation of absorption when 2 or more gasses are present. For example, if CO2 absorbs 90% of available energy at 13 μm and water vapor another 50%, the sum is 90% + (1 -0.9} * 0.5 = 95%, not 140%
This will change the relative importance of greenhouse gasses drastically so it must be tested against reality. We now have a good global satellite temperature record from 1980 to 2022 or 43 years:
During this time the temperature rise was 0.5 C, which translates to 2.375 W/m2 ERF
Water vapor.
This is a good chart to see the relative importance of all major greenhouse gasses:
It is to be noted that water vapor also absorbs the incoming solar radiation in certain wavelengths, but solar influx is assumed to be constant.
When average temperature rises 0.5 C, the possible absorption rises by 2.375 W/m2 minus the energy that escapes through the atmospheric window.Water vapor through saturation: is responsible for all of this increase except where other gasses also absorb in the atmospheric window, and in the atmospheric window the absorption must be proportionally shared, subject to the 100% absorption limitation.The atmospheric window is about 26% of all the emitted radiation so net water absorption is 0.74 * 2.375 = 1.6 W.m2 or 0.34 C. However, the relative humidity is also decreasing, see picture:
Between 1980 and 2022 the net humidity increase is 3.6% minus 0.75% relative humidity for a net increase of 3.54%. This increase only matters in the atmospheric window which is on average 25% saturated, so the total increase from water vapor increase is 0.26 * 2.375 * 0.25 * 0.9925 = 0.15 W/m2 or 0.03 C., to be added to the total before increase in humidity.This means that for a 0.5C temperature increase between 1980 and 2022 the total sensitivity to water vapor is 1.75 W/m2 or 0.37 C
Carbon dioxide
CO2 is the strongest greenhouse gas after water vapor. The only wavelength band that is meaningful is 13 to 17.4 μm and absorption occurs from both CO2 and water vapor. Since they exist together, the effect of each of them must be proportionally allocated, or the sum of them added would exceed 100%
Between 1980 and 2022 the CO2 levels rose from 335 ppm to 415 ppm or 24% increase. The temperature increase 0.5 C. The net temperature increase or ERF in the 13 to 17.4 μm band is 0.035C or +0.17 W/m2 for the water vapor and 0.04C or +0.19 W/m2 for the CO2. To see how the calculation was made, go to Appendix 1.
Methane.
Methane gas is created from a variety of sources, both man made and natural. See pie chart
The good thing about methane is that its lifetime in the atmosphere is only 10 to 15 years, and the real contribution to climate change is only 1/5th of what is commonly advertised, since iits absorption bands occur together with partly saturated absorption from water vapor. See appendix 2.
In 1980 the CH4 concentration was 1.6 ppm and will be 2.0 ppm in 2022 which results in an increase of the greenhouse effect of 0.035 C or 0.17 W/m2 ERF from rising levels of Methane since 1980.
N2O.
Atmospheric N2Olevels averaged 336 ppb (parts per billion) during 2022, about and was 301 ppb in 1980. It is a 300 times stronger greenhouse gas than CO2 by itself, because its absorption is not saturated in the atmosphere. When water vapor is dominant it is diminished by over 70% since it is at the edges of the Atmospheric window. For calculations see Appendix 3.
In 1980 the N2O concentration was 0.3 ppm which results in an increase of the greenhouse effect of 0.0065 C or 0.031 W/m2 ERF from rising levels of N2O since 1980 .
Ozone.
Ozone occurs as stratospheric O3 which is good. It protects us from uv radiation. O3 in the troposphere is considered harmful if it is over 0.08% It is normally around 0,01% in the troposphere. For calculations and figures, see appendix 4.
When the earth’s temperature rises by 0.5C, from 1980 to 2022, the amount of tropospheric O3 probably rises by 2% (Lacking good data I am guessing wildly, in urban areas it may be much more, but this is global average). This comes to 0.0034C temperature increase or 0.016 W/m2 ERF from O3, from 1980 to 2022.
CFC gasses.
CFC’s are cheap and efficient gasses to use in refrigerators and air conditioners.Their use rose rapidly until it was discovered they destroyed the protective ozone layer in the stratosphere, so its use, got banned in 1994, later diminished including its use in inhalers. CFCs has since diminished slowly and is maybe already below the levels in 1980. See also Appendix 5.
HFC gasses.
HFCs replaced CFCs and are rapidly growing in use, and the compressor seals still leak. For pictures on why they are a growing concern for the future, see Appendix 6.
The temperature increase from 1980 to 2022 was 0.0015 C or 0.007 W/m2 ERF.
Summary of all greenhouse effect causes for temperature rise from 1980 until 2022:
Effect from water vapor increase: 0.37 C or 1.75 W/m2; 80.9% of total
Effect from rising CO2: 0.04C or 0.19 W/m2; 8.78% of total
Effect from rising Methane: 0.036 C or 0.17 W/m2, 7.86% of total
Effect from rising N2O: 0.0065 C or 0.031 W/m2 1.4% of total
Effect from rising Ozone: 0.0034C or 0.016 W/m2 0.7% of total
Effect from rising HFCs : 0.0015 C or 0.007 W/m2 0.3% of total
TOTAL TEMPERATURE CHANGE 1980 to 2022: 0.4544C or 2.164 W/m2
Conclusion
CO2 amounts to less than 10% if the temperature increase since 1980, and so does Methane. The green new deal is a pipe dream that does not solve the climate problem, but will make it worse.the price of lithium carbonate used in batteries has risen sixteen-fold between 2020 and late 2022. Since then, it has dropped to one third of its peak price. China has corned the market in Lithium for now. There is not enough Lithium to be economically and ecologically justifiable to mine to meet demand in the future. Since solar and wind power are intermittent supplier of electricity they can never be used as base supplier of energy. Other solutions must be offered
Actions to be taken
What congress is doing to solve the problem.
Congress has passed the anti-inflation bill that included over 300 billion to fight climate change, and it included more solar panels and wind turbine motors to be imported from China. The experience from Europe is that electricity from solar panels and windmills is 5.7 times as expensive as conventional power generation.
This analysis was done for 2019, before COVID. The situation is worse now, with electricity rares up to 80 c/kWh, topping $1 /kWh last winter in some countries before subsides.
Even at the current increased European Gas prices, the estimated excess expenditures on Weather-Dependent “Renewables” in Europe is still very large: $0.5 trillion in capital expenditures and $1.2 trillion excess expenditures in the long-term.
These simple calculations show that any claim that Wind and Solar power are now cost competitive with conventional fossil fuel (Gas-fired) generation are patently false. The figures give an outline of the financial achievements of Green activists in stopping fracking for gas in Europe, close on to $1.2 trillion of excess costs.
It would be better not to import any solar panels and wind power generators from China and let them pay for the extra cost rather than building more coal burning plants. After all they were planning to build over a thousand new plants between now and 2030, all legal under the Paris accord. This would benefit the world climate much more, since Chinese coal plants are far more polluting, since China has far less stringent environmental regulations than U.S.
U.S. uses 13.5% of the world’s coal, and eliminating U.S. CO2 emissions would in time reduce the world temperature by 0.023C, providing no other country, such as China and India would increase their use of Coal, which they are, to the total of 1300 new coal plants between now and 2030. This would raise global temperature by more than 0.06 C.
What congress should do instead.
a. What congress should do immediately.
Immediately stop downblending U 233 and pass The Thorium Energy security act SB 4242a. See more here.
2. Remove Thorium from the list of nuclear source material. The half-life of Thorium232 is 14 billion years, so its radioactivity is barely above background noise. More importantly, while Thorium is fertile, it is not fissile and should therefore not be included in the list. This would make it far easier to mine rare earth metals, as long as the ore consists of less than 0.05% Uranium, but any amount of Thorium is allowed without classifying the ore “Source material”.
3. Separate nuclear power into 3 categories. a. conventional nuclear power. b. Thorium breeder reactors that make more U233 than it consumes, and c. Thorium reactors that reduce nuclear waste.
4. Stop buying solar panels from China. Stop buying wind turbine generators from China. Let them install those in China and pay 5 times as much for their electricity.
5. Immediately form a commission led by competent people, not politicians; to decide how to best expand the electric grid and to best harden it against electro-magnetic pulses, whether solar or nuclear and to safeguard it against sabotage.
6. Remove all subsidies on electric cars, solar panels and wind generators, but continue to encourage energy conservation.
7. Encourage research and development of Thorium fueled reactors, especially liquid salt reactors by drastically simplifying and speeding up the approval process. President Trump issued an executive order in the last month of his presidency EO 13972 specifying that the United States must sustain its ability to meet the energy requirements for its national defense and space exploration initiatives. The ability to use small modular reactors will help maintain and advance United States dominance and strategic leadership across the space and terrestrial domains. This EO should be expanded to include civilian small modular reactors, including Liquid salt Thorium reactors less than 200 MW, which are the only valid reactors for space exploration.
Appendix 1, CO2
The following chart shows both CO2 and H2O are absorbing greenhouse gases, with H20 being the stronger greenhouse gas, absorbing over a much wider spectrum, and they overlap for the most part. But it also matters in what frequency ranges they absorb.
For this we will have to look at the frequency ranges of the incoming solar radiation and the outgoing black body radiation of the earth. It is the latter that causes the greenhouse effect. Take a look at this chart:
The red area represents the observed amount of solar radiation that reaches the earth’s surface. the white area under the red line represents radiation absorbed in the atmosphere. Likewise, the blue area represents the outgoing black body radiation that is not absorbed. The remaining white area under the magenta, blue or black line represents the retained absorbed energy that causes the greenhouse effect.
Let us now take a look at the Carbon Dioxide bands of absorption, at 2.7, 4.3 and 15 μm. Of them the 2.7 and 4.3 μm bands absorb where there is little black body radiation, the only band that counts is at 14.9 μm, and that is in a band where the black body radiation is near its maximum. Let us first consider the CO2 alone in a dry atmosphere, that is one with no water vapor at all. We will investigate the concentration of 335 ppm (in 1980) and 415 ppm (in 2022)
The very top line of the top black band represents total absorption at 415 ppm, the bottom of the black black band represents absorption at 335 ppm. Divide the frequency spectrum in 3 parts, below 14 μm, 14-16 μm, and above 16 μm, In the 13 to 14 μm band 66% of available energy is absorbed at 335 ppm, 70% at 415 ppm. in the 14 to 16 μm band 100% of available energy is absorbed at both 335 and 415 ppm. In the > 16 μm the numbers are also 66 and 70%. In addition, temperature is 0.5 C higher at 415 than at 335 ppm, so available energy is 0.7 % higher at 415 ppm.
The net result is greenhouse gas contribution for CO2 is 5.10 C at 335 ppm and 5.26 C at 415 ppm and 1.5C higher ambient temperature for a dry atmosphere.
The normal way to account for greenhouse gasses contribution is to simply add together the CO2 contribution and the contribution from water vapor. This leads to the wrong result for in doing so, the total result is more than 100% for some energy band, because it is impossible to add more than 100% of all available energy for a given wavelength. Again, the spectrum of interest is 13 to 17.4 μm.
The first thing to notice is that no absorption exceeds 100% , so at 14.9 μm wavelength CO2 absorbed 100%, and water vapor absorbed another 75%, the total sum is still 100%. It is impossible to absorb more than 100% of the total energy available for that wavelength. Therefore between the wavelengths 14 and 16 μm all energy was absorbed regardless of CO2 concentration and water vapor concentration. The only fair way to allocate the absorption is proportionally, 57% to CO2 and 43% to water vapor. Likewise, the 13 to 14 μm band is not fully saturated, so the total absorption is 62% of available energy for CO2 and 33% for water vapor. In the 16 to 17.4 μm range the total absorption is 44% for CO2 and 55 % for water vapor. For CO2 at 335 ppm and average temp 13.5 C the total temperature rise, when proportionally allocated comes to 2.73 C for the CO2 and 2.30 C for the water vapor. For CO2 at 415 ppm and an average temp 0.5 C higher, at 14 C average the net temperature increase or ERF in the 13 to 17.4 μm band is 0.035C or +0.17 W/m2 for the water vapor and 0.04C or +0.19 W/m2 for the CO2.
Appendix 2, Methane
Atmospheric methanelevels averaged 2.0 ppm (parts per million) during 2022, or around 25% greater than in 1980. It is a 28 times stronger greenhouse gas by itself unlike CO2, because its absorption is not saturated in the atmosphere. On the other hand the lifetime of Methane in the atmosphere is 10 to 15 years, some of the Methane eating bacteria will do its job. There is only one significant absorption band that absorbs in the atmospheric window at 7.7 μm, at the edge of the atmospheric window.
The picture shows a small peak at 7.7μm. This is because at lower wavelengths absorption from water vapor has nearly eliminated the CH4 contribution. Remember that total absorption can never exceed 100 %, so the maximum absorption from CH4 occurs at 7.7μm. At 1.6 ppm it amounts to a greenhouse effect of 0.68 C for a dry gas.
The only major absorption line at 7.7 μm has two side lobes, at 7.5 and 7.9 μm. In the 7.5 μm sideband water vapor already absorbs nearly all energy, so the NH4 is of little effect. In the 7.9 μm sideband water vapor is 50% saturated at that level and the NH4 net absorption is 20% the net greenhouse effect is one fifth of the effect for a dry gas, or 0.14 C. In 1980 the CH4 concentration was 1.6 ppm and will be 2.0 ppm in 2022 which results in an increase of the greenhouse effect of 0.035 C or 0.17 W/m2 ERF from rising levels of Methane since 1980
Appendix 3, N2O.
Atmospheric N2Olevels averaged 336 ppb (parts per billion) during 2022, about and was 301 ppb in 1980. It is a 300 times stronger greenhouse gas than CO2 by itself, because its absorption is not saturated in the atmosphere. When water vapor is dominant it is diminished by over 70% since it is at the edges of the Atmospheric window. On the other hand the lifetime of N20 in the atmosphere is short and is typically greatest at 5 p.m. One of the major reasons for the N2O increase is the increase of fertilization with nitrates, the other is from diesel fumes from trains, boats, ships, trucks and mining equipment
The picture shows a double N2O peak at 7.4 and 7.8 μm. . At 0.336 ppm in 2022it amounts to a greenhouse effect of 0.325 C for a dry gas. In the 7.4 μm band water vapor is saturated, in the 7.8 μm band 80% is saturated by water vapor.In 1980 the N2O concentration was 0.3 ppm which results in an increase of the greenhouse effect of 0.0065 C or 0.031 W/m2 ERF from rising levels of N2O since 1980 .
N2O is commonly called laughing gas, and is hazardous in high concentrations, and should be limited in confined places, but in concentrations of under 1 ppm nobody laughs because of that.
Appendix 4, Ozone.
Ozone or 03 is good if it is in the stratosphere. There it helps to absorb the ultraviolet and cosmic rays from the sun and other cosmic radiation. Ozone is bad if it is near the ground. The total proportion of O3 in the troposphere is about 0.01 ppm, yet it is a substantial greenhouse gas because it forms by uv radiation in the stratosphere and mesosphere, and thus protecting us from uv damage. See figure:
The O3 in the troposphere on the other hand is bad. It is normally around 0.01 ppm, but is considered damaging if people are exposed to more than 0.08 ppm in an 8 hour period. This can happen in urban environments in warm and stagnant weather, typically through car traffic. It is a great greenhouse gas because its main absorption band is at 9.5 μm, right in the atmospheric window where the outgoing black body radiation is the greatest. See fig:
The dotted blue line at 9.5 μm represents the tropospheric absorption, the total absorption is between the brown and the solid blue line. The total greenhouse effect from O3 is 0.88C, but the stratosphere does not interact very much with the troposphere, so the stratospheric O3 does not count as a greenhouse gas, only tropospheric O3. The total contribution to the greenhouse effect from tropospheric O3 is about 1/5 of the total, because atmospheric O2 absorbs in the same band limits the temperature rise to 0.17C When the earth’s temperature rises by 0.5C, from 1980 to 2022, the amount of tropospheric O3 probably rises by 2% (Lacking good data I am guessing wildly, in urban areas it may be much more, but this is global average). This comes to 0.0035C temperature increase or 0.016 W/m2 ERF from O3, from 1980 to 2022.
Appendix 5, CFC gasses.
ChloroFluoroCarbon (CFC) gasses started to be manufactured at the beginning of the refrigeration age, replacing ice as the refrigerant. It soon appeared in the atmosphere, mostly due to leaks in the air conditioner compressor seals. It didn’t amount to much as a greenhouse gas even though it was five thousand times more efficient than CO2 as a greenhouse gas. It was discovered that CFCs ate up the Ozone in the stratosphere, and if it continued to increase it could deplete the protective Ozone layer faster than it could be produced. In fact it created an Ozone hole over Antarctica. So it got forbidden Jan 17, 1994, In 2020 even China stopped production. Since 1994 CFC are decreasing by about 1% per year, but cheating persisted, especially among poorer nations and China. By 2022 it will probably have a greenhouse effect of 0.01C or 0,05 W/m2 ERF.
Appendix 6, HFC gases.
CFC started to be phased out and replaced by HydroFluoroCarbons (HFC), less efficient and more expensive, but at least they do not deplete the Ozone layer that protects us from cancer. Some of the HFCs are even bigger greenhouse effect generators than CFC, but well worth it to protect the Ozone layer. Their biggest absorption bands are in the middle of the atmospheric window.
If nothing is done to control them they will increase from nothing in 1980 until 2022 and beyond. See fig: NOAA Research News
The temperature increase from 1980 to 2022 was 0.0014 C or 0.007 W/m2 ERF..