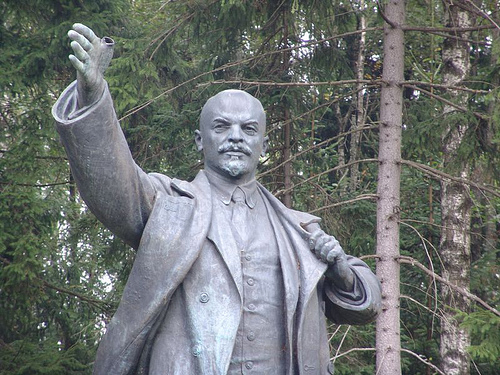
The very first Earth Day was celebrated April 22 1970, on the 100 year anniversary of the birth of Vladimir Lenin (Владимир Ильич Ленин). True green environmentalists keep telling me it is just a coincidence. I think not..
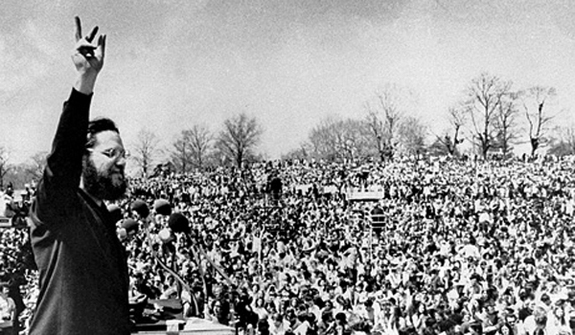
The first Earth Day in Philadelphia 1970 featured Ira Einhorn (The Unicorn Killer) as master of Ceremonies. For those too young to remember, he murdered his girlfriend , stuffed her in a piece of luggage in his apartment and kept her there for seven years, and no one smelled a dead rat). He was finally convicted many years later. The big environmental scare of that day was the threat of a new Ice Age. The clarion call was: “In the year 2000 temperatures will have fallen 10 degrees”, the culprit was pollution, especially acid rain.
Things have changed, and we have experienced decades of climate change, or so they say, but it depends very much on where you live. Most of the increased temperature since 1970 is due to cleaner air in the industrialized nations, there are now more thunderstorms as opposed to daylong rains. This leads to fewer clouds and less reflection of incoming light back into space. This means warmer days.
What forms clouds is saturated humidity with a sufficient aerosol to form condensing spots. The best solution is to plant trees that provide enough aerosols to form clouds. This is especially important in the American Southwest and the whole 10-40 degrees latitude region where the majority of the world’s population lives.
USA can be seen as two very different regions: In the West the fight is about water rights; in the East it is about water responsibilities.
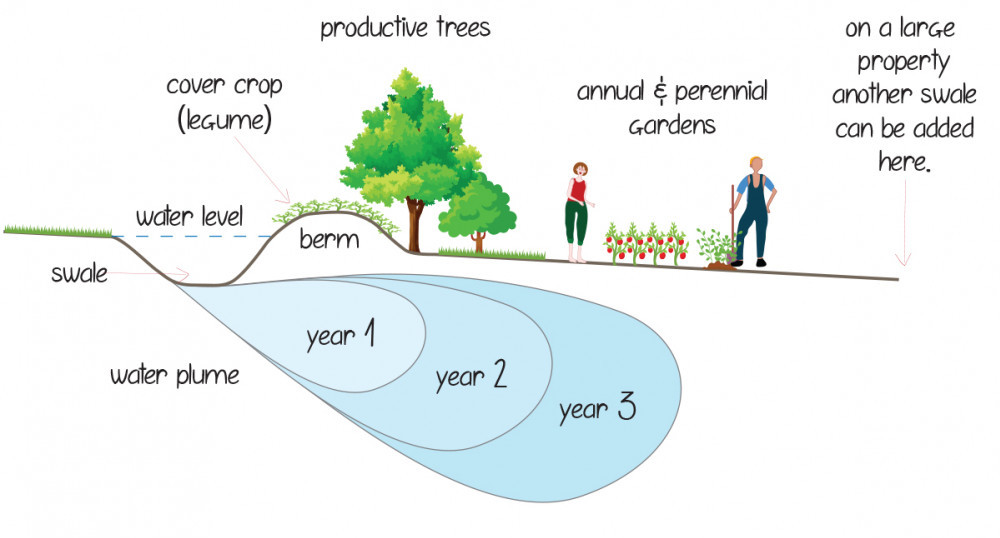
My proposal is that we reshape the water rights laws so that water rights belong to the land. Where it rains, as much as possible of the rain should remain on that land without building dams. By building swales and planting trees at high elevations the erosion from flash floods will diminish, and more water will remain in the ground, causing rivers to flow year round rather than seasonal. As it is now a house owner in Arizona cannot even water his plants from what falls on his roof or driveway.
In the East the opposite is true. When you build a house with a driveway you must also provide a catch basin capable of absorbing all the rain that falls on the improved property, sufficient to absorb a substantial rainstorm.
As it is now, the aquifers is the west are being drained, and need to be restored. Yes, without restoring the aquifers the American Southwest will experience desertification.
The Holy Bible is the most influential book ever written. According to Wikipedia it has been translated in its entirety into 724 languages, and the New Testament has been translated into 1617 languages. At least one part of the Bible has bee translated into 3,589 languages, and more translations are coming every year, especially from the Wycliffe translators.
Both the New Testament and the Old Testament begin with the words “In the beginning”.
Genesis 1 deals with the physical creation with spiritual emphasis, laying the groundwork for spiritual understanding of how and why we exist.
We are existing in time and space. The question is: What was there before time and space existed, before the beginning?
Answer: God, existing in three persons, God the Father, God the Son (the Word) and God’s Spirit, (the Holy Ghost).
The Three-in-one God alone are eternal, everything else, including time and space, is created.
Another Question: Why did God say “it was good” for day 1,3,4 and 5 but not for day 2 and it was very good after day 6?
Answer: The ecosystem is a work in progress and will function differently for each phase and finally come to completion when all parts are set in place, which includes people. We are responsible to God to be good stewards of the earth and leave it a better place than we found it. The main regulator of temperature on earth is the clouds. They cool by day and warm by night. The time of day they appear is also very important, and there is no risk for the earth to overheat.
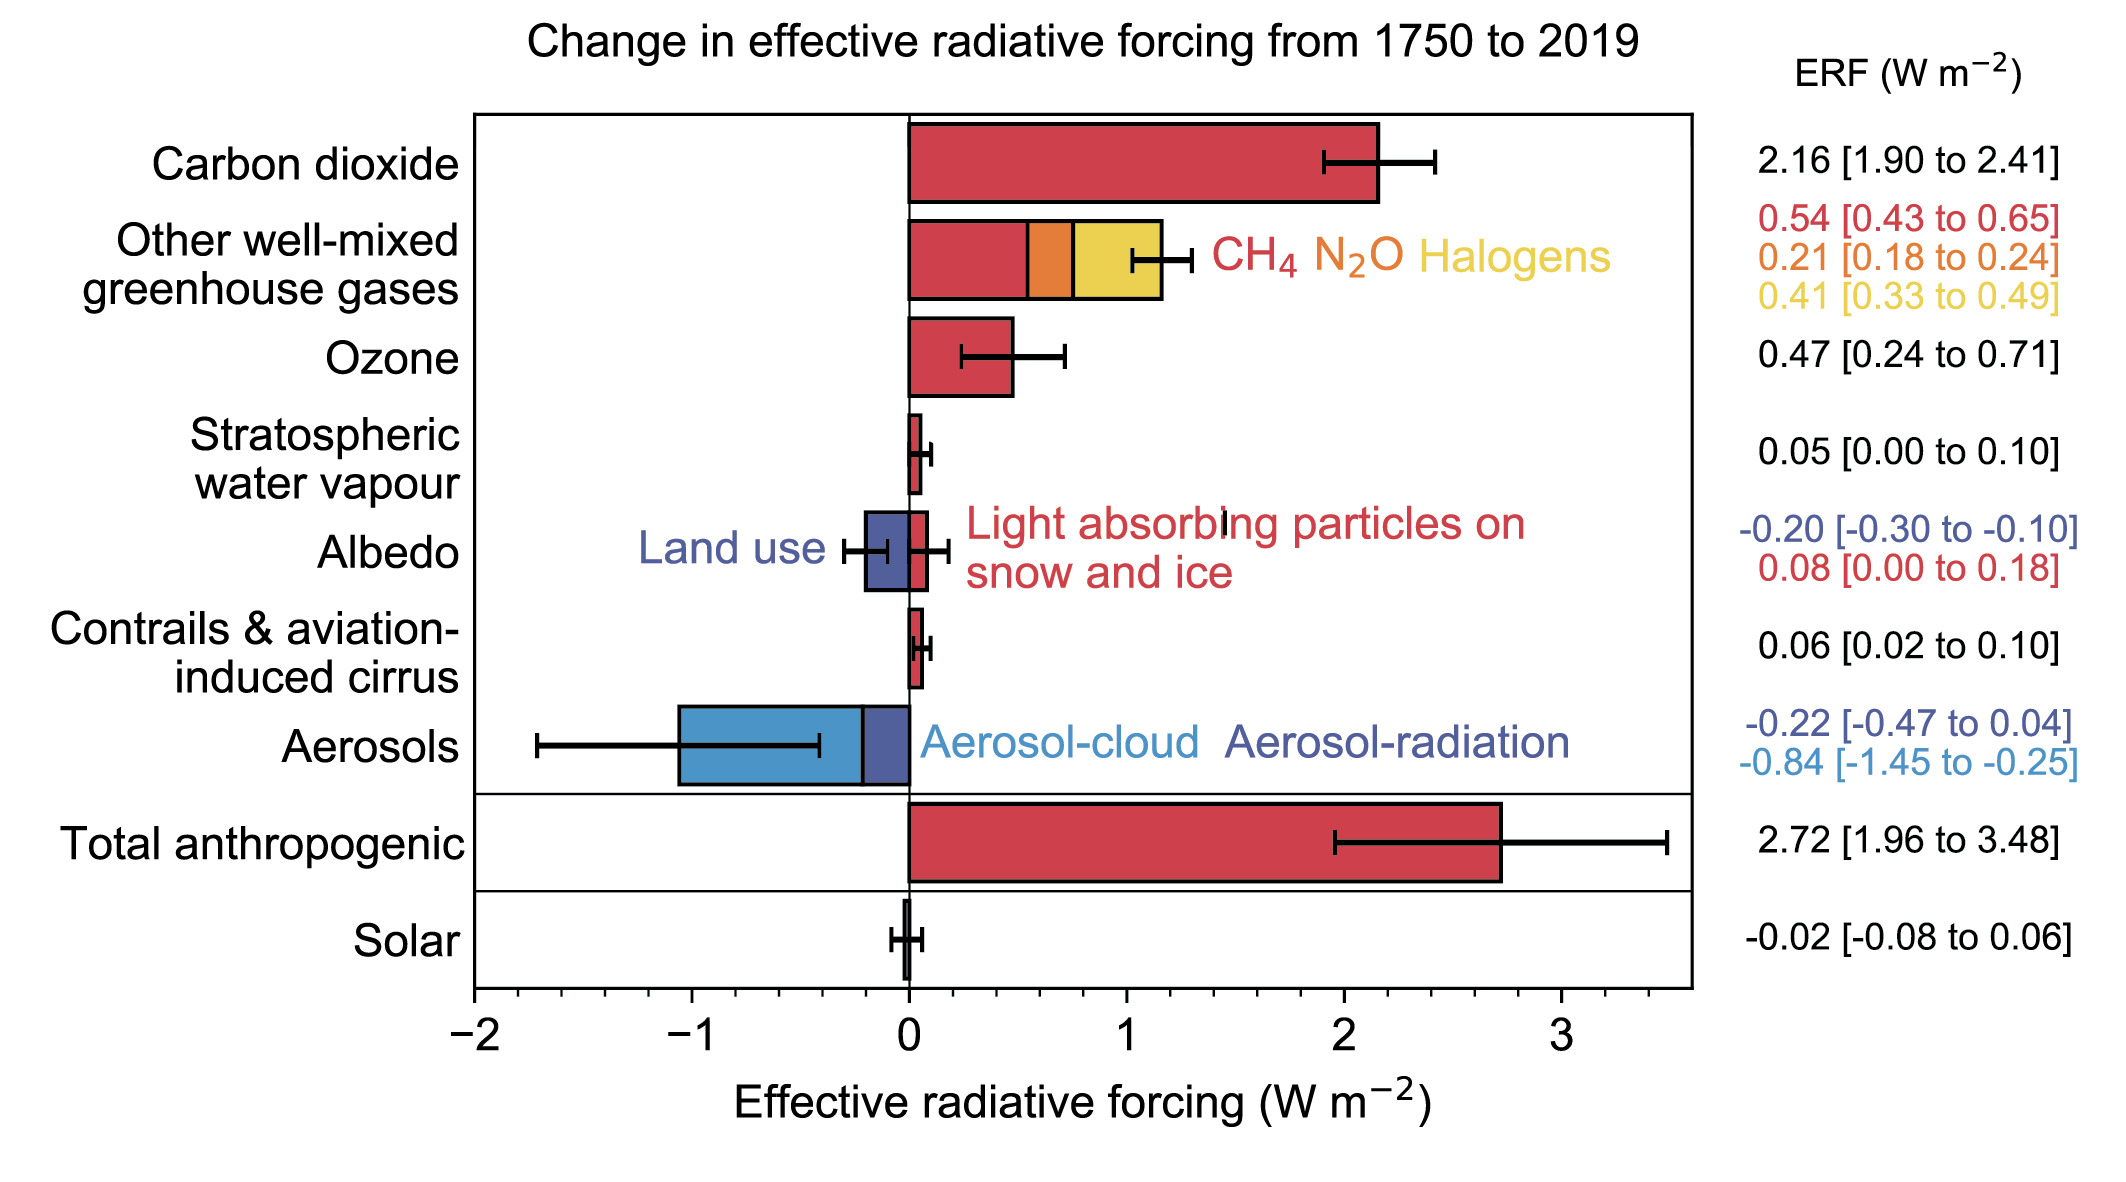
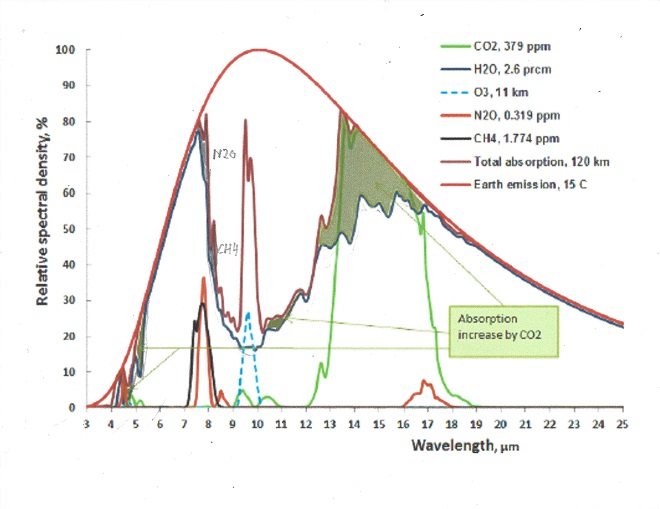
By far, the strongest greenhouse gas is water vapor, not because it is very strong of itself, but it absorbs nearly all outgoing energy in the infrared spectrum except in the so called atmospheric window, where it only partially absorbs. Yet water vapor is missing from the IPCC AR6 chart seen here:
IPCC has consistently treated the effect of greenhouse gasses as additive, but it is impossible to absorb more than 100% of all emitted energy for a given wavelength. This leads to an overestimation of absorption when 2 or more gasses are present. For example, if CO2 absorbs 90% of available energy at 13 μm and water vapor another 50%, the sum is 90% + (1 -0.9} * 0.5 = 95%, not 140%
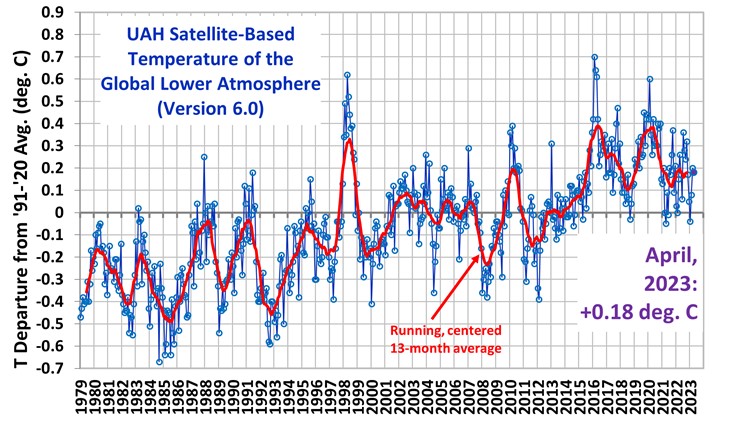
This will change the relative importance of greenhouse gasses drastically so it must be tested against reality. We now have a good global satellite temperature record from 1980 to 2022 or 43 years:
During this time the temperature rise was 0.5 C, which translates to 2.375 W/m2 ERF
Water vapor.
This is a good chart to see the relative importance of all major greenhouse gasses:
It is to be noted that water vapor also absorbs the incoming solar radiation in certain wavelengths, but solar influx is assumed to be constant.
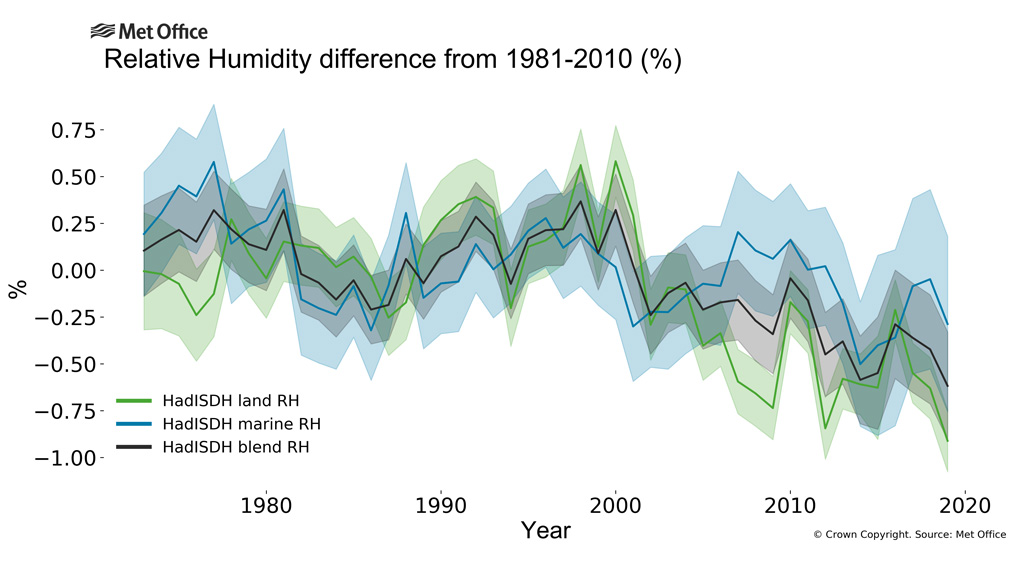
When average temperature rises 0.5 C, the possible absorption rises by 2.375 W/m2 minus the energy that escapes through the atmospheric window.Water vapor through saturation: is responsible for all of this increase except where other gasses also absorb in the atmospheric window, and in the atmospheric window the absorption must be proportionally shared, subject to the 100% absorption limitation.The atmospheric window is about 26% of all the emitted radiation so net water absorption is 0.74 * 2.375 = 1.6 W.m2 or 0.34 C. However, the relative humidity is also decreasing, see picture:
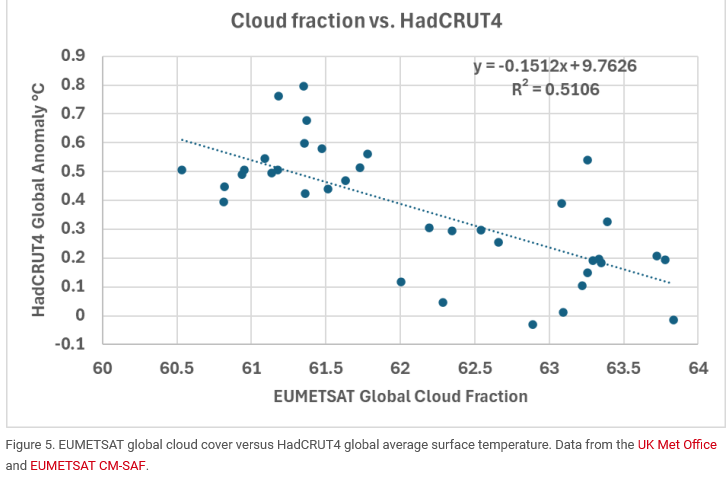
Between 1980 and 2022 the net humidity increase is 3.6% minus 0.75% relative humidity for a net increase of 3.54%. This increase only matters in the atmospheric window which is on average 25% saturated, so the total increase from water vapor increase is 0.26 * 2.375 * 0.25 * 0.9925 = 0.15 W/m2 or 0.03 C., to be added to the total before increase in humidity.This means that for a 0.5C temperature increase between 1980 and 2022 the total sensitivity to water vapor is 1.75 W/m2 or 0.37 C. A confirming picture of the total cloud cover shows the , but temperature sensitivity to the decline in cloud cover between 1980 and 2015
This is of course a very crude method, since it incorporates all temperature rises from all sources, which is 0,5C degrees, from which should be deducted the 0.08C rise from all. This is of course a very cruse assessment of the influence of clouds vary greatly between low clouds, middle clouds and high clouds; as well as when they occur, day or night, and even what time of day they appear. Because of this complexity IPCC has consistently failed to give clouds their full respect. The clouds are the main regulator of temperature on earth!
Carbon dioxide
CO2 is the strongest greenhouse gas after water vapor. The only wavelength band that is meaningful is 13 to 17.4 μm and absorption occurs from both CO2 and water vapor. Since they exist together, the effect of each of them must be proportionally allocated, or the sum of them added would exceed 100%
Between 1980 and 2022 the CO2 levels rose from 335 ppm to 415 ppm or 24% increase. The temperature increase 0.5 C. The net temperature increase or ERF in the 13 to 17.4 μm band is 0.035C or +0.17 W/m2 for the water vapor and 0.04C or +0.19 W/m2 for the CO2. To see how the calculation was made, go to Appendix 1.
Methane.
Methane gas is created from a variety of sources, both man made and natural. See pie chart
The good thing about methane is that its lifetime in the atmosphere is only 10 to 15 years, and the real contribution to climate change is only 1/5th of what is commonly advertised, since iits absorption bands occur together with partly saturated absorption from water vapor. See appendix 2.
In 1980 the CH4 concentration was 1.6 ppm and will be 2.0 ppm in 2022 which results in an increase of the greenhouse effect of 0.035 C or 0.17 W/m2 ERF from rising levels of Methane since 1980.
N2O.
Atmospheric N2Olevels averaged 336 ppb (parts per billion) during 2022, about and was 301 ppb in 1980. It is a 300 times stronger greenhouse gas than CO2 by itself, because its absorption is not saturated in the atmosphere. When water vapor is dominant it is diminished by over 70% since it is at the edges of the Atmospheric window. For calculations see Appendix 3.
In 1980 the N2O concentration was 0.3 ppm which results in an increase of the greenhouse effect of 0.0065 C or 0.031 W/m2 ERF from rising levels of N2O since 1980 .
Ozone.
Ozone occurs as stratospheric O3 which is good. It protects us from uv radiation. O3 in the troposphere is considered harmful if it is over 0.08% It is normally around 0,01% in the troposphere. For calculations and figures, see appendix 4.
When the earth’s temperature rises by 0.5C, from 1980 to 2022, the amount of tropospheric O3 probably rises by 2% (Lacking good data I am guessing wildly, in urban areas it may be much more, but this is global average). This comes to 0.0034C temperature increase or 0.016 W/m2 ERF from O3, from 1980 to 2022.
CFC gasses.
CFC’s are cheap and efficient gasses to use in refrigerators and air conditioners.Their use rose rapidly until it was discovered they destroyed the protective ozone layer in the stratosphere, so its use, got banned in 1994, later diminished including its use in inhalers. CFCs has since diminished slowly and is maybe already below the levels in 1980. See also Appendix 5.
HFC gasses.
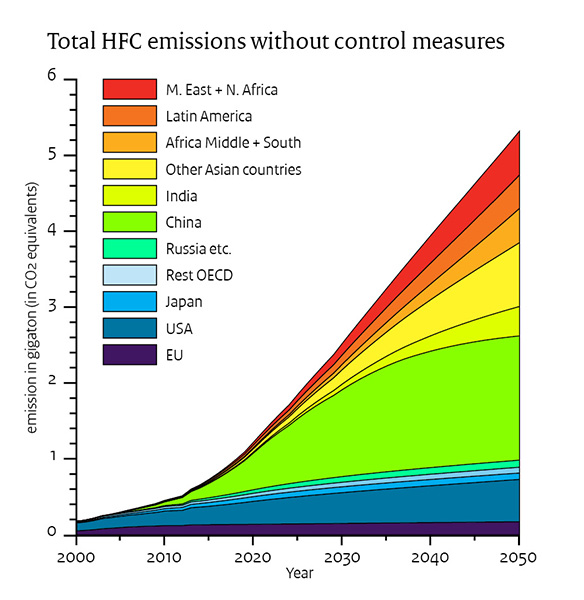
HFCs replaced CFCs and are rapidly growing in use, and the compressor seals still leak. For pictures on why they are a growing concern for the future, see Appendix 6.
The temperature increase from 1980 to 2022 was 0.0015 C or 0.007 W/m2 ERF.
Summary of all greenhouse effect causes for temperature rise from 1980 until 2022:
Effect from water vapor increase: 0.37 C or 1.75 W/m2; 80.9% of total
Effect from rising CO2: 0.04C or 0.19 W/m2; 8.78% of total
Effect from rising Methane: 0.036 C or 0.17 W/m2, 7.86% of total
Effect from rising N2O: 0.0065 C or 0.031 W/m2 1.4% of total
Effect from rising Ozone: 0.0034C or 0.016 W/m2 0.7% of total
Effect from rising HFCs : 0.0015 C or 0.007 W/m2 0.3% of total
TOTAL TEMPERATURE CHANGE 1980 to 2022: 0.4544C or 2.164 W/m2
Conclusion
CO2 amounts to less than 10% if the temperature increase since 1980, and so does Methane. The green new deal is a pipe dream that does not solve the climate problem, but will make it worse.the price of lithium carbonate used in batteries has risen sixteen-fold between 2020 and late 2022. Since then, it has dropped to one third of its peak price. China has corned the market in Lithium for now. There is not enough Lithium to be economically and ecologically justifiable to mine to meet demand in the future. Since solar and wind power are intermittent supplier of electricity they can never be used as base supplier of energy. Other solutions must be offered
Actions to be taken
What congress is doing to solve the problem.
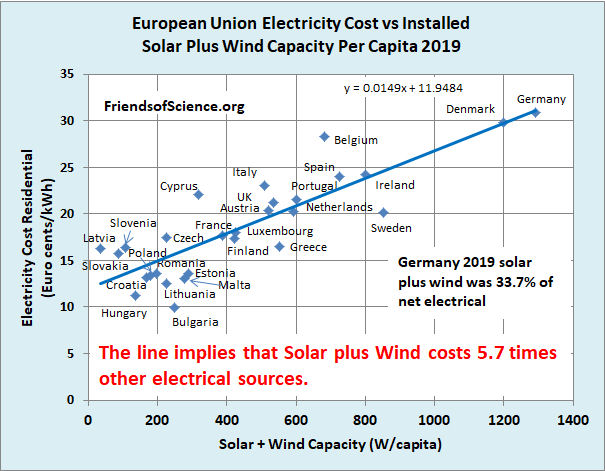
Congress has passed the anti-inflation bill that included over 300 billion to fight climate change, and it included more solar panels and wind turbine motors to be imported from China. The experience from Europe is that electricity from solar panels and windmills is 5.7 times as expensive as conventional power generation.
This analysis was done for 2019, before COVID. The situation is worse now, with electricity rares up to 80 c/kWh, topping $1 /kWh last winter in some countries before subsides.
Even at the current increased European Gas prices, the estimated excess expenditures on Weather-Dependent “Renewables” in Europe is still very large: $0.5 trillion in capital expenditures and $1.2 trillion excess expenditures in the long-term.
These simple calculations show that any claim that Wind and Solar power are now cost competitive with conventional fossil fuel (Gas-fired) generation are patently false. The figures give an outline of the financial achievements of Green activists in stopping fracking for gas in Europe, close on to $1.2 trillion of excess costs.
It would be better not to import any solar panels and wind power generators from China and let them pay for the extra cost rather than building more coal burning plants. After all they were planning to build over a thousand new plants between now and 2030, all legal under the Paris accord. This would benefit the world climate much more, since Chinese coal plants are far more polluting, since China has far less stringent environmental regulations than U.S.
U.S. uses 13.5% of the world’s coal, and eliminating U.S. CO2 emissions would in time reduce the world temperature by 0.023C, providing no other country, such as China and India would increase their use of Coal, which they are, to the total of 1300 new coal plants between now and 2030. This would raise global temperature by more than 0.06 C.
What congress should do instead.
a. What congress should do immediately.
Immediately stop downblending U 233 and pass The Thorium Energy security act SB 4242a. See more here.
2. Remove Thorium from the list of nuclear source material. The half-life of Thorium232 is 14 billion years, so its radioactivity is barely above background noise. More importantly, while Thorium is fertile, it is not fissile and should therefore not be included in the list. This would make it far easier to mine rare earth metals, as long as the ore consists of less than 0.05% Uranium, but any amount of Thorium is allowed without classifying the ore “Source material”.
3. Separate nuclear power into 3 categories. a. conventional nuclear power. b. Thorium breeder reactors that make more U233 than it consumes.c. Thorium reactors that reduce nuclear waste, and d. Plutonium and other trans uranium depletion reactors.
4. Stop buying solar panels from China. Stop buying wind turbine generators from China. Let them install those in China and pay 5 times as much for their electricity.
5. Immediately form a commission led by competent people, not politicians; to decide how to best expand the electric grid and to best harden it against electro-magnetic pulses, whether solar or nuclear and to safeguard it against sabotage.
6. Remove all subsidies on electric cars, solar panels and wind generators, but continue to encourage energy conservation.
7. Encourage research and development of Thorium fueled reactors, especially liquid salt reactors by drastically simplifying and speeding up the approval process. President Trump issued an executive order in the last month of his presidency EO 13972 specifying that the United States must sustain its ability to meet the energy requirements for its national defense and space exploration initiatives. The ability to use small modular reactors will help maintain and advance United States dominance and strategic leadership across the space and terrestrial domains. This EO should be expanded to include civilian small modular reactors, including Liquid salt Thorium reactors less than 200 MW, which are the only valid reactors for space exploration.
Appendix 1, CO2
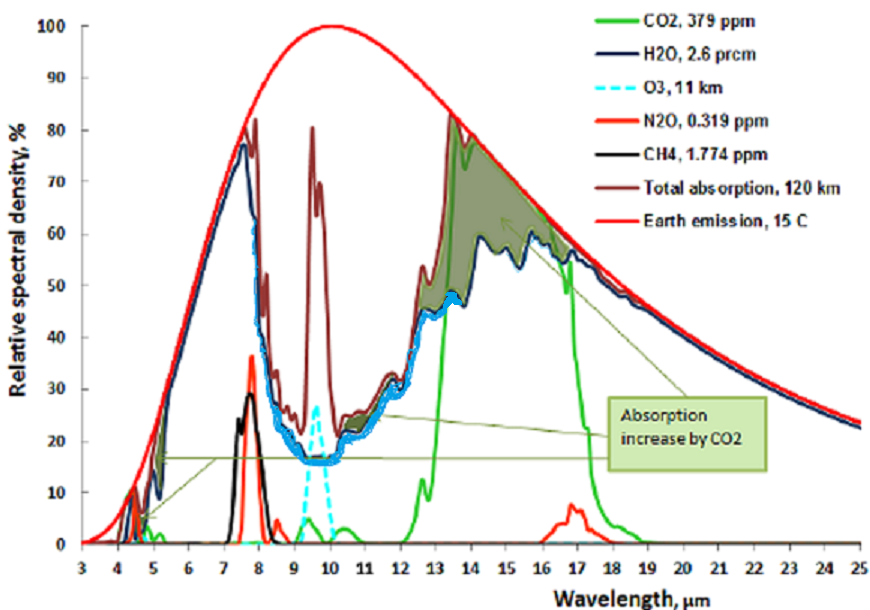
The following chart shows both CO2 and H2O are absorbing greenhouse gases, with H20 being the stronger greenhouse gas, absorbing over a much wider spectrum, and they overlap for the most part. But it also matters in what frequency ranges they absorb.
For this we will have to look at the frequency ranges of the incoming solar radiation and the outgoing black body radiation of the earth. It is the latter that causes the greenhouse effect. Take a look at this chart:
The red area represents the observed amount of solar radiation that reaches the earth’s surface. the white area under the red line represents radiation absorbed in the atmosphere. Likewise, the blue area represents the outgoing black body radiation that is not absorbed. The remaining white area under the magenta, blue or black line represents the retained absorbed energy that causes the greenhouse effect.
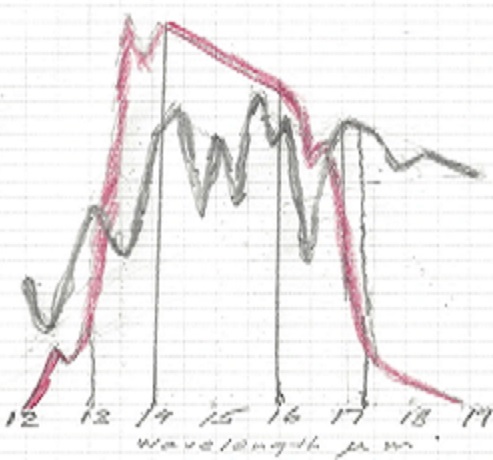
Let us now take a look at the Carbon Dioxide bands of absorption, at 2.7, 4.3 and 15 μm. Of them the 2.7 and 4.3 μm bands absorb where there is little black body radiation, the only band that counts is at 14.9 μm, and that is in a band where the black body radiation is near its maximum. Let us first consider the CO2 alone in a dry atmosphere, that is one with no water vapor at all. We will investigate the concentration of 335 ppm (in 1980) and 415 ppm (in 2022)
The very top line of the top black band represents total absorption at 415 ppm, the bottom of the black black band represents absorption at 335 ppm. Divide the frequency spectrum in 3 parts, below 14 μm, 14-16 μm, and above 16 μm, In the 13 to 14 μm band 66% of available energy is absorbed at 335 ppm, 70% at 415 ppm. in the 14 to 16 μm band 100% of available energy is absorbed at both 335 and 415 ppm. In the > 16 μm the numbers are also 66 and 70%. In addition, temperature is 0.5 C higher at 415 than at 335 ppm, so available energy is 0.7 % higher at 415 ppm.
The net result is greenhouse gas contribution for CO2 is 5.10 C at 335 ppm and 5.26 C at 415 ppm and 1.5C higher ambient temperature for a dry atmosphere.
The normal way to account for greenhouse gasses contribution is to simply add together the CO2 contribution and the contribution from water vapor. This leads to the wrong result for in doing so, the total result is more than 100% for some energy band, because it is impossible to add more than 100% of all available energy for a given wavelength. Again, the spectrum of interest is 13 to 17.4 μm.
The first thing to notice is that no absorption exceeds 100% , so at 14.9 μm wavelength CO2 absorbed 100%, and water vapor absorbed another 75%, the total sum is still 100%. It is impossible to absorb more than 100% of the total energy available for that wavelength. Therefore between the wavelengths 14 and 16 μm all energy was absorbed regardless of CO2 concentration and water vapor concentration. The only fair way to allocate the absorption is proportionally, 57% to CO2 and 43% to water vapor. Likewise, the 13 to 14 μm band is not fully saturated, so the total absorption is 62% of available energy for CO2 and 33% for water vapor. In the 16 to 17.4 μm range the total absorption is 44% for CO2 and 55 % for water vapor. For CO2 at 335 ppm and average temp 13.5 C the total temperature rise, when proportionally allocated comes to 2.73 C for the CO2 and 2.30 C for the water vapor. For CO2 at 415 ppm and an average temp 0.5 C higher, at 14 C average the net temperature increase or ERF in the 13 to 17.4 μm band is 0.035C or +0.17 W/m2 for the water vapor and 0.04C or +0.19 W/m2 for the CO2.
Appendix 2, Methane
Atmospheric methanelevels averaged 2.0 ppm (parts per million) during 2022, or around 25% greater than in 1980. It is a 28 times stronger greenhouse gas by itself unlike CO2, because its absorption is not saturated in the atmosphere. On the other hand the lifetime of Methane in the atmosphere is 10 to 15 years, some of the Methane eating bacteria will do its job. There is only one significant absorption band that absorbs in the atmospheric window at 7.7 μm, at the edge of the atmospheric window.
The picture shows a small peak at 7.7μm. This is because at lower wavelengths absorption from water vapor has nearly eliminated the CH4 contribution. Remember that total absorption can never exceed 100 %, so the maximum absorption from CH4 occurs at 7.7μm. At 1.6 ppm it amounts to a greenhouse effect of 0.68 C for a dry gas.
The only major absorption line at 7.7 μm has two side lobes, at 7.5 and 7.9 μm. In the 7.5 μm sideband water vapor already absorbs nearly all energy, so the NH4 is of little effect. In the 7.9 μm sideband water vapor is 50% saturated at that level and the NH4 net absorption is 20% the net greenhouse effect is one fifth of the effect for a dry gas, or 0.14 C. In 1980 the CH4 concentration was 1.6 ppm and will be 2.0 ppm in 2022 which results in an increase of the greenhouse effect of 0.035 C or 0.17 W/m2 ERF from rising levels of Methane since 1980
Appendix 3, N2O.
Atmospheric N2Olevels averaged 336 ppb (parts per billion) during 2022, about and was 301 ppb in 1980. It is a 300 times stronger greenhouse gas than CO2 by itself, because its absorption is not saturated in the atmosphere. When water vapor is dominant it is diminished by over 70% since it is at the edges of the Atmospheric window. On the other hand the lifetime of N20 in the atmosphere is short and is typically greatest at 5 p.m. One of the major reasons for the N2O increase is the increase of fertilization with nitrates, the other is from diesel fumes from trains, boats, ships, trucks and mining equipment
The picture shows a double N2O peak at 7.4 and 7.8 μm. . At 0.336 ppm in 2022it amounts to a greenhouse effect of 0.325 C for a dry gas. In the 7.4 μm band water vapor is saturated, in the 7.8 μm band 80% is saturated by water vapor.In 1980 the N2O concentration was 0.3 ppm which results in an increase of the greenhouse effect of 0.0065 C or 0.031 W/m2 ERF from rising levels of N2O since 1980 .
N2O is commonly called laughing gas, and is hazardous in high concentrations, and should be limited in confined places, but in concentrations of under 1 ppm nobody laughs because of that.
Appendix 4, Ozone.
Ozone or 03 is good if it is in the stratosphere. There it helps to absorb the ultraviolet and cosmic rays from the sun and other cosmic radiation. Ozone is bad if it is near the ground. The total proportion of O3 in the troposphere is about 0.01 ppm, yet it is a substantial greenhouse gas because it forms by uv radiation in the stratosphere and mesosphere, and thus protecting us from uv damage. See figure:
The O3 in the troposphere on the other hand is bad. It is normally around 0.01 ppm, but is considered damaging if people are exposed to more than 0.08 ppm in an 8 hour period. This can happen in urban environments in warm and stagnant weather, typically through car traffic. It is a great greenhouse gas because its main absorption band is at 9.5 μm, right in the atmospheric window where the outgoing black body radiation is the greatest. See fig:
The dotted blue line at 9.5 μm represents the tropospheric absorption, the total absorption is between the brown and the solid blue line. The total greenhouse effect from O3 is 0.88C, but the stratosphere does not interact very much with the troposphere, so the stratospheric O3 does not count as a greenhouse gas, only tropospheric O3. The total contribution to the greenhouse effect from tropospheric O3 is about 1/5 of the total, because atmospheric O2 absorbs in the same band limits the temperature rise to 0.17C When the earth’s temperature rises by 0.5C, from 1980 to 2022, the amount of tropospheric O3 probably rises by 2% (Lacking good data I am guessing wildly, in urban areas it may be much more, but this is global average). This comes to 0.0035C temperature increase or 0.016 W/m2 ERF from O3, from 1980 to 2022.
Appendix 5, CFC gasses.
ChloroFluoroCarbon (CFC) gasses started to be manufactured at the beginning of the refrigeration age, replacing ice as the refrigerant. It soon appeared in the atmosphere, mostly due to leaks in the air conditioner compressor seals. It didn’t amount to much as a greenhouse gas even though it was five thousand times more efficient than CO2 as a greenhouse gas. It was discovered that CFCs ate up the Ozone in the stratosphere, and if it continued to increase it could deplete the protective Ozone layer faster than it could be produced. In fact it created an Ozone hole over Antarctica. So it got forbidden Jan 17, 1994, In 2020 even China stopped production. Since 1994 CFC are decreasing by about 1% per year, but cheating persisted, especially among poorer nations and China. By 2022 it will probably have a greenhouse effect of 0.01C or 0,05 W/m2 ERF.
Appendix 6, HFC gases.
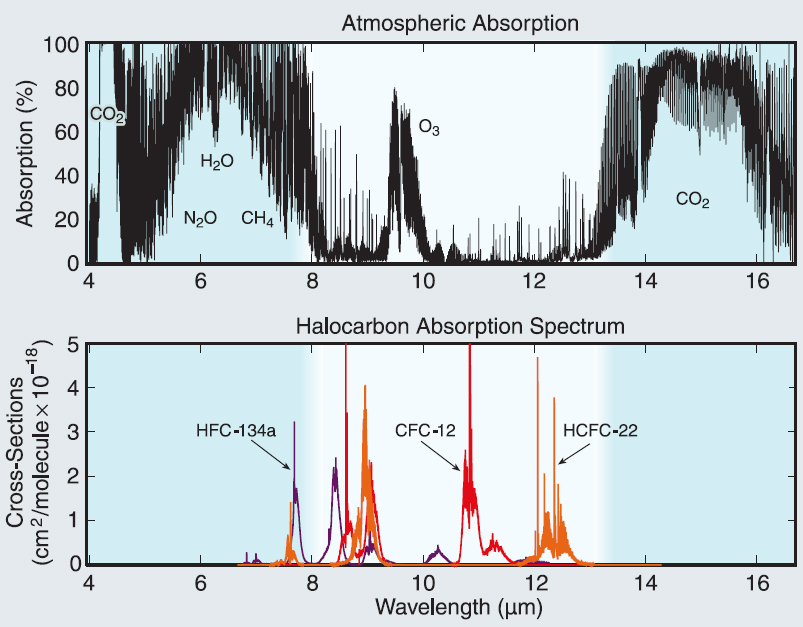
CFC started to be phased out and replaced by HydroFluoroCarbons (HFC), less efficient and more expensive, but at least they do not deplete the Ozone layer that protects us from cancer. Some of the HFCs are even bigger greenhouse effect generators than CFC, but well worth it to protect the Ozone layer. Their biggest absorption bands are in the middle of the atmospheric window.
If nothing is done to control them they will increase from nothing in 1980 until 2022 and beyond. See fig: NOAA Research News
The temperature increase from 1980 to 2022 was 0.0014 C or 0.007 W/m2 ERF..
This is a satellite photo of a mostly clear night over U.S. (There are a few clouds over eastern U.S.) It shows clearly where the big cities are, and how empty the western half of U.S. is compared to the eastern half. From this we can see and guess the size of the major metropolitan areas. Looking over North Dakota there seems to be a city of about half a million people judging from the light. But North Dakota has no big cities! What is going on?
The light area below is here_______V______________________________________________
While North Dakota is the second largest oil producing state in the nation it produces very little natural gas, only what comes as a bi-product of oil recovery, in fact it is so little that the government has let the oil companies flare off the gas rather than recover it and us it for supplying the country with more natural gas. Since the government has put a halt to build the Keystone and other pipelines, the oil out of these wells are shipped by truck and train to refineries mostly in Texas at at least three times the cost (read energy usage) of a pipeline, the government is not concerned about energy usage, only control of the production means. Granted it is only a pittance in the grand scheme of energy use, only 291 million cubic feet of natural gas was officially flared off per day in Oct 2023, but it is growing as oil production is climbing.
How much is 291 million cubic feet of natural per day that is flared off? It corresponds to a little over 300 billion BTU/day, not much, but enough to supply gas for over 5 million gas stoves in normal family use. The Government is trying to prohibit any new gas stoves in new construction. This again proves that their main concern is not energy use, since it is o.k. to flare off large amounts of gas but not using it for superior cooking, it shows that their concern is people control, not energy conservation or even common sense.
When I came to the U.S. as a resident alien immigrant from a beautiful, clean Sweden in the spring of 1968 I was horrified at what I found. In Sweden they were worried about the fact that some lakes were fertilized four times more than agricultural fields, acid rain killed the trouts in the already acid lakes and seeds laced with Mercury as a preservative killed off most of the eagles and owls. None of this seemed to bother the Americans. Coming in to Rochester in N.Y the stench from the fish washing up on the shore of lake Ontario was strong, I read of a river catching on fire in Ohio and the smell of coal burning power plants without scrubbers was bad, almost as bad as in the coal and steel region of Germany. It was also the height of the Vietnam wars, and people were protesting. Many of the protestors were communists at hart, and they also turned to pollution. The aerosol pollution led to a decrease in global temperatures, so the mantra was: The ice age is coming! The worst prediction I read was that the global temperatures would be ten degrees Fahrenheit lower by the year 2000! Most predictions were not that wild, but they all pointed down, ice age, here we come! The urge to clean up the pollution grew stronger and the Earth Day movement was formed, but they had to find just the right day to have the first. Since this was to become a global movement they decided on the birthday of Lenin, his 100th, very fitting for a globalist movement. That was 1970 in Philadelphia, featured Ira Einhorn (The Unicorn Killer) as master of Ceremonies.
Now fifty four years later the mantra has changed to climate change, specifically carbon pollution and carbon footprint. As the scientists were wrong then, the ice age is coming soon, so they are wrong now. The rise in CO2 causes climate change all right, and it would be really bad unless something else also changes as the CO2 concentration changes. Water vapor is a strong greenhouse gas, much stronger than CO2, and they both add to the greenhouse effect, but only at temperatures below freezing. In the tropics there is 50 times as much water vapor as there is CO2, so the tropics is not affected at all by rising CO2 levels. In the Arctic the situation is quite different. Water vapor is also a condensing gas, and forms clouds in the atmosphere. Clouds cool by day and warm by night, but the effect of cooling by day is much larger than the warming by night, so clouds act as the major temperature regulator on earth. That is why the tropical temperature was about the same in the tropics as now when the CO2 level was over 10000 ppm, 25 times as large as now hundreds of millions of years ago. There is zero risk of overheating, there is no “tipping point” on the warm side, the clouds take care of that. On the other hand we know that because we have too little CO2 in the air we will have a new ice age. When will it come? Not in the next thousand years, in fact, by increasing the CO2 levels we will delay the onset of the next ice age. What will happen at the Poles? They will be less cold in the winters, it will snow more but the summers will be about the same, held largely at the melting point of water.
The last 44 years we have good satellite data of the temperature rise, CO2 rise, all pollutants , cloud cover and the like, so we can examine the earth how it has responded to the rising CO2 levels, and the results are very surprising: CO2 rise contributes less than 5% of the increase is due to the CO2 rise, nearly all the changes are due to water effects, either as increased water vapor and decreasing clouds. Here are the results:
Effect from rising CO2: 0.04C or 0.19 W/m2; 4,66% of total
Effect from increasing water vapor: 0.37 C or 1.75 W/m2; 42.9% of total
Effect from rising Methane: 0.036 C or 0.17 W/m2, 4.17% of total
Effect from rising N2O: 0.0065 C or 0.031 W/m2 0.8% of total
Effect from rising Ozone: 0.0034C or 0.016 W/m2 0.4% of total
Effect from rising HFCs : 0.0015 C or 0.007 W/m2 0.2% of total
Effect from decreasing cloud cover: 0.39 C or 1.89 W/m2. 46.4 % of total
Warming of the Northern Arctic: 0.1 C. or 0.475 W/m2;11.6% of total
Cooling from pollution aerosols: 0.1 C or 0.475W/m2; – 11.6% of total
Temperature increase from greening of the earth 0.0063C or 0.030 W/m2; 0.7% of total
Temperature decrease from areas of desertification 0.0015C 0.007 W/m2; 0.2% of total
TOTAL TEMPERATURE CHANGE 1980 to 2022: 0.8522 C or 4.077 W/m2
While I realize that increasing CO2 levels contribute to climate change, it is on balance positive, since the earth is increasingly fertilized by increasing CO2 In fact the earth has been more than 15% greener since industrial age by increasing CO2 alone, enabling us to feed 2 billion more people without increasing fossil fuel generated fertilizer. The extra greening means more clouds generating aerosols, which is good except where it already rains too much.
Where we have a problem is with the arid areas, where much water is drawn from the aquifers, the best clean water there is. When the aquifers are deleted desertification sets in. This has already happened in Kazakhstan, where lake Aral disappeared as soon as the Amu- and Syr-darja rivers were siphoned off to produce cotton. This worked fine for about ten years, then the lake dried up, the rains stopped and the rivers dried up. China has built 12 dams in the Mekong river, so now the once reliable yearly floodings stopped and the harvest in the lowlands are disrupted. The once reliable Nile river is a shadow of its former self, all the silt stays above the Aswan Dam rather than fertilizing the lower Nile. The U.S. southwest aquifers are being drawn down and will no longer produce anywhere near as much water as they used to. The whole American Southwest is slowly undergoing desertification. We need to rethink our use of water rather than waste trillions of dollars on CO2 control, which will solve only 5% of the problem.
The other problem with water is waste quality. A most pressing problem is micro plastics. Some of it comes from tire wear. Electric cars are heavier than gasoline cars, leading to more tire wear. Another problem is with water sanitation, Microplastics does not accumulate well in silt,neither does it break down easily. Another problem is antibiotics excreting in the urine of both people and animals, birth control and other medications excreted through urine will act as harmful pollutants,
We have our work cut out for us. There are solutions to all of these problems, but they all require energy, either as heat or electricity. The only possible solution is nuclear power, specifically molten salt nuclear power. Nuclear power can be generated from U233, U 235 and Plutonium 239. These are the available options. We have already used up most of the U 235, which is less than 0.7 percent of the available Uranium. Small modular Reactors can use Thorium, spent Nuclear fuel and depleted Uranium for fuel, all with using special mixtures to sustain a generation. One specially exciting option is to use a molten salt generator as a heat source and incinerate plastics and other trash without supplying Oxygen. That will produce hot gas that will be used for electricity generation, and the resulting Carbon can be made in the form of Graphene.
These are exciting times. We have the solutions ready to clean up the earth by going nuclear with SMRs of many types. They will lessen the mining demands on the earth significantly as they operate under atmospheric pressure. In addition they will make us less dependent on expanding the national grid, the power can be generated where it is used. I could go on, but here are The many cases why Thorium Nuclear Power is the only realistic solution to the world’s energy problems.
Thorium is the long time solution. In the short time we should deplete the nuclear Plutonium waste as fast as possible.
The Earth can be described as a black body with energy coming in, mostly from the sun and an equivalent amount of energy being emitted. This follows the the Stefan–Boltzmann law, which states that the total energy radiated per unit surface area of a black body across all wavelengths per unit time j ⋆ (also known as the black-body radiant emittance) is directly proportional to the fourth power of the black body’s thermodynamic temperatureT: The average temperature on earth is 14 C or 287.15 degree Kelvin. This means that for every degree the earth gets warmer it emits 1.4% more energy. The sun’s incoming energy is nearly constant, well within +- 0,5%, so if the earth warms up more than one degree Celsius, it must come from changes on earth.
The best way to find out how the earth reacts to changes is to provide an impulse and see what happens. One such impulse was the open air atomic tests in the early 1960s.
Cosmic radiation in the form of iron nuclei is the major source of the generation of Carbon 14. When fossil fuel is burned there is very little C14 in the CO2 generated, but if it is burned by digestion of food, by fermentation, by burning wood or by wildfire, it contains the same concentration of C14 as was in the air at the time of the generation of the biomass. Since C14 has a half life of 5700 +- 40 years, we could find out the age of that biomass -or could we?
This is one of my very favorite slides. The best way of finding out how a black body responds is by introducing an impulse and see what happens. In this case the impulse was open air nuclear bomb tests, performed mostly by United States and the Soviet Union, but all occurred in the Northern Hemisphere. Test stations to see the amount of C14 in the air were set up in Austria and New Zealand. What did we learn? We learnt that the air mixes between the Northern and the Southern Hemisphere in about 2 years, and because the half-life of C14 shown here is 12.5 years, not 5700 years, it shows the absorption rate in the oceans and into new biomass. These values would have been difficult if not impossible to find out without open air Nuclear tests, Were the tests bad? You bet, but since they happened, you glean what you can from it. What else did we learn? You can no longer use carbon dating if there is any chance of contamination with newer biomass, or if it is newer than 1955 A.D.
In examining a black body, in this case the Earth for distinguishing properties it is very useful to observe how it reacts to impulses. We want to see which impulse response lead to climate change and which are just weather changes. All impulses lead to a response with a time delay.
There are those that say that climate change the worst threat to the world as we know it, worse than all out nuclear war. This is false.
Before we tackle the impulse change that everybody are worried about, the onset and growth of the industrial age and its outputs, let us examine few other impulses first.
The steady state of the earth is an ice age, and in the next segment we will examine how the earth ended the Ice age.
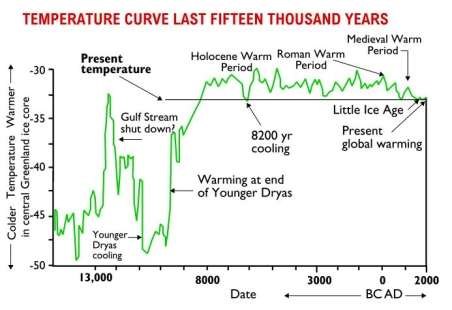
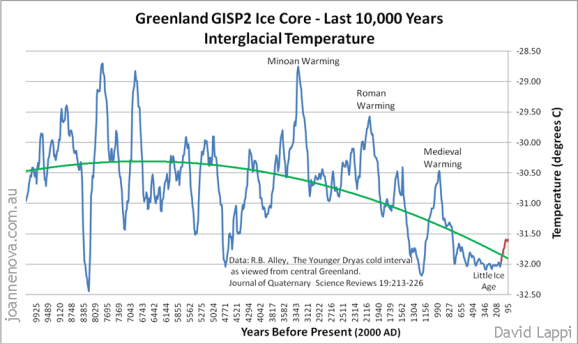
The weather has been warm lately. the earth has set a string of new maximum temperatures in July and will set a new absolute record for the month of July since the beginning of satellite record in 1979. The once reputable Forbes Magazine expressed it this way: July 4 was the warmest day in over 100,000 years! Now wait a minute! Aren’t we still recovering from the little ice age? See chart:
It was warmer for 9,000 of the last 10,000 years than it is now!
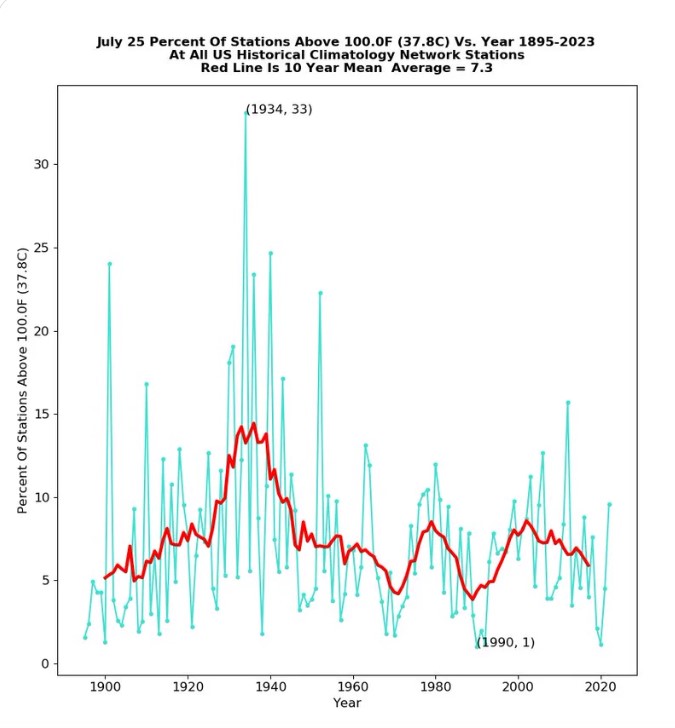
Now take a look at the temperatures before 1979.
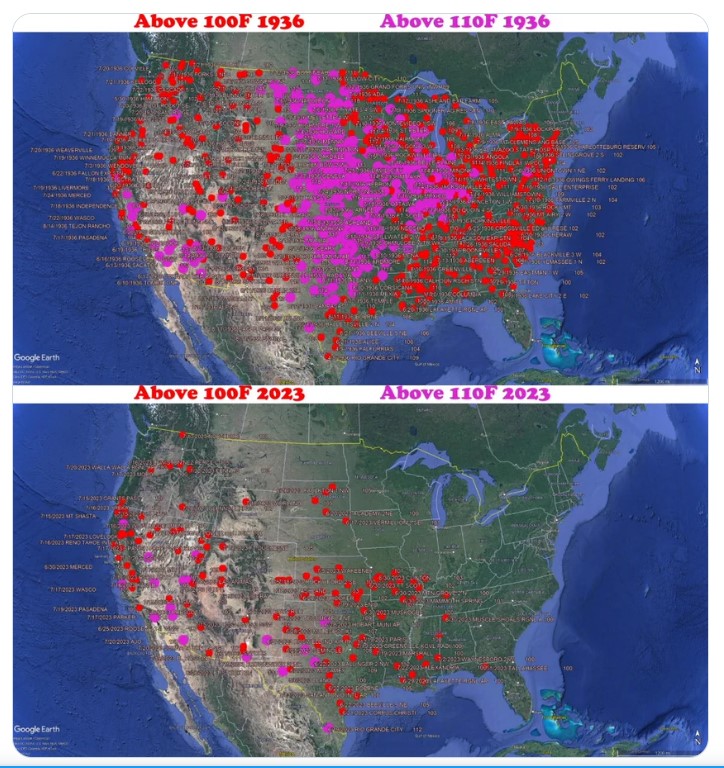
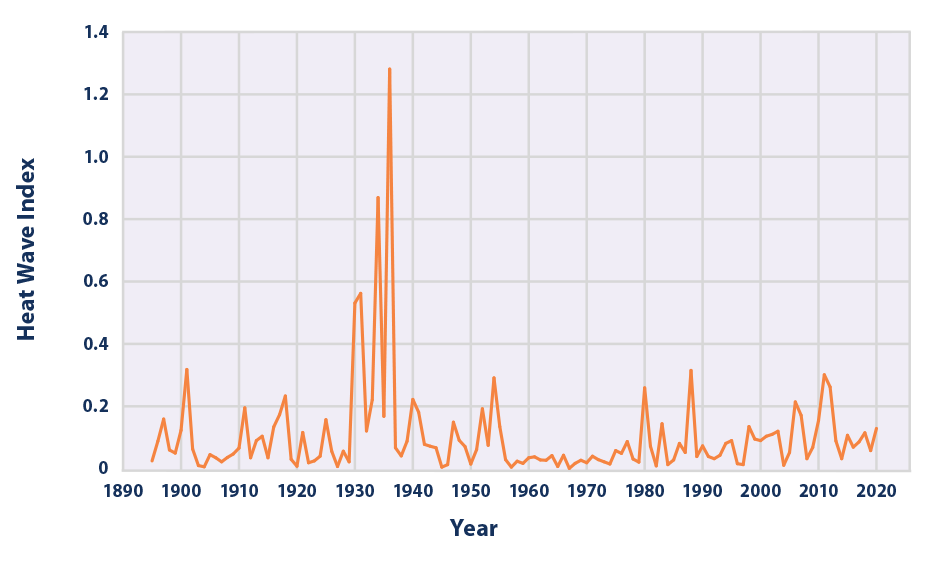
How bad were the heatwaves of the 1930s years of the dust bowl compared to the heatwave of 2023? Granted , there were many more temp measurement stations in the 1930s , not all of which fully measured up to accepted standards, but the heatwaves were both worse and more widespread then. Look at the two maps:
Yes, things were worse in 1936. How did they even survive, with only 70% of America being electrified, and nearly all of rural America being without electricity, and it was not until 1935 as the Rural Electrification Administration (REA), a New Deal agency promoting rural electrification was established. Very few had air conditioning of those that had electricity. How did they survive?
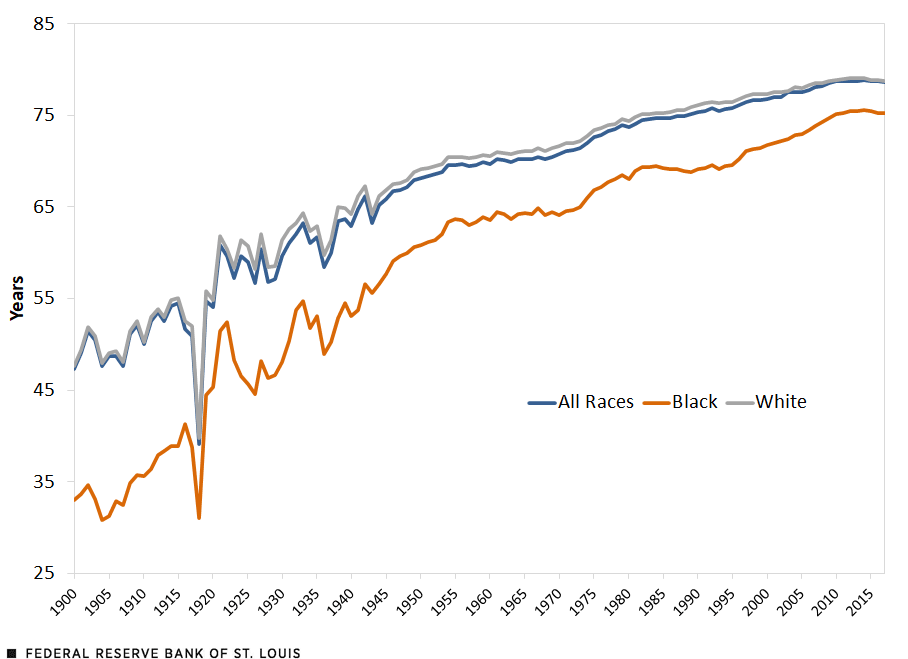
Not very well, see chart:
The life expectancy dropped by 4 years for all between the years 1931 to 1936.
The weather has been warm lately. the earth has set a string of new maximum temperatures in July and will set a new absolute record for the month of July since the beginning of satellite record in 1079. The once reputable Forbes Magazine expressed it this way: July 4 was the warmest day in over 100,000 years! Now wait a minute! Aren’t we still recovering from the little ice age? See chart:
It was warmer for 9,000 of the last 10,000 years than it is now!
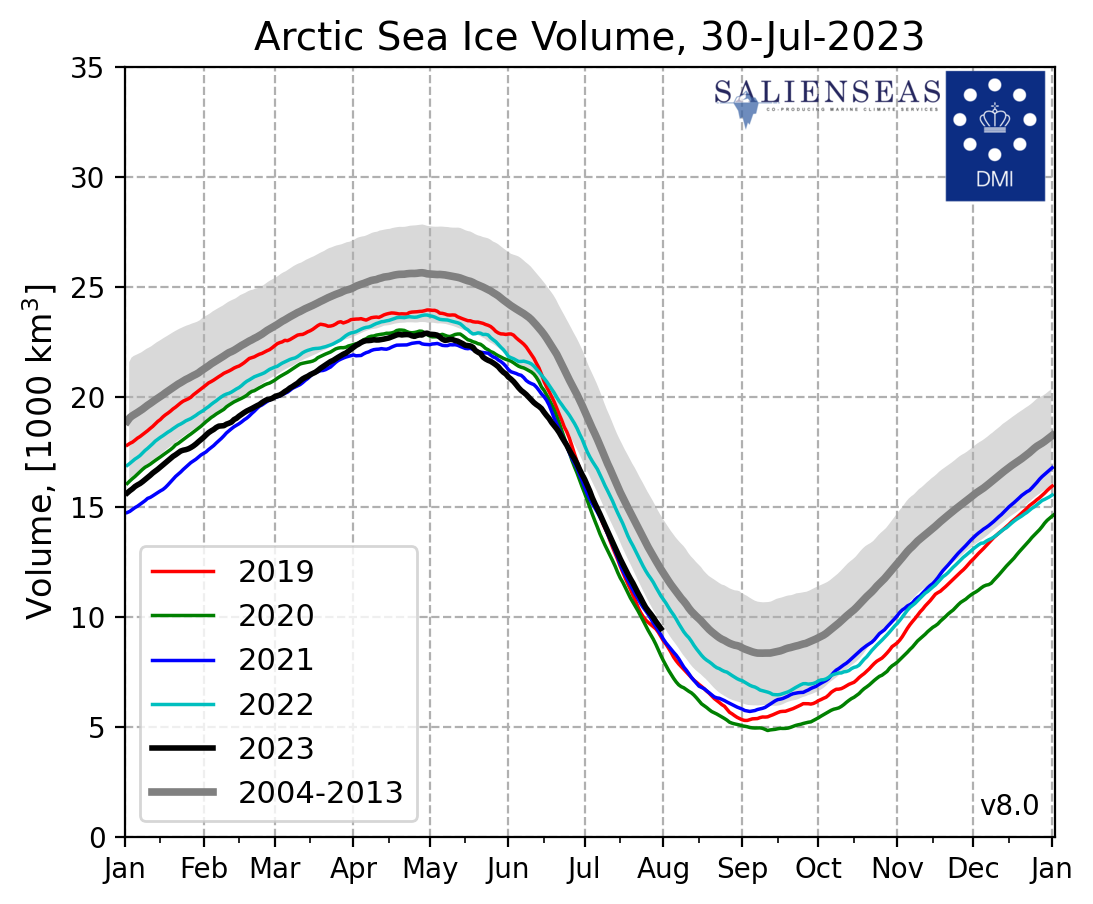
Let us take a look at what is happening to the Arctic ice sheet. Its demise has been predicted to be total well before 2020. How is that going? The Danish Meteorological institute takes daily measurements of the Arctic and Greenland’s ice sheet, volume and temperature.
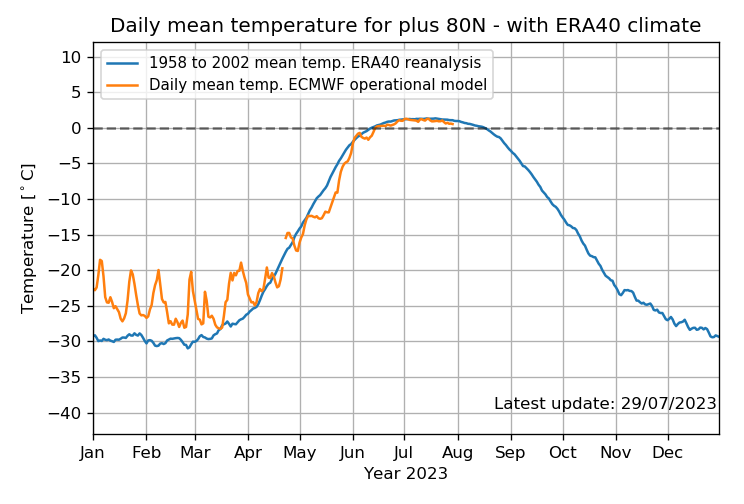
It seems pretty normal to me, no runaway ice melt the last few years. I fact this year the Arctic temperature above the 80th latitude has been at or below normal since late April. How about the ice on Greenland?
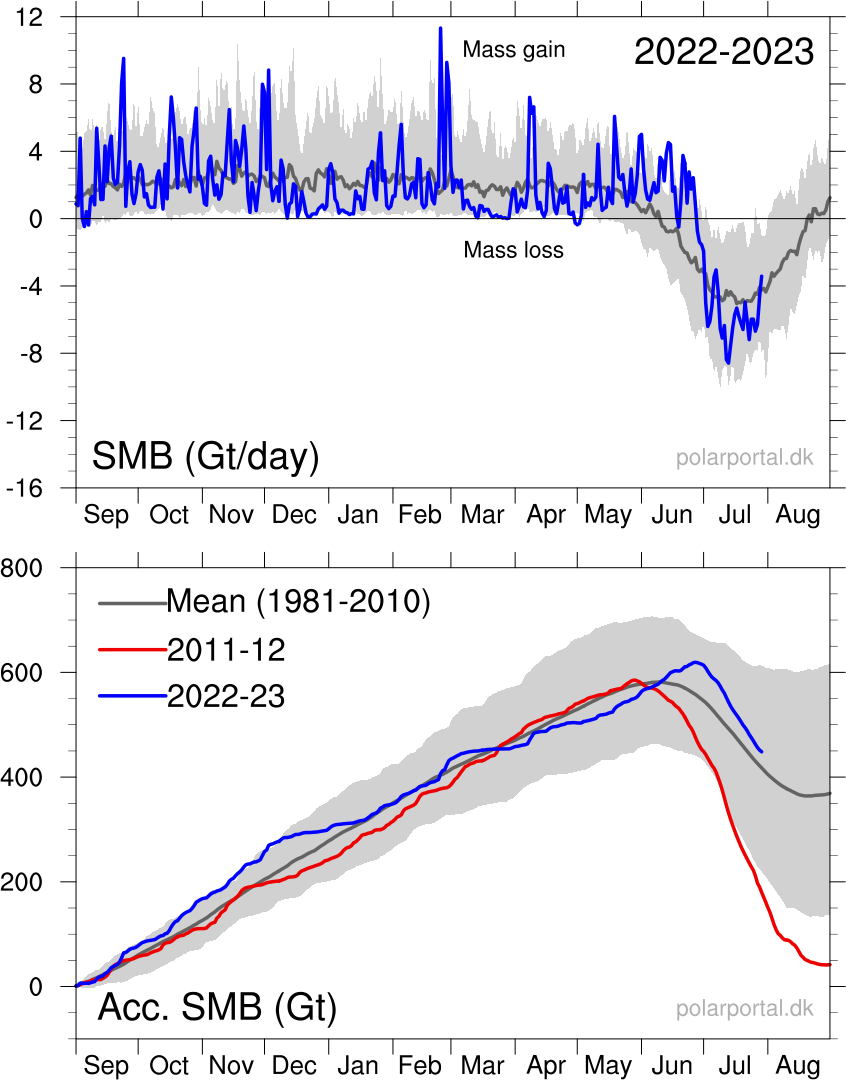
The ice gain, and the summer ice loss over Greenland seem pretty normal to me.Yes the snow melt was delayed by a month,followed bya stronger than normal snow melt. This is all within the boundaries of normal weather.
The heat wave in the south and Southwest of U.S.A. was caused by a blocking high pressure, causing less clouds, less winds and in part less rain than normal. This happens some years, but can still be explained as weather.
The era of global warming has ended and “the era of global boiling has arrived”, the UN secretary general, António Guterres said after scientists confirmed July was on track to be the world’s hottest month on record since global satellite records began in 1979.
The surface ocean temperature around the Florida Keys soared to 101.19 degrees this week, in what could be a global record as ocean heat around the state reaches unprecedented extremes.
This calls for a Limerick
It’s hot around Florida Keys
the temp is expressed in degrees.
Is it F, is it C?
Makes a difference to me.
It depends whom you want to appease.
This being the U.N.; renaming climate science “Global Boiling” can only mean they do not know the difference between Fahrenheit and Celsius.
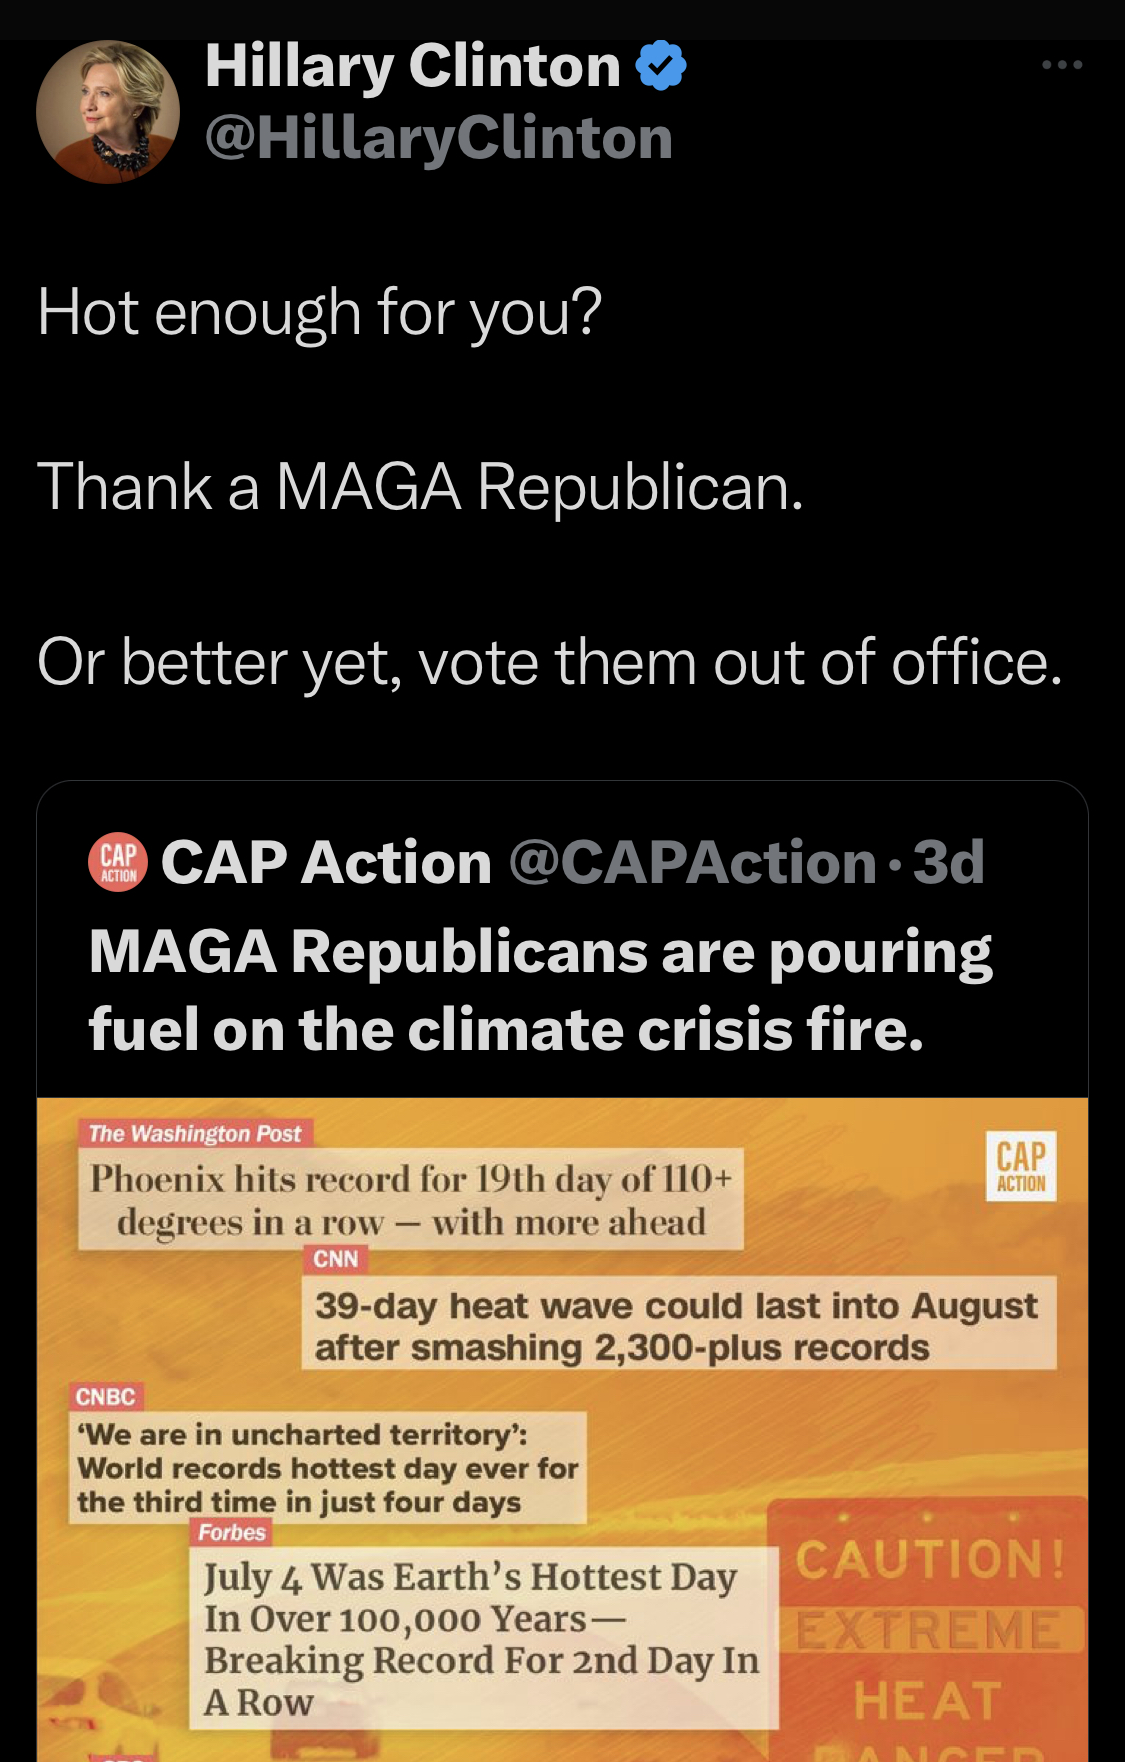
This tweet from the twice defeated presidential candidate and 2016 election denier Hillary Clinton caught my attention for its many factual errors. This is the forwarded tweet:
It begins with factual recording from the Washington Post. It is a record string of very hot days in Phoenix. In fact, today is the 25th day of over 110F, and continuing.
The next headline is from CNN tells of the heat wave all over the south, where nearly every community in the area shows one heat record after another. The count is more than twice as high now. The heat wave continues. About the only record not broken is the maximum temperature in Death Valley, still standing at 134°F (57°C) on July 10, 1913.
Not to be outdone, MSNBC chimes in with “We are in uncharted territory”, which is true since worldwide satellite measurements didn’t start until 1979. So it isn’t very surprising that new records will be set. The time frame is only 44 years.
But Forbes magazine takes the cake: The once serious business publication states that July 4 was the hottest day in over 100,000 years! The real temperature after the little ice age isn’t even back to the medieval warm period, much less the Roman warm period, even less than the Minoan warming
Even more interesting is the temperature in the Holocene Climate optimum:
From this chart we can see, even as there were no global measurements taken it was warmer during 8000 of the last 10,000 years, at least according to the Greenland Ice Cores.
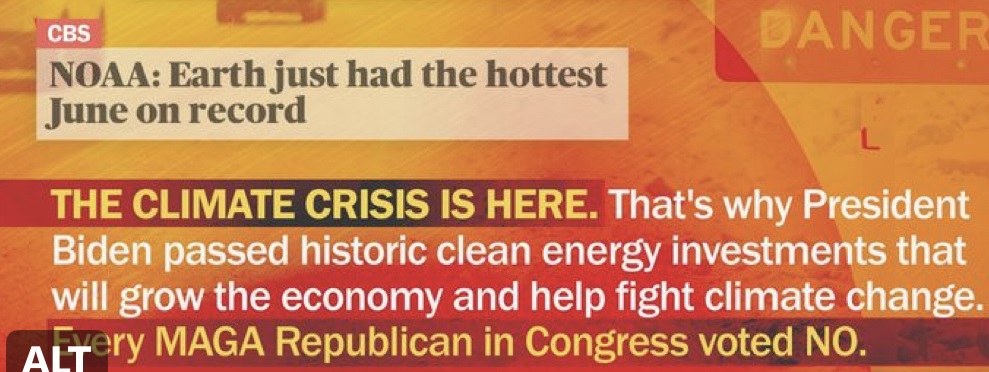
But back to the Hillary tweet: CBS claimed that Earth just had the hottest June on record. What they forgot to mention was “since worldwide satellite records began in 1979”
This calls for a Limerick
The Climate change pace in this plot
shows voting next fall means a lot.
No original sin
if Republicans win
since temperatures will be less hot.
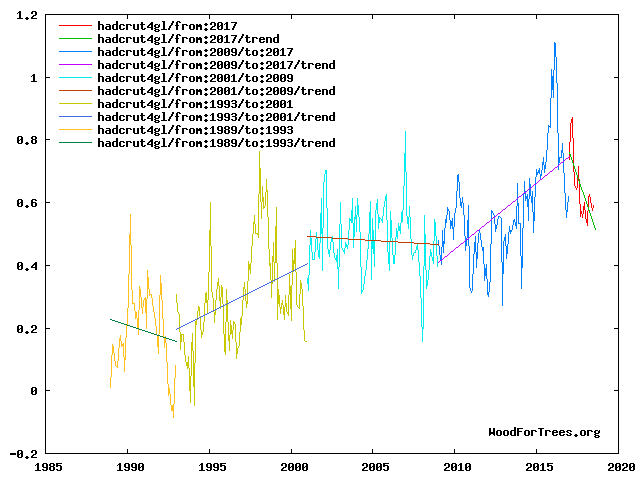
From Wattsupwiththat.com comes this interesting plot: (Thanks, David Middleton)
From this we can see that the global temperature changes according to hadcrut4gl are:
During the presidency of George H W Bush temperatures fell by 0.20 C/decade
During the presidency of Bill Clinton temperatures rose by 0.26 C/decade
During the presidency of George W Bush temperatures fell by 0.04 C/decade
During the presidency of Barack H Obama temperatures rose by 0.42 C/decade
So far , during the Presidency of Donald J Trump global temperatures have receded 0.24 C.
President Donald J Trump ended his presidency with a temperature decline of 0.37C/decade.
So far, during Joe Biden ‘s presidency temperatures are up 0.18C, and that was before the latest heatwave.
It seems the hot air is coming from Democrats, and with Republicans cooler minds prevail
And a bonus question. During the 1930s the number, length and severity of U.S heatwaves was much worse. Who was president for most of that time?
Oh and by the way, in the 1930s the CO2 level was around 300 ppm. It is now 418.4 ppm or 40% higher.


 (also known as the black-body
  The average temperature on earth is 14 C or 287.15 degree Kelvin. This means that for every degree the earth gets warmer it emits 1.4% more energy. The sun’s incoming energy is nearly constant, well within +- 0,5%, so if the earth warms up more than one degree Celsius, it must come from changes on earth.