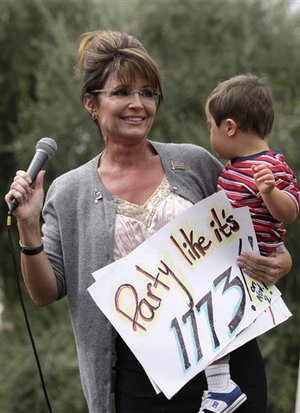
A gal from the forty-ninth state
made “leaders” all bristle with hate.
She resigned from her post
to accomplish the most.
And now, she is Grizzly Mom Great.
On a totally? different note, here is a view from Canada, how the rest of the world sees us with our current “leaders.”
# 10 Only in America… could politicians talk about the greed of the rich at a $35,000.00 per plate Obama campaign fund-raising event, or demand $300000 for a speech at a university, claiming to be “one of them”.
# 09 Only in America… could people claim that the government still discriminates against black Americans when they have a black President, a black Attorney General and roughly 20% of the federal workforce is black while only 14% of the population is black, 40+% of all federal entitlements goes to black Americans – 3X the rate that go to whites, 5X the rate that go to Hispanics!
# 08 Only in America… could they have had the two people most responsible for our tax code, Timothy Geithner (former head of the Treasury Department) and Charles Rangel (who once ran the Ways and Means Committee), BOTH turn out to be tax cheats who are in favor of higher taxes.
# 07 Only in America… can they have terrorists kill people in the name of Allah and have the media primarily react by fretting that Muslims might be harmed by the backlash, and the administration declare it “workplace violence”.
# 06 Only in America… would they make millions of people who want to legally become American citizens wait for years in their home countries and pay tens of thousands of dollars for the privilege, while they discuss letting anyone who sneaks into the country illegally just ‘magically’ become American citizens. (probably should be number one).
# 05 Only in America… could the people who believe in balancing the budget and sticking by the country’s Constitution be called EXTREMISTS.
# 04 Only in America… could you need to present a valid ID to cash a check or buy alcohol, or board a commercial aircraft, but not to vote.
# 03 Only in America… could people demand the government investigate whether oil companies are gouging the public because the price of gas went up when the return on equity invested in a major U.S. Oil company (Marathon Oil) is less than half of a company making sneakers (Nike).
# 02 Only in America… could you collect more tax dollars from the people than any nation in recorded history, still spend a Trillion dollars more than it has per year – for total spending of $7 Million PER MINUTE, and complain that it doesn’t have nearly enough money.
# 01 Only in America…. could the rich people – who pay 86% of all Federal income taxes – be accused of not paying their “fair share” by people who don’t pay any income taxes at all.
And Yet, the United States of America still stands. It is gives proof through the night that our flag is still there, o’er the land of the free, and the home of the brave.
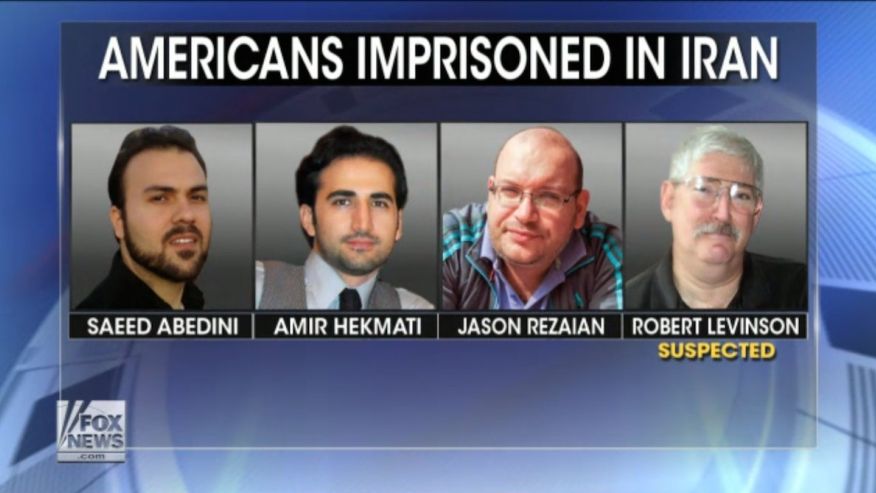
 Barack Obama