On “The sin of the world” and “The lie”, what does that mean?

On “The sin of the world” and “The lie”, what does that mean?
I am a man. I tend to forget anniversaries. They sneak up on me like a thief in the night, and suddenly and without warning I have to think and act fast to come up with something to celebrate the occasion. For women it is usually no problem. They do remember.
People react differently when disaster strikes. On a Monday, October 2, 2006 a man in Nickel Mines, Pa opened fire, killed 5 and wounded 5 Amish school girls in their little one room schoolhouse, then killed himself. The world reacted with horror, but the Amish attended the killer’s funeral and the murderer’s widow attended the funeral of one of the girls. The next Monday the school and privies and fence was no more, the yard and adjacent field was plowed. There was no trace there ever was a school. They chose not to remember the crime against their fellow men, but desired to follow the Lord Jesus’ admonition: “And forgive us our trespasses, as we forgive those who trespass against us”
Not so the Muslims.
On November 14, 1914, in Constantinople, capital of the Ottoman Empire, the religious leader Sheikh-ul-Islam declared an Islamic holy war on behalf of the Ottoman government. He Sheikh-ul-IslamMuhammadspeaksurged his Muslim followers to take up arms against Britain, France, Russia, Serbia and Montenegro in World War I.
The Fatwa reads in part: “Of those who go to the Jihad for the sake of happiness and salvation of the believers in God’s victory, the lot of those who remain alive is felicity, while the rank of those who depart to the next world is martyrdom. In accordance with God’s beautiful promise, those who sacrifice their lives to give life to the truth will have honor in this world, and their latter end is paradise.”
The following years nearly two million Christians, mostly Armenians were executed in a genocide. The men were hanged or beheaded, the women and girls were stripped naked, raped and then crucified by the thousands.
On November 14, 2014, exactly 100 years later the National Cathedral in Washington, D.C. hosted a Muslim Friday prayer, off limits to Christians.
Coincidence? I think not.
The intent was good, reconciliation between Christians and Muslims. “If we show our good will, they will reciprocate, and the world will be a better place with peace and good will MuslimsinWashingtonCathredraltoward men.”
Nothing could be further from the truth.
When John the Baptist saw Jesus coming he proclaimed: “Behold the Lamb of God that taketh away the sin of the world”.
Why is “the sin” singular? There are many sins, in fact everything that is not in perfect accordance with God’s will can be called a sin.
In a way the Muslim prayer in the Washington Cathedral is a good example of “the sin of the world”.
The Muslims issued the call to prayer, the men (separate from the women” prostrated themselves with their face to Mecca and their derrieres towards the crucifix, proclaiming “Allah Akbar”. In so doing they declared the Washington Cathedral “Dar-al-Islam”, territory claimed for the Islamic Caliphate in perpetuity. But that is not “The sin”.
The sin is denying Jesus Christ as Lord and Savior, Crucified, buried and resurrected. Somehow, in the minds of the Episcopal Church leaders, this is less important than ecumenism. The Muslims, while acknowledging the virgin birth of Jesus Christ deny his death, burial and resurrection. If they did accept this, that would make Muhammad a liar, thus blaspheming the Prophet.
There was a woman, Christine Weick, who drove all the way from her Tennessee home to deliver a message of truth to the Muslim worshipers: “Jesus Christ died on that cross over MuslimChristianthere. He is the reason why we are to worship only Him. Jesus Christ is our Lord and Savior.”
She continued, “We have built, and allowed you here in mosques across this country. Why can’t you worship in your mosque, and leave our churches alone?”
She was quickly escorted out of the Cathedral and prayer continued with their faces to Mecca and their derrieres towards the cross.
The Sin is unbelief in the Lord Jesus Christ and the redemption, God reconciling us back to himself through the power of the cross. The sin of willfully separating ourselves from God and rejecting Jesus Christ as Lord and Savior is what John the Baptist referred to when he said: “Behold the Lamb of God that taketh away the sin of the world”.
Now for “The lie”.

Lies seem to be increasing, especially in politics. (Politics as you know comes from two Greek words: Poly which means many, and ticks which means blood sucking pests) Politics is also the art of the possible, where you bring different factions together and come to a solution that is mutually beneficial for all parties. This only works if the negotiations are based on truthfulness rather than lies.
So, what is “The lie”?
Satan is referred to as “the father of lies”, but that is lies in plural, and we are perfectly capable of lying ourselves, so let us not involve him here except for one thing: It started in the Garden of Eden. Satan, in the form of the serpent said: “Did God really say…?” This started the ball rolling and man was separated from God.
There are two scriptural references to “The lie”
Romans 1:24-25 (NKJV) Therefore God also gave them up to uncleanness, in the lusts of their hearts, to dishonor their bodies among themselves, who exchanged the truth of God for the lie, and worshiped and served the creature rather than the Creator, who is blessed forever. Amen.
2 Thessalonians 2:9-12 The coming of the lawless one is according to the working of Satan, with all power, signs, and lying wonders, 10 and with all unrighteous deception among those who perish, because they did not receive the love of the truth, that they might be saved. 11 And for this reason God will send them strong delusion, that they should believe the lie, 12 that they all may be condemned who did not believe the truth but had pleasure in unrighteousness.
“The lie” can be best explained as refusal to accept and worship God as the Creator and sustainer of all things, and a strangely fitting anniversary can best explain the lie.
Lenin
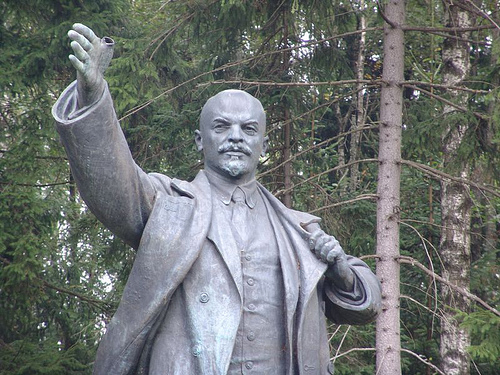
On April 22 1870, VladimirLenin (Владимир Ильич Ленин) was born. He is the father of modern revolutionary communism, atheistic and centered around the idea that power comes from the barrel of a gun.
April 22 1970, exactly 100 years later it was time for the first Earth day.
Coincidence? I think not.
It started innocently enough with Ira Einhorn (The unicorn killer) as master of ceremonies in Philadelphia, PAearth-day-Einhorn-02 
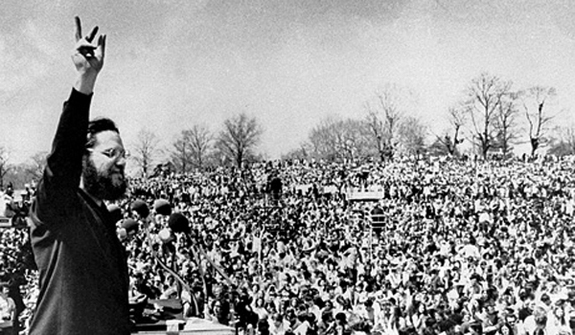
“We only have one earth, so we need to take care of her.” That’s what Senator Gaylord Nelson of Wisconsin believed. So he organized the movement. The mantra was: “By the year 2000 the earth will be 10 degrees colder than today unless we act to clean up our air”. This lead to the creation of the EPA, a Clean Air Act, and the threat of the new ice age was averted.
This was a great success, and the environmentalists grew bolder and wanted more action on pollution and habitat protection, but the movement was taken over by the communists, socialists and humanists that saw population control as the main goal to save the planet. They formed a coalition under the banner of “saving the world from the coming environmental catastrophe”.
It was now getting warmer again after the temporary cooling during the 60’s and 70’s, so the earth day movement needed a new attack point to continue their fight for a better and sustainable earth. They found an unlikely ally in Margaret Thatcher, who had her run in with the coal unions that was ruining Britain’s economy, mining coal seams as narrow as a few inches. She wanted to do away with unprofitable coal and concentrate on nuclear power, and the greenhouse effect of CO2 started to get promoted. It took on a life of its own. Research money was suddenly available to study the atmosphere and climate.
Let me pause here and indulge in a personal anecdote. Many years ago, around 1977 Dr. James Lovelock bought a number of HP Gas Chromatographs to set up in the remotest corners of the earth to study pollution and its effect on the climate. What he found was an unexpectedly large amount of dimethylsulphide (DMS) (ref 3)microbes_sar11 
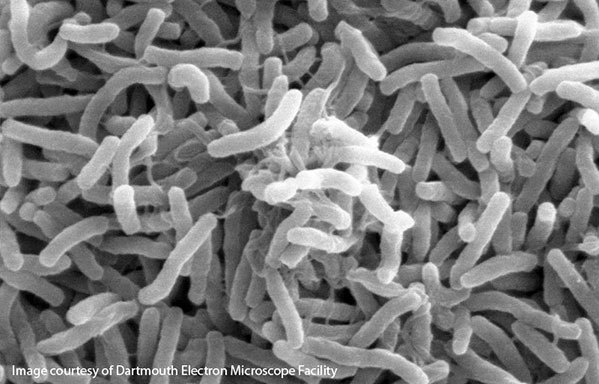
in the atmosphere, and that acted as a condensation point for cloud formation. He was then a paid consultant for Hewlett Packard, so he came over from his native England a couple of times a year, always willing to hold a seminar for us engineers, and at one of them he sprung “Daisy-world” on us, before it was published, mostly to see if we could poke holes in his hypothesis. It involved a world that consisted of only two flowers, black daisies and white daisies. The computer simulation starts out with a cold world and a weak sun. The sun warms up until suddenly black daisies appear and cover the earth. This warms the earth some more and white daisies appear. As the sun varies in intensity the mix of white and black daisies changes and this keeps the earth at a stable temperature, as they have different reflective properties. He then went on to say that the whole earth is like a living organism.
Some time later he presented the paper and the next year we asked him how it was received. “You won’t believe it”, he answered. ”Now there are people who actually believe the earth is a living organism. They demand follow-up articles that justifies their belief.” He had partly himself to blame, the name he chose was the GAIA hypothesis, Gaia being the Mother earth Goddess. Talking about religion the Mother Earth people now had their goddess, and expressions like. “The earth has a temperature” became commonplace. For me, being a Christian I read with wonderment what God has to say about the Ecosystem.

We find this in Genesis 1:6-8 (NIV) And God said, “Let there be an expanse between the waters to separate water from water.” 7 So God made the expanse and separated the water under the expanse from the water above it. And it was so. 8 God called the expanse “sky.” And there was evening, and there was morning—the second day.
The creation story is interesting reading. God takes a whole day out His busy schedule of creation just to create the clouds. In days three to five of creation He adds the statement “And God saw that it was good”, on day six it was “very good”. Could it be that God knows the ecosystem is fragile and we are going to mess it up beyond repair? Exactly why was it then very good? Could it be it was very good after the whole creation was complete, all the components that make up a stable ecosystem was put in place? First then could He finally say: Genesis 1:31 God saw all that he had made, and it was very good. And there was evening, and there was morning—the sixth day.
Let us hurry back to our quest for something other than pollution that acts as a negative feedback to make the temperature system stable. With some anxiety (we are part of the ecosystem, so we better try to understand it) but also assurance we return to the GAIA factor.
As is mentioned before, Dr. Lovelock had found unusually high amounts of dimethylsulphide (DMS) in places far from any pollution source. Something must have put it there. It turns out DMS is a waste product from phytoplankton, an abundant life form in the oceans, low on the food chain. As ocean temperature rises, phytoplankton levels increase, suggesting a possible feedback mechanism. The DMS molecules act as a condensation kernel for the formation of Clouds. This is something that it is hard to get a grip on. Clouds have a positive feedback as they hold in heat once captured by the earth, but that is more than offset by the large negative feedback that is caused by the albedo factor. The white clouds act as a reflector, and more of the solar energy gets reflected back out into space. This negative feedback factor can be as high as – 1.9 W m-2/°C. This means there is a strong negative feedback in the ecosystem keeping the earth from boiling over since water vapor is a much stronger greenhouse gas than CO2.
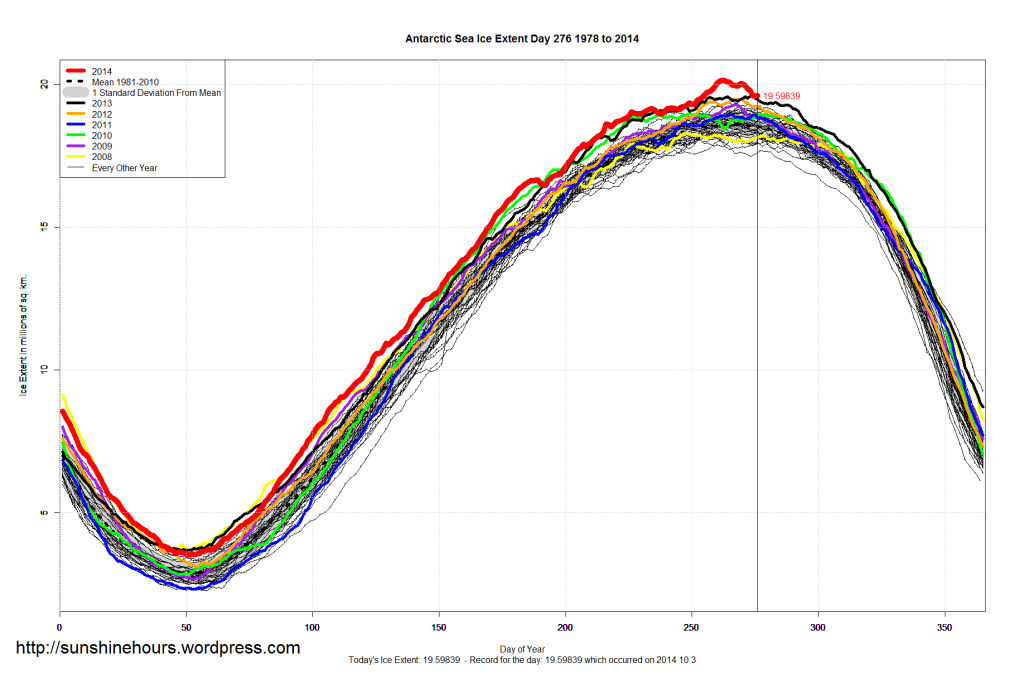
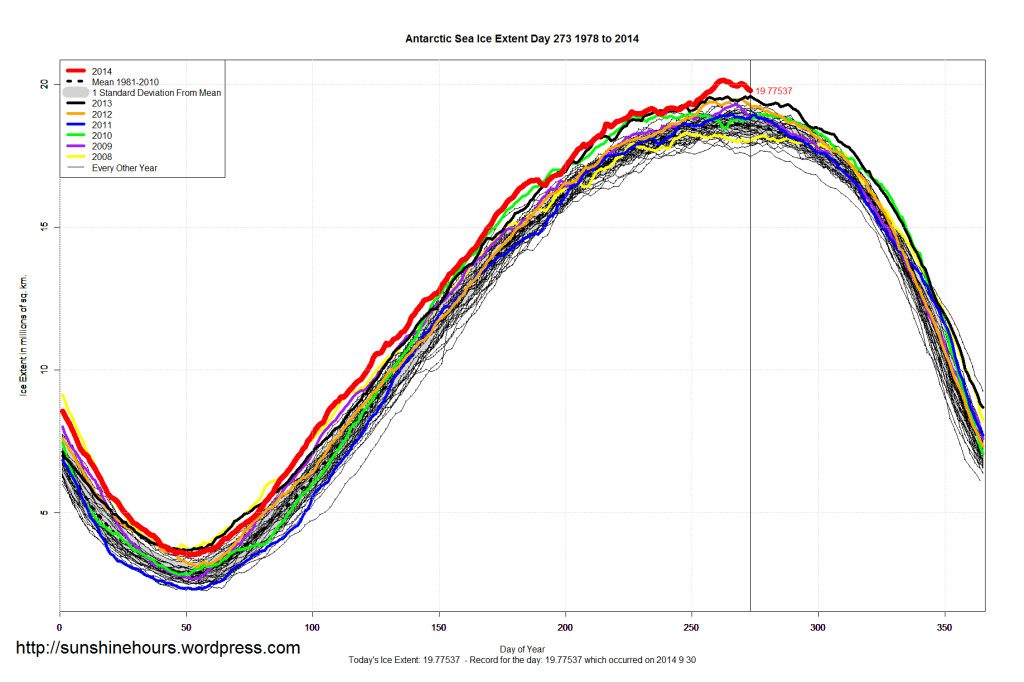
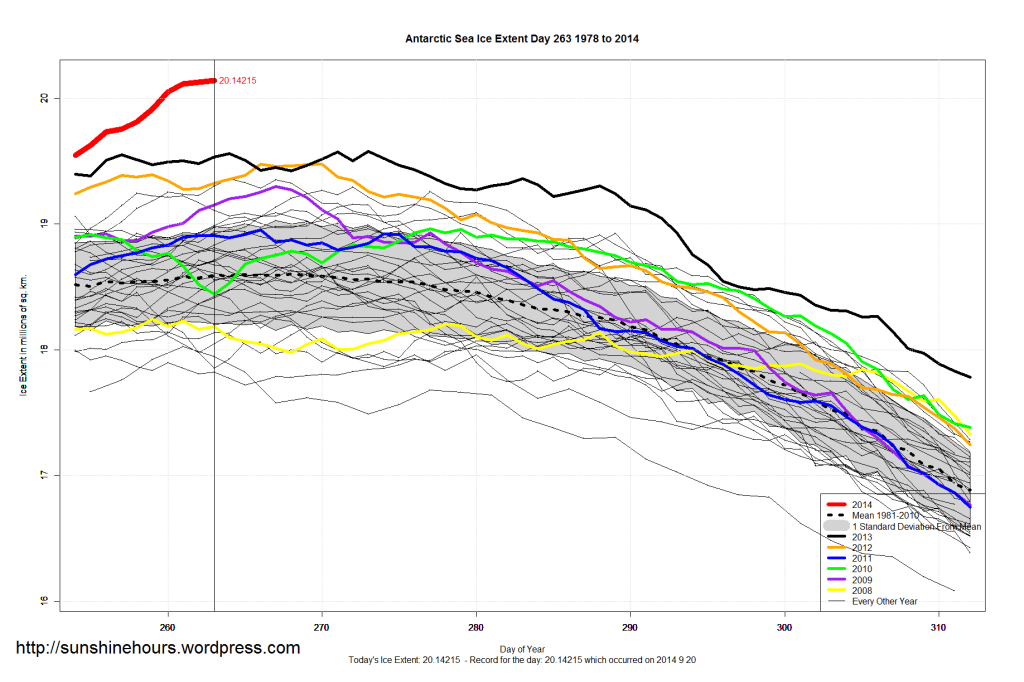
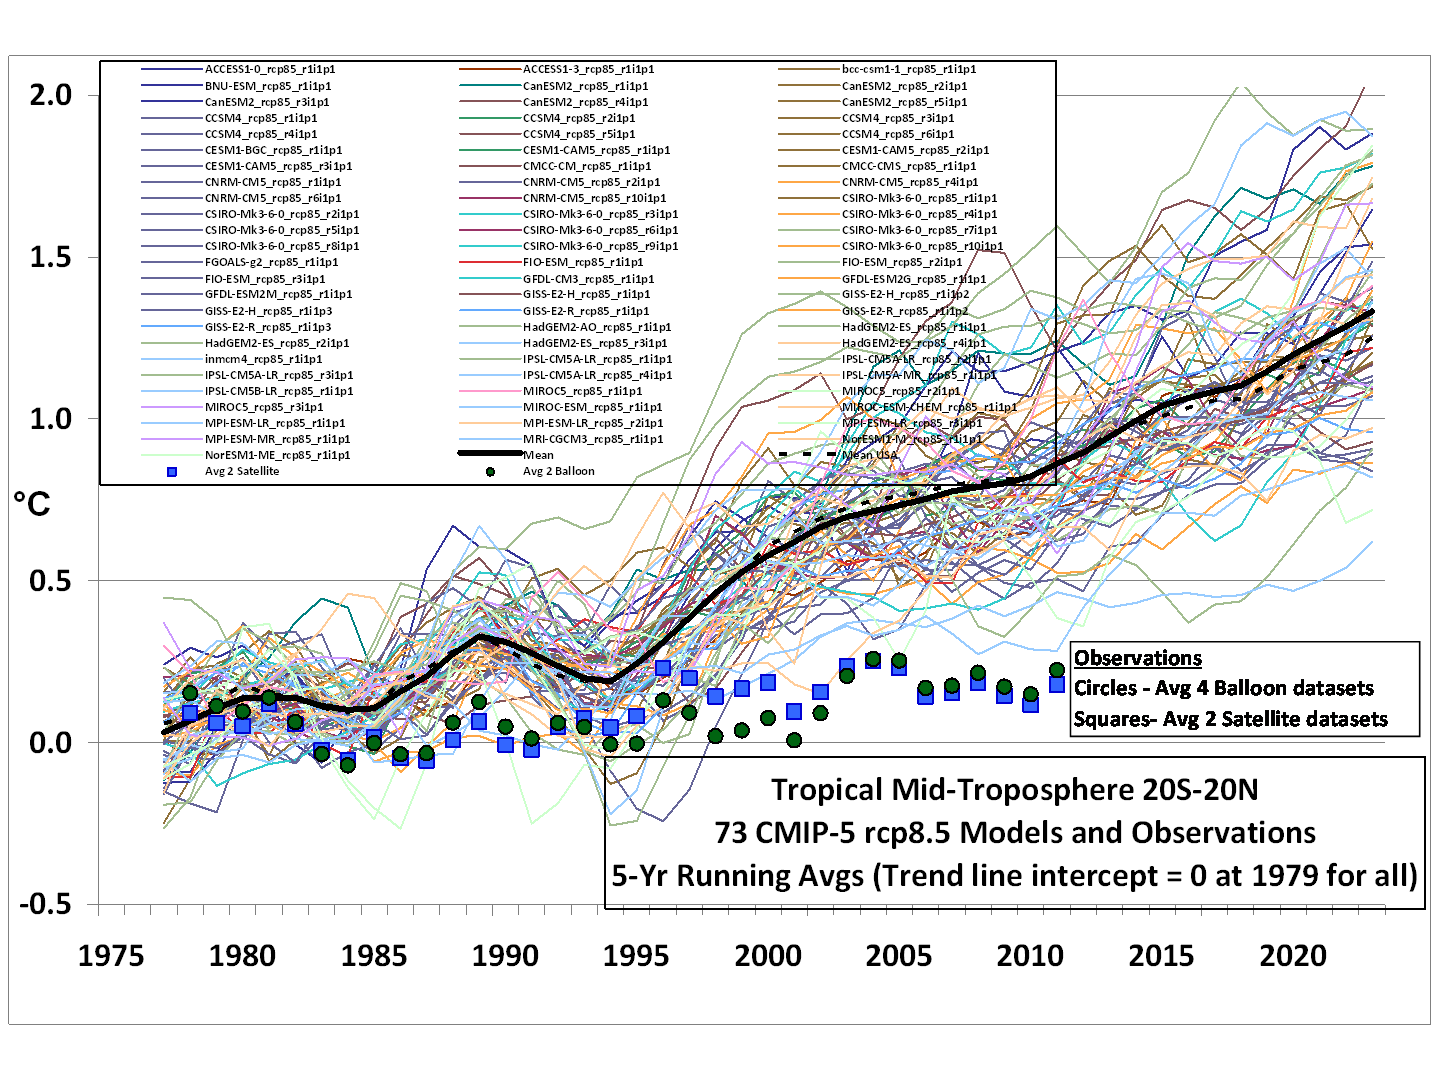
None of this mattered to the Mother Earth people believing in GAIA. They formed a coalition with the communists and socialists and Global Governance advocates and convinced U.N. that CO2 was bad and needed to be controlled, and so IPCC was formed to give the scientific justification why it was necessary to control CO2 emissions. I do not know how many Global Climate models there are out there, but I have seen (1) a chart with 73 Climate models, all pointing to a rapidly warming earth, plotted versus reality, which shows a more or less stable temperature versus time. But the models are all paid for by Government money, so the more, the merrier. They all do a lousy job modeling clouds, so no wonder they fail. (2) But they produce the result the funding agencies demanded for continuing funding, so the charade goes on. The models are all based on a positive feedback with increasing temperatures. When it gets warmer, the atmosphere can hold more water vapor, and since water vapor is a much stronger greenhouse gas than CO2, it gets warmer still. In reality, the opposite is true. With increased water vapor there will form clouds earlier and lasting longer, leading to a negative feedback that tends to keep temperatures more stable. More CO2 will aid in that stability. Granted, there is still increasing temperatures with increasing CO2, but instead of a gain of 2 to 3, which the models predict, there is an attenuation of about 2 to 3, so the real temperature rise is one ninth to a quarter of what the models predict.
But the models are useful for one thing: To create an urgency in people, so they will go along with Global Governance, or an unelected government taking control of the energy resources.
But even that is a side issue. The real issue is people control as expressed in Agenda 21. The world has about 7.1 billion people, and some have calculated that an ideal, sustainable world has room for only 700 million people, if enough areas are set aside for wildlife and nature preserves. After all, the animals were here first!
This attitude is expressed in a number of recent government advisers.JonathanGruber
The “architect” of Obamacare, Jonathan Gruber’s abortion advocacy is of a particularly pungent eugenics variety. He’s on record repeatedly making the case from social science that abortion is a “social good” because it reduces the number of “marginal children,” by which he means urban poor—those he says can be counted on to commit crimes if they were ever born.
The Presidential Science Advisor John Holdren has a plethora of population control suggestions:John_Holdren_official_portrait_small
Indeed, it has been concluded that compulsory population-control laws, even including laws requiring compulsory abortion, could be sustained under the existing Constitution if the population crisis became sufficiently severe to endanger the society.
One way to carry out this disapproval might be to insist that all illegitimate babies be put up for adoption—especially those born to minors, who generally are not capable of caring properly for a child alone. If a single mother really wished to keep her baby, she might be obliged to go through adoption proceedings and demonstrate her ability to support and care for it. Adoption proceedings probably should remain more difficult for single people than for married couples, in recognition of the relative difficulty of raising children alone. It would even be possible to require pregnant single women to marry or have abortions, perhaps as an alternative to placement for adoption, depending on the society.
On Involuntary fertility control :…
A program of sterilizing women after their second or third child, despite the relatively greater difficulty of the operation than vasectomy, might be easier to implement than trying to sterilize men.

The development of a long-term sterilizing capsule that could be implanted under the skin and removed when pregnancy is desired opens additional possibilities for coercive fertility control. The capsule could be implanted at puberty and might be removable, with official permission, for a limited number of births.
Toward a Planetary Regime:

Perhaps those agencies, combined with UNEP and the United Nations population agencies, might eventually be developed into a Planetary Regime—sort of an international superagency for population, resources, and environment. Such a comprehensive Planetary Regime could control the development, administration, conservation, and distribution of all natural resources, renewable or nonrenewable, at least insofar as international implications exist. Thus the Regime could have the power to control pollution not only in the atmosphere and oceans, but also in such freshwater bodies as rivers and lakes that cross international boundaries or that discharge into the oceans. The Regime might also be a logical central agency for regulating all international trade, perhaps including assistance from DCs to LDCs, and including all food on the international market.

The Planetary Regime might be given responsibility for determining the optimum population for the world and for each region and for arbitrating various countries’ shares within their regional limits. Control of population size might remain the responsibility of each government, but the Regime would have some power to enforce the agreed limits.
We will need to surrender national sovereignty to an armed international police force:
If this could be accomplished, security might be provided by an armed international organization, a global analogue of a police force. Many people have recognized this as a goal, but the way to reach it remains obscure in a world where factionalism seems, if anything, to be increasing. The first step necessarily involves partial surrender of sovereignty to an international organization.
This is more than enough to give a hint on what the Obama Administration meant by “Fundamental transformation
This is what happens when people start to serve “The Creature rather than the Creator” and that is “The Lie”.

The connection between “The sin” and “The lie”, represented by Muslims annihilating Christians, and progressives annihilating people is their hatred for the Cross. The Muslims deny Jesus Christ as redeemer by his substitutionary death on the cross, and the progressives deny the cross as redemption of mankind, substituting God with man as redeemer.

This explains the hatred of the cross. It is an offense and a stumbling block for the unbeliever.

Lennart Bilén, 2014

(1) Real temperature over time versus predicted by models.

CMIP5-73-models-vs-obs-20N-20S-MT-5-yr-means1

(2) Model cloud cover versus rality

Cloudmodels


(3) https://wattsupwiththat.com/2016/05/16/ocean-bacteria-are-programmed-to-alter-climate-gases/comment-page-1/#comment-2216450

China, the powerhouse of the world. Check the CO2 statistics.

The IMF numbers show China on track to produce $17.6 trillion worth of goods and services compared to the U.S.’s slated $17.4 trillion, based on a well-established and widely used economic measure known as purchasing-power parity (or PPP).
Meanwhile, in Lima, Peru, China offered new details on its commitment to rein in greenhouse gases and called on rich nations to speed up delivery of the $100 billion in annual climate-related aid they’ve promised by 2020. Su Wei, China’s lead climate negotiator, coupled his comments on China’s commitment with a call to accelerate funding for climate aid, shifting the pressure to industrialized nations, led by the U.S. and European Union, to do their part toward reaching an agreement next year. The “$10 billion is just one 10th of that objective,” and “we do not have any clear road map of meeting that target for 2020,” Su said. Climate aid is “a trust-building process,” he added.( –Alex Morales and Reed Landberg, Bloomberg, 5 December 2014)
Rich nations’ pledges of almost $10 billion to a green fund to help poor nations cope with global warming are “far from adequate,” particularly Australia’s lack of a donation, the head of China’s delegation at U.N. climate talks said on Thursday. Su Wei also urged all rich nations to deepen their planned cuts in greenhouse gas emissions, signaling that a joint Chinese-U.S. announcement of greenhouse gas curbs last month does not mean an end to deep differences on climate policy. (–Reuters, 5 December 2014)
Granted, rich nations produce more CO2 than poor nations, so how does China stack up in CO2 emissions?
Here are the stats for 2013:
China         10 GT of CO2 28% of world total
U.S.A           5                     14%
E.U.             3.6                   10%
India            2.5                     7%
Russia        2                         5%
Rest of world 13 GT           46% of world total.
By this account China is already a rich country and should be the first to share.
But it is getting worse.

Barack Obama and the Chinese negotiator agreed on a deal that U.S. would reduce its greenhouse gases by 24 to 28% by the year 2025 and China promised to try to halt its scheduled growth by the year 2030. E.U. have legislated similar reductions as the U.S.
So by 2030 we can look forward to a world CO2 emission balance like this:
China               30 GT of CO2, 45% of world total
U.S.A.                4                        7%
E.U                    3                         5%
India                  7.5                    11%
Russia              2                          3%
Rest of world 18                        28 % of world total.
This is what Barack Obama heralded as a major breakthrough!
He will allow China to become six times as powerful as the U.S.A in the next 15 years.
And we will help them by being part in transferring 100 Billion to developing countries (of which China is one) in the next 10 years.
If you doubt the numbers, consider this: China already consumes 45% of the world’s coal mining, mostly low grade, polluting lignite. The air quality in Beijing is so poor that a day that is merely unhealthy by our standards is considered a good day.
The climate conference in Lima, Peru, RIP.

[Update 1] Check out this memo from the White House!

Message: White House warning of extreme weather, Nov 19, 2014.
From: info@mail.whitehouse.gov
To: xxxx@xxxx.xxx
Subject: Make sure your community is ready for climate change
Date: Wed, 19 Nov 2014 11:51:17 -0600
The White House  

Make sure your community is ready for climate change

Climate change is happening now — and we’ve got to be ready because we’re going to see more extreme weather.
That’s why we’re taking action. Last Tuesday, the President made a historic announcement with China that sets new targets for carbon pollution reductions.
And on Monday, the Administration released the Climate Resilience Toolkit to help our communities respond to our changing climate.
Check out these easy-to-use tools, including interactive maps and visualizations, that will help prepare your community for the impacts of climate change. See how you can help your community or business get ready.

Whether you’re a small business owner, planner, farmer, policy leader, or an interested resident, these tools can help you make sure that you have a climate-ready community or business.

Have questions about what climate change means for you, why it matters, and what we can do to fight it? Last Thursday, Dr. John P. Holdren, Director of the White House Office of Science and Technology Policy, announced that he wants to answer your questions.

Ask Dr. Holdren your questions on Facebook, Twitter, Instagram, or Vine with the hashtag #AskDrH — and he’ll answer some of them on camera.


This email was sent to xxxx@xxx.xxx
Unsubscribe | Privacy Policy
Please do not reply to this email. Contact the White House
The White House • 1600 Pennsylvania Ave NW • Washington, DC 20500 •

People through the ages have always complained about two things. Life isn’t fair, and the weather. Obama has promised to fix both.

[Update 2] On the other hand:

China has rejected the scrutiny of efforts to limit carbon emissions, a key tool that the US says is necessary as more than 190 countries work to come up with a new deal to fight climate change. Chinese negotiators sought to delete provisions in a draft text that would have paved the way for other countries and non-governmental organizations to submit questions about its carbon-reduction plans, according to environmental groups that are official observers to the talks. –South China Morning Post, 8 December 2014

Obviously, China is not satisfied being only six times more powerful than the U.S. by the year 2030.

Twenty days in record territory for Antarctic sea-ice in 2014. Nine new absolute records set.

(Updated Oct 10antarctic_seaice_sept19-617x416)

The results are in. New absolute record for ice in Antarctica since measurements begun was set in 2012. It was then broken in 2013, and in 2014 there was nine new absolute records, twenty-one days in record territory, and so far this year 193 daily records set.  The Antarctic ice sheet is growing year by year. It is Climate Change, and it is getting colder. Last June was the coldest month ever recorded in Antarctica.  The CO2 content in air keeps setting new records, and so does the ice, the ice keeps growing. Time to reevaluate the climate models.

Here are the 44 days with most ice ever recorded, 28 are for 2014, 15 for 2013 and one for 2012:

Year      mo  day  million sq km   comment

2014,    09,  20,   20.14215, Ninth and final absolute 2014 record

2014,    09,  19,   20.12703, Eighth 2014 record of Antarctic sea-ice.  

2014,    09,  18,   20.11297, Seventh 2014 record of Antarctic sea-ice.

2014,    09,  21,   20.07814, 180th daily record for 2014

2014,    09,  22,   20.07057, 181th daily record for 2014

2014,    09,  17,   20.05401, Sixth 2014 record of Antarctic sea-ice.

2014,    09,  26,   20.02033, 185th daily record for 2014

2014,    09,  27,   20.01522,  186th daily record for 2014

2014,    09,  23,   19.98593, 182th daily record for 2014

2014,    09,  24,   19.95528, 183th daily record for 2014

2014,    09,  28,   19.94967, 187th daily record for 2014

2014,    09,  25,   19.94174, 184th daily record for 2014

2014,    09,  16,   19.91462, Fifth 2014 record of Antarctic sea-ice.

2014,    09,  29,   19.84111, 188th daily record for 2014

2014,    09,  15,   19.81363, Fourth 2014 record of Antarctic sea-ice.

2014,    09,  30,   19.77537, 189th daily record for 2014

2014,    09,  14,   19.75318, Third 2014 record of Antarctic sea-ice.

2014,    09,  13,   19.73444, Second 2014 record of Antarctic sea-ice.

2014,    09,  12,   19.62641, First 2014 record of Antarctic sea-ice.

2014,    10,  01,   19.61521, 190th daily record for 2014

2013,     10,    01,   19.60692,  2013 absolute record of Antarctic sea-ice

2014,  10,  03, 19.59896, 192nd daily record for 2014

2014,    10,  02,   19.58941, 191st daily record for 2014

2014,  10,  06,  19.58302, 195th daily record for 2014

2013,    09,  30,   19.57892, .

2013,    09,  28,   19.57295,

2013,    09,  21,   19.56010,

2013,    09,  14,   19.55145,

2014,    09,  11,   19.54671,  170th daily record for 2014

2013,    09,  20,   19.53172,

2013,    09,  27,   19.51465,

2014,  10, 05, 19.51126, 194th daily record for 2014
2014,  10, 04, 19.50934, 193rd daily record for 2014 
2013,  10, 02, 19.50719,
2014,  10, 07, 19.50703, 196th daily record for 2014 
2013,  09, 13, 19.50511,
2013,  09, 22, 19.50450,
2013,  09, 29, 19.50390,
2013,  09, 18, 19.50078, 
2013,  09, 17, 19.49298,
2014,  09, 10, 19.48881, 169th daily record for 2014
2013,  09, 19, 19.48110,
2013,  10, 03, 19.48012,
2012,  09, 22, 19.47713, 2012 absolute record of Antarctic sea-ice.

Source: ftp://sidads.colorado.edu/DATASETS/NOAA/G02135/south/daily/data/

antarctic_sea_ice_extent_2014_day_276_1981-2010

Nineteen days in absolute record territory and 190th daily record for ice in Antarctica!

The results are in. New absolute record for ice in Antarctica since measurements begun was set in 2012. It was then broken in 2013, and in 2014 there was nine new absolute records, nineteen days in record territory and so far this year 190 daily records set.  The Antarctic ice sheet is growing year by year. It is Climate Change, and it is getting colder. Last June was the coldest month ever recorded in Antarctica.  The CO2 content keeps rising, the ice keeps growing. Time to reevaluate the climate models.

Here are the 35 iciest days recorded:

2014,    09,  20,   20.14215, Ninth and final absolute 2014 record

2014,    09,  19,   20.12703, Eighth 2014 record of Antarctic sea-ice.  

2014,    09,  18,   20.11297, Seventh 2014 record of Antarctic sea-ice.

2014,    09,  21,   20.07814, 180th daily record for 2014

2014,    09,  22,   20.07057, 181th daily record for 2014

2014,    09,  17,   20.05401, Sixth 2014 record of Antarctic sea-ice.

2014,    09,  26,   20.02033, 185th daily record for 2014

2014,    09,  27,   20.01522,  186th daily record for 2014

2014,    09,  23,   19.98593, 182th daily record for 2014

2014,    09,  24,   19.95473, 183th daily record for 2014

2014,    09,  28,   19.94967, 187th daily record for 2014

2014,    09,  25,   19.94174, 184th daily record for 2014

2014,    09,  16,   19.91462, Fifth 2014 record of Antarctic sea-ice.

2014,    09,  29,   19.84111, 188th daily record for 2014

2014,    09,  15,   19.81305, Fourth 2014 record of Antarctic sea-ice.

2014,    09,  30,   19.77537, 189th daily record for 2014

2014,    09,  14,   19.75260, Third 2014 record of Antarctic sea-ice.

2014,    09,  13,   19.73444, Second 2014 record of Antarctic sea-ice.

2014,    09,  12,   19.62641, First 2014 record of Antarctic sea-ice.

2014,    10,  01,   19.61080, 190th daily record for 2014

2013,    09,  30,   19.57892, 2013 absolute record of Antarctic sea-ice.

2013,    09,  28,   19.57295,

2013,    10,  01,   19.57088,

2013,    09,  21,   19.56010,

2013,    09,  14,   19.55145, 2014,    09,  11,   19.54671,

2013,    09,  20,   19.53172,

2013,    09,  27,   19.51465,

2013,    09,  13,   19.50511,

2013,    09,  22,   19.50450,

2013,    09,  29,   19.50390,

2013,    09,  18,   19.50078,

2013,    09,  17,   19.49298, 2014,    09,  10,   19.48881,

2013,    09,  19,   19.48110,

2012,    09,  22,   19.47713,  2012 absolute record of Antarctic sea-ice.

Source: ftp://sidads.colorado.edu/DATASETS/NOAA/G02135/south/daily/data/

antarctic_sea_ice_extent_2014_day_273_1981-2010

This August was the warmest on record, so says NASA. Or was it the 9th warmest?

On September 15 a news release was issued by NASA and confirmed by NOAA that August was the warmest August on record.

I tried to look into the data  and found the source was a preliminary result of sea surface temperatures for August, which looked ominous indeed

On Sep 9  NOAA issued the following report:

http://www.reportingclimatescience.com/news-stories/article/noaa-august-2014-was-the-warmest-august-on-record.htm

It showed how the data was taken that led to the sudden rise in global temperatures.

We can clearly see the warmer and colder areas, with the read areas (warmer) totally dominating  the blue (colder) areas.

However, in this data set, the temperatures in the polar regions are not included, hence conclusions are drawn from incomplete data.

When these areas are included August 2014 was not the warmest August on record, It wad the ninth warmest August and the 89th warmest month on record.

These ate the tabulated data from NASA.

 GLOBAL Temperature Anomalies in 0.01 degrees Celsius    base period: 1951-1980

                  sources: GHCN-v3 1981-08/2014 (meteorological stations only)
                    using elimination of outliers and homogeneity adjustment
                    Notes: 1941 DJF = Dec 1940 - Feb 1941 ;  ***** = missing

                                                                     AnnMean


Year   Jan  Feb  Mar  Apr  May  Jun  Jul  Aug  Sep  Oct  Nov  Dec    J-D D-N    DJF  MAM  JJA  SON  Year
1981    61   58   68   50   32   39   51   52   28   10   22   48     43  41     46   50   47   20  1981
1982    12   25   -2    3   25    5   20    9    9    2   11   40     13  14     28    9   11    8  1982
1983    51   40   46   40   48   28   21   49   57   31   32   17     38  40     44   45   33   40  1983
1984    25   16   38   17   48    5   19   27   26   22   10    4     21  22     19   34   17   20  1984
1985    32    6   26   18   23   28    7   36   26   16    9   16     20  19     14   22   24   17  1985
1986    39   50   38   41   31   16   15   21    2   12   12   20     25  24     35   37   17    9  1986
1987    43   54   24   39   30   55   59   25   35   35   31   57     41  37     39   31   46   34  1987
1988    67   49   57   50   63   60   45   56   56   53   15   36     51  52     58   57   54   41  1988
1989    27   44   47   42   22   18   47   50   53   43   21   36     38  38     36   37   38   39  1989
1990    51   42   86   62   52   46   64   43   30   53   52   47     52  51     43   67   51   45  1990
1991    49   61   48   72   42   70   63   57   61   33   31   33     52  53     52   54   63   42  1991
1992    50   40   53   26   27   30    8   13   -6    7    1   24     23  24     41   35   17    1  1992
1993    39   41   34   30   28   26   39   22   10   22    8   21     27  27     35   31   29   13  1993
1994    40    8   27   53   27   57   38   24   45   41   49   43     38  36     23   36   40   45  1994
1995    56   89   51   58   38   50   64   58   45   67   52   40     56  56     63   49   57   54  1995
1996    42   60   46   48   35   35   53   77   40   32   49   52     47  46     47   43   55   40  1996
1997    49   55   66   39   44   66   34   44   49   60   69   68     54  52     52   50   48   59  1997
1998    71  118   84   83   95  104   91   86   61   66   65   81     84  83     86   87   93   64  1998
1999    69   86   48   43   51   63   64   54   63   62   57   53     59  62     79   47   60   61  1999
2000    32   79   70   76   56   67   63   60   58   34   49   47     58  58     55   67   63   47  2000

Year   Jan  Feb  Mar  Apr  May  Jun  Jul  Aug  Sep  Oct  Nov  Dec    J-D D-N    DJF  MAM  JJA  SON  Year
2001    59   63   70   62   74   66   71   64   70   60   85   72     68  66     57   69   67   72  2001
2002    96   91  113   81   85   65   82   67   82   64   69   53     79  80     86   93   71   71  2002
2003    90   74   71   69   87   64   64   87   81   88   65   85     77  74     72   76   72   78  2003
2004    71   92   87   76   49   64   24   59   60   80   87   66     68  69     83   70   49   76  2004
2005    96   88   93   85   76   82   80   75   98  101   90   90     88  86     84   84   79   96  2005
2006    77   92   81   68   52   77   67   82   73   84   86   92     78  77     86   67   75   81  2006
2007   124   93   92   95   94   67   79   87   84   81   70   71     86  88    103   94   78   78  2007
2008    49   46   90   66   58   53   71   41   82   75   81   76     66  65     56   71   55   79  2008
2009    76   77   67   76   80   83   86   86   92   73   85   76     80  80     76   74   85   83  2009
2010    95  106  114  101   97   88   75   84   88   96  103   72     93  94     92  104   82   96  2010
2011    73   67   78   84   65   72   91   96   79   83   75   78     78  78     70   75   87   79  2011
2012    60   56   70   80   95   70   57   85   88   95   94   70     77  77     65   81   71   92  2012
2013    97   76   86   65   70   89   67   80  101   86   87   84     82  81     81   74   79   91  2013
2014    95   63   75   90  103   78   74   80 **** **** **** ****   **** ***     80   89   78 ****  2014
Year   Jan  Feb  Mar  Apr  May  Jun  Jul  Aug  Sep  Oct  Nov  Dec    J-D D-N    DJF  MAM  JJA  SON  Year
       
Divide by 100 to get changes in degrees Celsius (deg-C).
Multiply that result by 1.8(=9/5) to get changes in degrees Fahrenheit (deg-F).

Best estimate for absolute global mean for 1951-1980 is  14.0 deg-C or 57.2 deg-F,
so add that to the temperature change if you want to use an absolute scale
(this note applies to global annual means only, J-D and D-N !)

Example      --      Table Value :      40
                          change :    0.40 deg-C  or  0.72 deg-F
abs. scale if global annual mean :   14.40 deg-C  or 57.92 deg-F


The September 15 release was done by the political arm of NASA, and was timed for maximum impact on the United Nations Climate Summit one week later. 
The final Aug Data was never taken into consideration even though it was available. 
They did not want to release it was the ninth warmest August ever.
For good measure NOAA released it was the warmest summer ever. In reality it was maybe the seventh warmest summer ever.

Do NASA and NOAA lie wilfully? No, they just want to release selected data in such a way as to safeguard future funding.

On September 23 or so President Obama will address the United Nations' Climate Summit and proclaim "This August was the warmest August ever" or words to that effect, pointing to the NOAA and NASA press releases.

Ninth day in a row for absolute ice records in Antarctica!!

The Antarctic sea ice now covers an area that is larger than United States and Canada put together, or more than twice the size of Europe..

S_bm_extent_hires (2)

Another way to look at the ice cover size is, if the landmass of Antarctica is included, the ice cover is larger than Asia.

The amount of ice over last years absolute record is about the same in area as the sum of the areas of Germany, Denmark, Netherlands, Switzerland and Austria put together.

Notice the ice extent goes all the way up to the 55th latitude, where a change in the albedo from the ice has a strong cooling effect since a large fraction of the sunlight gets reflected and not absorbed. At the 55th latitude the sun is now 35 degrees above the horizon. The sun in the Arctic by contrast is now only 10 degrees above the horizon at the 80th latitude, so the effect of the Arctic ice is much less important.

This will probably not be mentioned at the United Nations’ Summit on Climate Change September 23 in N.Y. Instead President Obama will say something like “warmest August on record”, referring to a press release from NASA, confirmed by NOAA. These were preliminary figures excluding the polar regions, but when the polar regions are included, according to NASA’s own data https://lenbilen.com/2014/09/21/this-august-was-the-warmest-on-record-so-says-nasa-or-was-it-the-9th-warmest/ it was the eighth warmest August, and the 89th warmest month overall.

This highlights the importance of the polar regions to be included when calculating the earth’s temperature and energy balance.

Here are the 30 highest values in square kilometers since satellite records begun.


2014,    09,  20,   20.14215,   Absolute record since satellite monitoring begun

2014,    09,  19,   20.12703,   Record 2 days ago 

2014,    09,  18,   20.11297,   Record 3 days ago

2014,    09,  17,   20.05201,  Record 4 days ago   

2014,    09,  16,   19.91462,   Record 5 days ago

2014,    09,  15,   19.81305,   Record 6 days ago

2014,    09,  14,   19.75260,  Record 7 days ago

2014,    09,  13,   19.73444,  Record 8 days ago

2014,    09,  12,   19.62641,   Record 9 days ago

2013,    09,  30,   19.57892,        2013 final absolute record

2013,    09,  28,   19.57295,         2013 record

2013,    10,  01,   19.57088,

2013,    09,  21,   19.56010,        2013 record

2013,    09,  14,   19.55145,         2013 record

2014,    09,  11,   19.54671,

2013,    09,  20,   19.53172,

2013,    09,  27,   19.51465,

2013,    09,  13,   19.50511,         2013 record

2013,    09,  22,   19.50450,

2013,    09,  29,   19.50390,

2013,    09,  18,   19.50078,

2013,    09,  17,   19.49298,

2014,    09,  10,   19.48881,

2013,    09,  19,   19.48110,

2012,    09,  22,   19.47713,       2012 new absolute record

2012,    09,  25,   19.47159,

2013,    09,  16,   19.47074,

2013,    10,  02,   19.46862,

2012,    09,  26,   19.47649,

Source: ftp://sidads.colorado.edu/DATASETS/NOAA/G02135/south/daily/data/

antarctic_sea_ice_extent_zoomed_2014_day_263_1981-2010

Eighth day in a row for absolute ice records in Antarctica!!

Eighth day in a row for absolute ice records in Antarctica!!

The Antarctic sea ice now covers an area that is larger than United States and Canada combined, or more than twice the size of Europe..S_bm_extent_hires (2)

Another way to look at the ice cover size is, if the landmass of Antarctica is included, the ice cover is larger than Asia.

The amount of ice over last years absolute record is larger in area than the country of Spain.

Notice the ice extent goes all the way up to the 55th latitude, where a change in the albedo from the ice has a substantial cooling effect since a large portion of the sunlight gets reflected rather than absorbed. At the 55th latitude the sun is now 35 degrees above the horizon. The sun in the Arctic by contrast is now only 10 degrees above the horizon at the 80th latitude, so the effect of the Arctic ice is much less important.

This will probably not be mentioned at the United Nations’ Summit on Climate Change September 23 in N.Y. Instead President Obama will say something like “warmest August on record”, referencing a press release from NASA, confirmed by NOAA. These were preliminary figures excluding the polar regions, but when they are included, according to NASA’s own data http://data.giss.nasa.gov/gistemp/tabledata_v3/GLB.Ts.txt  it was the eighth warmest August, and the 89th warmest month overall.

This highlights the importance of the polar regions to be included when calculating the earth’s temperature and energy balance.

Here are the 30 highest values in square kilometers since satellite records begun.


2014,    09,  19,   20.12703,   Absolute record since satellite monitoring begun

2014,    09,  18,   20.11297,   Record 2 days ago

2014,    09,  17,   20.05201,  Record 3 days ago   

2014,    09,  16,   19.91462,   Record 4 days ago

2014,    09,  15,   19.81305,   Record 5 days ago

2014,    09,  14,   19.75260,  Record 6 days ago

2014,    09,  13,   19.73444,  Record 7 days ago

2014,    09,  12,   19.62641,   Record 8 days ago

2013,    09,  30,   19.57892,        2013 final absolute record

2013,    09,  28,   19.57295,         2013 record

2013,    10,  01,   19.57088,

2013,    09,  21,   19.56010,        2013 record

2013,    09,  14,   19.55145,         2013 record

2014,    09,  11,   19.54671,

2013,    09,  20,   19.53172,

2013,    09,  27,   19.51465,

2013,    09,  13,   19.50511,         2013 record

2013,    09,  22,   19.50450,

2013,    09,  29,   19.50390,

2013,    09,  18,   19.50078,

2013,    09,  17,   19.49298,

2014,    09,  10,   19.48881,

2013,    09,  19,   19.48110,

2012,    09,  22,   19.47713,       2012 new absolute record

2012,    09,  25,   19.47159,

2013,    09,  16,   19.47074,

2013,    10,  02,   19.46862,

2012,    09,  26,   19.47649,

2013,    09,  26,   19.46622,

Source: ftp://sidads.colorado.edu/DATASETS/NOAA/G02135/south/daily/data/

antarctic_sea_ice_extent_zoomed_2014_day_262_1981-20101

Seventh day in a row for absolute ice records in Antarctica!!

The Antarctic sea ice now covers an area that is larger than United States and Canada combined, or more than twice the size of Europe..S_bm_extent_hires (2)

Another way to look at the ice cover size is, if the landmass of Antarctica is included, the ice cover is larger than Asia.

The amount of ice over last years absolute record is larger in area than the country of Spain.

Notice the ice extent goes all the way up to the 55th latitude, where a change in the albedo from the ice has a substantial cooling effect since a large portion of the sunlight gets reflected rather than absorbed. At the 55th latitude the sun is now 35 degrees above the horizon. The sun in the Arctic by contrast is now only 10 degrees above the horizon at the 80th latitude, so the effect of the Arctic ice is much less important.

One wonder is this going to be mentioned at the United Nations’ Summit on Climate Change September 23 in N.Y.?

The Climate Summit September 23 in N.Y. is expected to gather 125 heads of State or heads of Government.

Notably absent will be Aussie PM Tony Abbott representing 1.12% of the world’s CO2 emissions, Chinese President Xi Jinping with 24.65%, Indian Prime Minister Narendra Modi with 6%, Canadian Prime Minister Stephen Harper with 1.48%, German Chancellor Angela Merkel with 3% and Russian President Vladimir Putin with 5.18%.

The absences represent about 43% of the world’s CO2 emissions. Of course, when it comes to real pollution, nobody beats China. A good day in Beijing would be an air alert in the U.S.

Here are the  30 highest daily values for sea-ice in millions of square Kilometers.

2014,    09,  18,   20.11297,   Absolute record since satellite monitoring begun

2014,    09,  17,   20.05201,  Yesterday’s Record   

2014,    09,  16,   19.91462,   Record 2 days ago

2014,    09,  15,   19.81305,   Record 3 days ago

2014,    09,  14,   19.75260,  Record 4 days ago

2014,    09,  13,   19.73444,  Record 5 days ago

2014,    09,  12,   19.62641,   Record 6 days ago

2013,    09,  30,   19.57892,        2013 final absolute record

2013,    09,  28,   19.57295,         2013 record

2013,    10,  01,   19.57088,

2013,    09,  21,   19.56010,        2013 record

2013,    09,  14,   19.55145,         2013 record

2014,    09,  11,   19.54671,

2013,    09,  20,   19.53172,

2013,    09,  27,   19.51465,

2013,    09,  13,   19.50511,         2013 record

2013,    09,  22,   19.50450,

2013,    09,  29,   19.50390,

2013,    09,  18,   19.50078,

2013,    09,  17,   19.49298,

2014,    09,  10,   19.48881,

2013,    09,  19,   19.48110,

2012,    09,  22,   19.47713,       2012 new absolute record

2012,    09,  25,   19.47159,

2013,    09,  16,   19.47074,

2013,    10,  02,   19.46862,

2012,    09,  26,   19.47649,

2013,    09,  26,   19.46622,

2012,    09,  24,   19.46327,

Source: ftp://sidads.colorado.edu/DATASETS/NOAA/G02135/south/daily/data/

antarctic_sea_ice_extent_zoomed_2014_day_261_1981-2010

Antarctic sea-ice keeps growing and growing, now over 20 million square Kilometers!!. New absolute records set six days in a row.

The Antarctic sea ice now covers an area that is larger than United States and Canada combined. The amount of ice over last years absolute record is larger in area than the country of Sweden.

One wonder if this is going to be mentioned at the United Nations’ Summit on Climate Change September 23 in N.Y.

The Climate Summit September 23 in N.Y. is expected to gather 125 heads of State or heads of Government.

Notably absent will be Aussie PM Tony Abbott representing 1.12% of the world’s CO2 emissions, Chinese President Xi Jinping with 24.65%, Indian Prime Minister Narendra Modi with 6%, Canadian Prime Minister Stephen Harper with 1.48%, German Chancellor Angela Merkel with 3% and Russian President Vladimir Putin with 5.18%.

The absences represent about 43% of the world’s CO2 emissions. Of course, when it comes to real pollution, nobody beats China. A good day in Beijing would be an air alert in the U.S.

Here are the  30 highest daily values for sea-ice in millions of square Kilometers.

2014,    09,  17,   20.05401,  Absolute record since satellite monitoring begun

2014,    09,  16,   19.91462,   Yesterdays Record

2014,    09,  15,   19.81305,   Record 2 days ago

2014,    09,  14,   19.75260,  Record 3days ago

2014,    09,  13,   19.73444,  Record 4 days ago

2014,    09,  12,   19.62641,   Record 5 days ago

2013,    09,  30,   19.57892,        2013 final absolute record

2013,    09,  28,   19.57295,         2013 record

2013,    10,  01,   19.57088,

2013,    09,  21,   19.56010,        2013 record

2013,    09,  14,   19.55145,         2013 record

2014,    09,  11,   19.54671,

2013,    09,  20,   19.53172,

2013,    09,  27,   19.51465,

2013,    09,  13,   19.50511,         2013 record

2013,    09,  22,   19.50450,

2013,    09,  29,   19.50390,

2013,    09,  18,   19.50078,

2013,    09,  17,   19.49298,

2014,    09,  10,   19.48881,

2013,    09,  19,   19.48110,

2012,    09,  22,   19.47713,       2012 new absolute record

2012,    09,  25,   19.47159,

2013,    09,  16,   19.47074,

2013,    10,  02,   19.46862,

2012,    09,  26,   19.47649,

2013,    09,  26,   19.46622,

2012,    09,  24,   19.46327,

2012,    09,  23,   19.45940,

antarctic_sea_ice_extent_zoomed_2014_day_260_1981-2010

For the Climate Summit! Fifth Day in a row for new all time record of sea-ice in the Antarctic!

The Antarctic sea ice now covers an area that is larger than United States and Canada combined. The amount of ice over last years record is larger than the country of Finland.

One wonder if this is even going to be mentioned at the United Nations’ Summit on Climate Change September 23 in N.Y.

The Climate Summit September 23 in N.Y. is expected to gather more than 120 heads of state.

Notably absent will be Aussie PM Tony Abbott representing 1.12% of the world’s CO2 emissions, Chinese President Xi Jinping with 24.65%, Indian Prime Minister Narendra Modi with 6%, Canadian Prime Minister Stephen Harper with 1.48%, German Chancellor Angela Merkel with 3% and Russian President Vladimir Putin with 5.18%.

The absences represent about 43% of the world’s CO2 emissions. Of course, when it comes to real pollution, nobody beats China. A good day in Beijing would be an air alert in the U.S.

Here are the  30 highest daily values for sea-ice in millions of square Kilometers.

2014,    09,  16,   19.91462,  New absolute record

2014,    09,  15,   19.81305,  Yesterday’s record

2014,    09,  14,   19.75260,  Record 2 days ago

2014,    09,  13,   19.73444,  Record 3 days ago

2014,    09,  12,   19.62641,   Record 4 days ago

2013,    09,  30,   19.57892,        2013 final absolute record

2013,    09,  28,   19.57295,         2013 record

2013,    10,  01,   19.57088,

2013,    09,  21,   19.56010,        2013 record

2013,    09,  14,   19.55145,         2013 record

2014,    09,  11,   19.54671,

2013,    09,  20,   19.53172,

2013,    09,  27,   19.51465,

2013,    09,  13,   19.50511,         2013 record

2013,    09,  22,   19.50450,

2013,    09,  29,   19.50390,

2013,    09,  18,   19.50078,

2013,    09,  17,   19.49298,

2014,    09,  10,   19.48881,

2013,    09,  19,   19.48110,

2012,    09,  22,   19.47713,       2012 new absolute record

2012,    09,  25,   19.47159,

2013,    09,  16,   19.47074,

2013,    10,  02,   19.46862,

2012,    09,  26,   19.47649,

2013,    09,  26,   19.46622,

2012,    09,  24,   19.46327,

2012,    09,  23,   19.45940,

2014,    09,  09,   19.45600,

2013,    09,  24,   19.44938,

antarctic_sea_ice_extent_zoomed_2014_day_259_1981-2010