The East Palestine train derailment. The real content of the derailed tank cars, a brief pollution history and a Limerick.

A TRAIN-WRECK in EAST PALESTINE.
no agency came to the scene.
NO DISASTER RELIEF.
THERE’S NO NEED TO DEBRIEF.
“THEY VOTED FOR TRUMP: that’s obscene.”

According to Pete Buttijieg the secretary of transportation there are a thousand train derailments every year, so he can’t be bothered with such minor incidents. The United States has an aging infrastructure, The so called “Inflation Reduction Act” concentrated on green technology such as solar panels, bought from China and wind turbines from China and Western Europe rather than real infrastructure and cleaning up the waterways and modernize the air traffic system. No, they concentrated on social equity, gender equity and other pet projects.

But here is the kicker: It used to be much worse as pollution is concerned. The difference is that now there are so many carcinogenic and unhealthy chemicals rather than spilled oil and soot.

In 1868, 1883, 1887, 1912, 1922, 1936, 1941, 1948 and 1952 the Cuyahoga River in Cleveland, Ohio caught fire. Here is a picture of the 1948 fire.

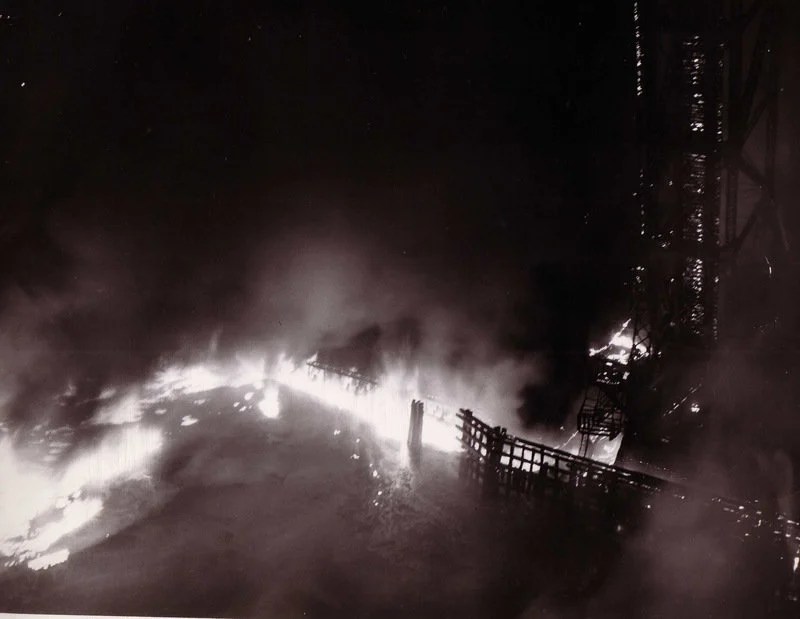
( Cleveland Press Collection, Cleveland State University Library)

The river caught fire a few more times, but nobody cared until 1969, the last time it happened. I remember in 1965 hearing thee song ‘Pollution’ by Tom Lehrer

In the second World War the oil refineries dumped the unwanted products from the refining process in the Delaware River, and things got so bad it stripped the protective paint from the hulls of ships coming in to the Philadelphia harbor.

We tend to forget how bad things were before there were any substantial environmental regulations. Factories solved their exhaust problems by building higher chimneys, spreading the poison over a larger area.

The content of the derailed tank cars.

There were five tank cars in the derailed part containing Vinyl Chloride. Vinyl Chloride is a gas, stored under pressure ( 3,5 atmospheres at room temperature). When the cars derailed, there was fire from burning and Norfolk Southern were afraid the cars would overheat and explode, so they drained them and dumped the vinyl chloride in a trench and set fire to it rather than hosing down the cars with water to lower the temperature. Vinyl Chloride when burning produces hydrochloride and carbon monoxide. Combined with water vapor it produces hydrochloric acid, which causes instant emphysema among other things. In addition it is a known carcinogen.

There was just one problem. The tank cars were mislabeled. Thy did not contain vinyl chloride, they contained 1,1-Dichloroethene, commonly called vinylidene chloride. Vinyl Chloride is bad, vinylidene chloride is far worse. The health effects from exposure to 1,1-DCE on fish, animals and people are primarily on the central nervous system, including symptoms of sedation, inebriation, convulsions, spasms, and unconsciousness at high concentrations. When the dug trench containing the drained volatile liquid was deliberately set on fire, who knows what substances that generated. The gas is a potent oxidant and a class 2B carcinogen.

One tank car contained Ethylene Glycol Mono-butane Ether. It is a known health hazard but not a carcinogen as far as I know.

One car contained Ethylhexyl, Acrylate and the tank was breached and the content spilled. There should be no particular health hazard from this tank car.

One car contains Isobutylene, a flammable gas. Most of it is still in than car.

One tank car contained ButylAcrylate and al its content was spilled on the ground. It is now being leached into the soil and has now been detected in the Ohio river just upstream from Cincinnati. It is not particularly toxic in the small concentration moving down the Ohio River, but yet.

And there was to tank cars containing benzene, a known carcinogen, but none of the benzene has leaked out.

The question is:What are the long term effects of this major spill and fire? Time will tell. It sometimes takes decades for cancer and respiratory diseases to develop.

Oh, and by the way, it is simpler, safer, much cheaper and more efficient to use pipelines. With a thousand derailments a year it is a wonder these types of catastrophes do not disrupt the supply chain more than they do.

The need to develop Thorium based Nuclear Energy as the major electric energy supply. 5. Radioactive waste from an LFTR decays down to background radiation in 300 years compared to a million years for U-235 based reactors.

 Radioactive waste from an LFTR (Liquid Fluoride Thorium Reactor)  decays down to background radiation in 300 years instead of a million years for U-235 based reactors. Initially LFTRs produce as much radioactivity as an U-235 based nuclear reactor, since fission converts mass to heat, but the decay products have a much shorter half-life. See the figure below.

Democrat campaign bus dumps a load. A Limerick.

hillary-campaign-bus-2

The “Forward Together” bus passing through Lawrenceville, Georgia, dumping human waste in a storm drain (Credit: Mike Robins)

They dumped all their poop down the drain

A Hazmat team called, but in vain

Team “forward together”

did reek. Not too clever.

Disgusting. Do they have a brain?

So much for the Democrats concern for the environment.

Concrete evidence China has cemented its position as world leader.

We now have concrete evidence China has cemented its position as world leader!

World cement production_2This simple pie chart shows China’s cement production is eight times larger than India’s and 30 times larger than United States’.

Stating it another way China has produced more cement in the last 3 years than United States has produced in the last 100 years!

I also realize India is building its infrastructure as fast as they can, and we are not.

Which country is fourth in cement production?
If you guessed Iran, you are right.  Iran’s cement production is about 5% less than U.S. They are building bunkers.

What is China doing with all its cement?

SouthChinaclaimFor one thing they are building artificial islands in the South China Sea. Their goal is to annex the whole South China Sea.

ArtificialIslands


But that is not all. They are also building ghost towns in areas where nobody lives.

china1china3china4


This is the Chinese model. Growing 7 to 10% per year, financing major construction projects. This is a pre-war mentality.

Cement production is also a very energy intensive process. For those worried about CO2, cement production is responsible for about 5% of all CO2 emissions in the world, more than half of it from China.

China also burns half of the world’s coal, and do it with marginal scrubbing releasing soot in the atmosphere causing the air in Beijing to be hazardous about 150 days per year.

china-bad-pollution-climate-change-7__880
A woman wearing a mask walk through a street covered by dense smog in Harbin, northern China, Monday, Oct. 21, 2013. Visibility shrank to less than half a football field and small-particle pollution soared to a record 40 times higher than an international safety standard in one northern Chinese city as the region entered its high-smog season. (AP Photo/Kyodo News) JAPAN OUT, MANDATORY CREDIT

This brown cloud goes out in the Pacific Ocean, then up in the Arctic, settling on the snow and ice, causing the show and ice to have a faster spring ans summer melt.

chinapollutioncloud


This is at least partly why the Arctic ice is shrinking while the Antarctic ice is growing.

217380main_May9_fires_label_500

This chart was made in 2003. Since then Chinese cement production has tripled. Notice the southern hemisphere is by comparison pollution free.  The CO2 levels are the same for the northern and southern hemisphere, but the temperature trends over the poles go in opposite direction.

ftp://ftp.ssmi.com/msu/graphics/tlt/plots/rss_ts_channel_tlt_southern%20polar_land_and_sea_v03_3.png


For the Climate Summit! Fifth Day in a row for new all time record of sea-ice in the Antarctic!

The Antarctic sea ice now covers an area that is larger than United States and Canada combined. The amount of ice over last years record is larger than the country of Finland.

One wonder if this is even going to be mentioned at the United Nations’ Summit on Climate Change September 23 in N.Y.

The Climate Summit September 23 in N.Y. is expected to gather more than 120 heads of state.

Notably absent will be Aussie PM Tony Abbott representing 1.12% of the world’s CO2 emissions, Chinese President Xi Jinping with 24.65%, Indian Prime Minister Narendra Modi with 6%, Canadian Prime Minister Stephen Harper with 1.48%, German Chancellor Angela Merkel with 3% and Russian President Vladimir Putin with 5.18%.

The absences represent about 43% of the world’s CO2 emissions. Of course, when it comes to real pollution, nobody beats China. A good day in Beijing would be an air alert in the U.S.

Here are the  30 highest daily values for sea-ice in millions of square Kilometers.

2014,    09,  16,   19.91462,  New absolute record

2014,    09,  15,   19.81305,  Yesterday’s record

2014,    09,  14,   19.75260,  Record 2 days ago

2014,    09,  13,   19.73444,  Record 3 days ago

2014,    09,  12,   19.62641,   Record 4 days ago

2013,    09,  30,   19.57892,        2013 final absolute record

2013,    09,  28,   19.57295,         2013 record

2013,    10,  01,   19.57088,

2013,    09,  21,   19.56010,        2013 record

2013,    09,  14,   19.55145,         2013 record

2014,    09,  11,   19.54671,

2013,    09,  20,   19.53172,

2013,    09,  27,   19.51465,

2013,    09,  13,   19.50511,         2013 record

2013,    09,  22,   19.50450,

2013,    09,  29,   19.50390,

2013,    09,  18,   19.50078,

2013,    09,  17,   19.49298,

2014,    09,  10,   19.48881,

2013,    09,  19,   19.48110,

2012,    09,  22,   19.47713,       2012 new absolute record

2012,    09,  25,   19.47159,

2013,    09,  16,   19.47074,

2013,    10,  02,   19.46862,

2012,    09,  26,   19.47649,

2013,    09,  26,   19.46622,

2012,    09,  24,   19.46327,

2012,    09,  23,   19.45940,

2014,    09,  09,   19.45600,

2013,    09,  24,   19.44938,

antarctic_sea_ice_extent_zoomed_2014_day_259_1981-2010