Coal 2023. The US consumption is 5% of world total, China’s share is more than 11 times larger. Who are we kidding on the “climate crisis?”

The following content is sponsored by Range ETFs

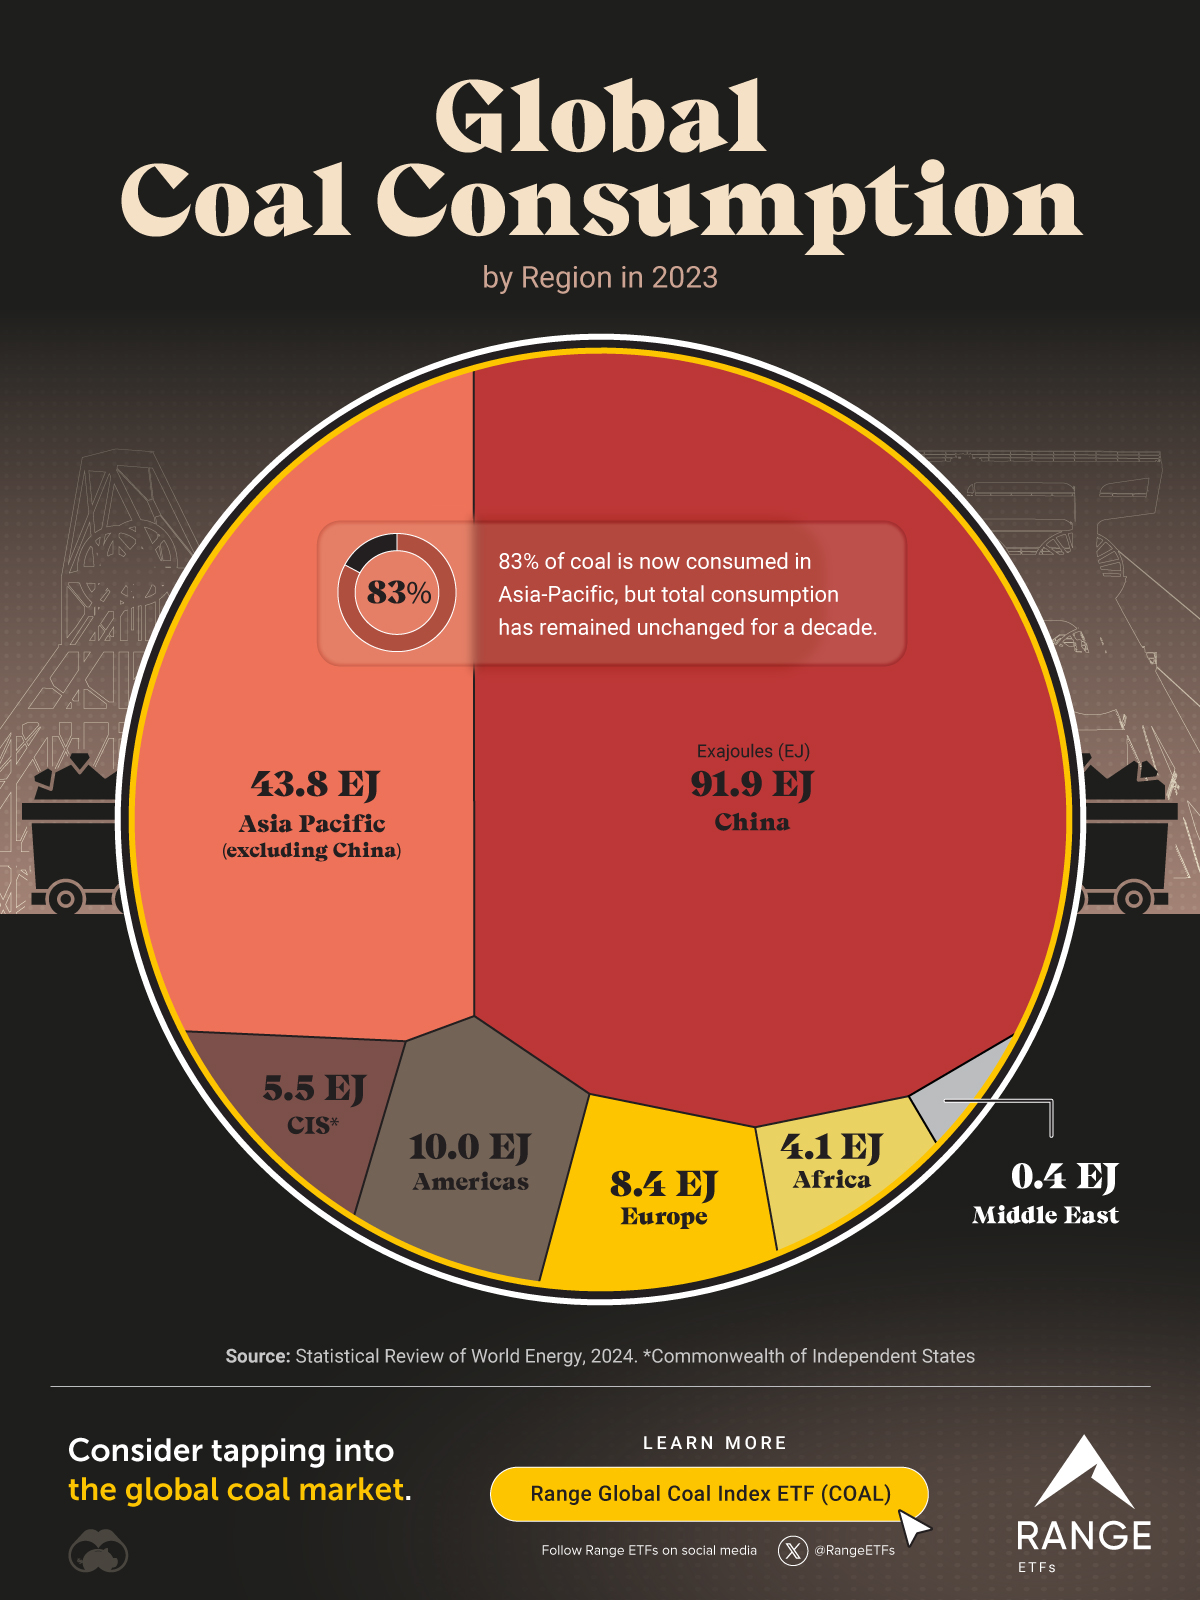
World Coal Consumption by Region in 2023

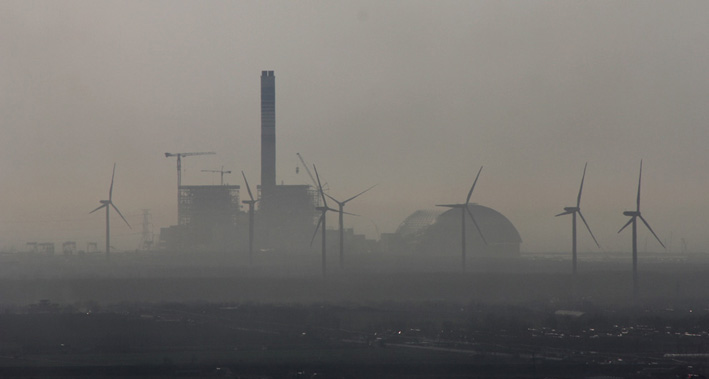
Despite many nations transitioning away from fossil fuels, in 2023, world coal consumption reached a staggering 164 exajoules (EJ) of energy, a record high for any year.

For this graphic, Visual Capitalist has partnered with Range ETFs to explore the role coal plays in the global energy mix and determine which regions still consume large quantities of coal.

The Role of Coal in Global Energy

Coal is a significant player in the global energy mix, contributing 26% of the world’s energy in 2023, more than all non-fossil fuel sources combined. The only energy source that contributed more to the global energy mix was oil.

Here’s how that consumption breaks down by region:

RegionConsumption (1018 joules)Share %
China91.956.1%
Asia Pacific (excluding China)43.826.7%
Americas
10.06.1%
Europe8.45.1%
CIS*5.53.4%
Africa4.12.5%
Middle East0.40.2%
Total164.0100%

Coal consumption has decreased in many regions. For example, both North America and Europe reduced their energy consumption from coal by 16% in 2023. However, a heavy reliance on coal in the Asia Pacific region has led to global coal consumption remaining essentially the same over the past 10 years.

When I saw this statistics I immediately looked up: What is the U.S role in global coal consumption and found out it was 8.2 EJ om 2023 or 5.0% of world consumption.

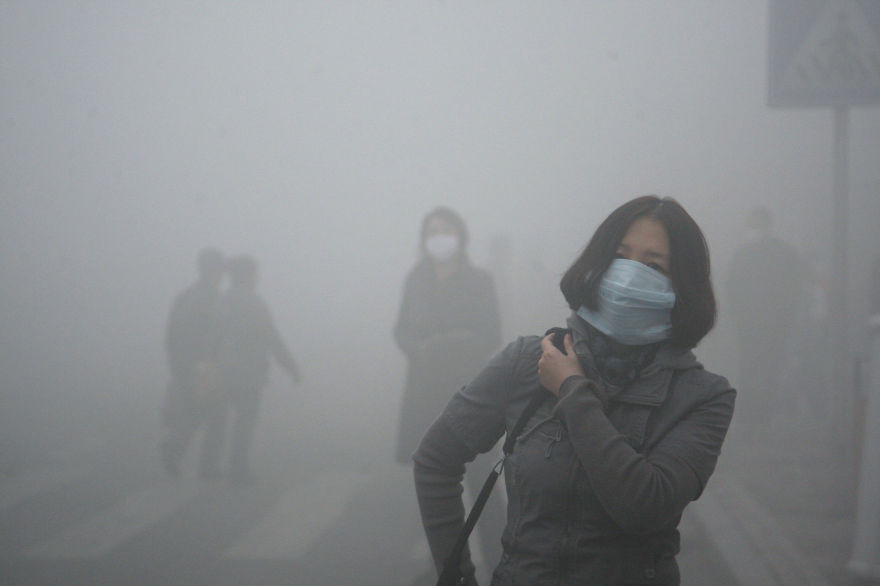
China’s coal consumption is more than eleven times larger than the U.S Coal consumption. In fact, their appetite for mining coal is that they even mine coal with a noticeable Uranium content, and burn it without separating out the Uranium first, leading to severe health problems for the people downwind from the coal burning power plants. In addition, since scrubbing is expensive the operators have the scrubbers down for maintenance as often as they can get away with it.

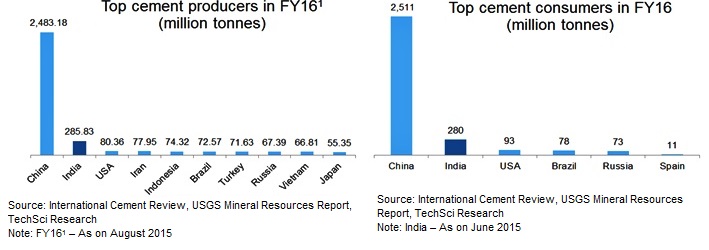
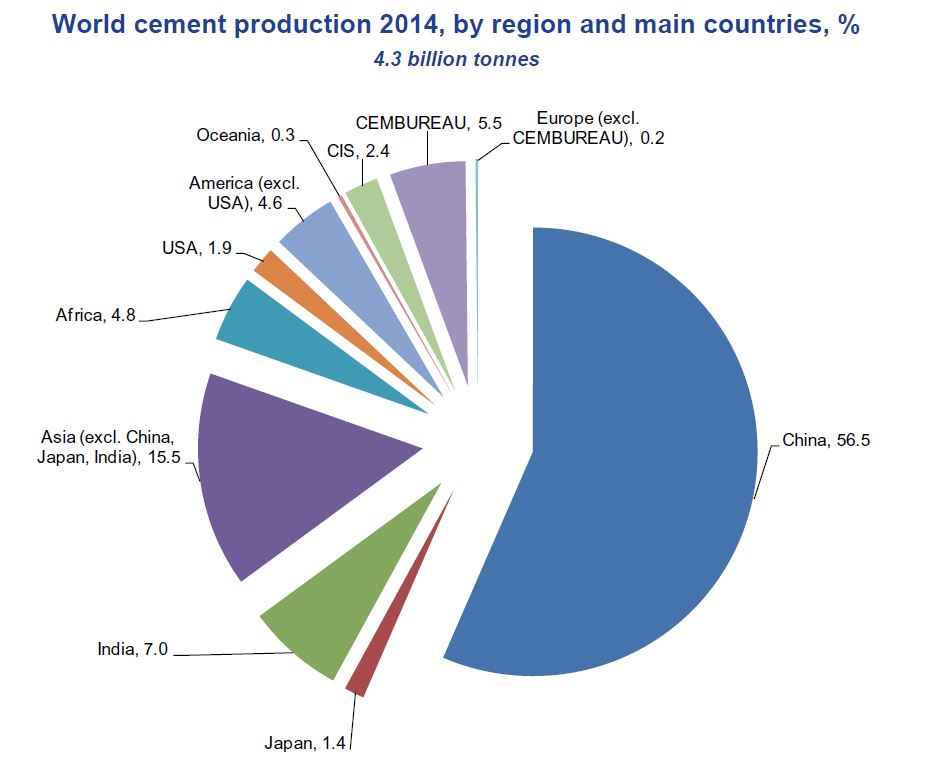
China is also the world leader in cement production. In 2022 China produced 2,1 billion metric tons of cement, or 64% of the world total. By comparison, U.S. produced 95 million metric tons, or about 22 times less than China.

But where China has U.S and the rest of the world over a barrel is in the mining and production of rare earth metals. China mined 240,000 metric tons in 2023, or about 64% 0f the worlds total, but China is also the world’s largest importer of rare earth metal ore for refining. By comparison, US mined 43,000 metric tons, but most of it is still refined in China. The US regulatory environment makes it a slow process to get permits. China has strict export controls over who can be allowed to buy refined rare earth metals, and they always want a favor in return for doing so.

We have our work cut out for us. Right now we are too dependent on China to fully be able to sever our dependence on China.

China the leader in Climate Change. A Limerick.

Is China’s “clean energy” coal?

Use half of the world’s is their goal.

It pollutes with its soot

but they don’t give a hoot.

Their aim is for world-wide control.

From NYT: When China halted plans for more than 100 new coal-fired power plants this year, even as President Trump vowed to “bring back coal” in America, the contrast seemed to confirm Beijing’s new role as a leader in the fight against climate change.

How is China doing? From 2002 to 2012 China increased its coal production from one third of the world total to over one half of the world total. No, the rest of the world did not decrease, only U.S. did decrease coal production by about 10% between 2002 and 2012, the rest of the world increased its production, but China tripled its output. After 2014 China has slipped somewhat, but it still burns more than 47% of the world’s mined coal.

China has had a growth per year of between 8 and 10 percent per year for more than a decade, but growth is now down to below 7%. So China decided to call of building 100 coal fired power plants, from 1171 new coal fired plants down to 1071, or about half of the world’s planned coal fired plants.

Here is the installed capacity for China’s electricity production.

China has been praised for its strides in renewable energy. It has many mountains and rivers, so hydropower is a large part. But hydropower is best used as peak power, when the load is high or when the wind doesn’t blow and the sun doesn’t shine, since it can be instantly turned up or down, so coal power carries more like 73% of the load.

But coal is also used for heating and cement production. China has produced more cement in the last three years than the U.S. in the last hundred years. It takes a lot of cement to build artificial islands in the South China Sea. And then there are the ghost cities that can only be produced by total control central planning. Here is a chart of cement production and consumption in the world.

The result? Some of the world’s worst air pollution seen from space.

These brown clouds follow the coast up into the Arctic, where they deposit the soot on the snow and ice, lowering the albedo and causing the ice and snow to melt faster in the summer.

China is the leader in climate change.


Concrete evidence China has cemented its position as world leader.

We now have concrete evidence China has cemented its position as world leader!

World cement production_2This simple pie chart shows China’s cement production is eight times larger than India’s and 30 times larger than United States’.

Stating it another way China has produced more cement in the last 3 years than United States has produced in the last 100 years!

I also realize India is building its infrastructure as fast as they can, and we are not.

Which country is fourth in cement production?
If you guessed Iran, you are right.  Iran’s cement production is about 5% less than U.S. They are building bunkers.

What is China doing with all its cement?

SouthChinaclaimFor one thing they are building artificial islands in the South China Sea. Their goal is to annex the whole South China Sea.

ArtificialIslands


But that is not all. They are also building ghost towns in areas where nobody lives.

china1china3china4


This is the Chinese model. Growing 7 to 10% per year, financing major construction projects. This is a pre-war mentality.

Cement production is also a very energy intensive process. For those worried about CO2, cement production is responsible for about 5% of all CO2 emissions in the world, more than half of it from China.

China also burns half of the world’s coal, and do it with marginal scrubbing releasing soot in the atmosphere causing the air in Beijing to be hazardous about 150 days per year.

china-bad-pollution-climate-change-7__880
A woman wearing a mask walk through a street covered by dense smog in Harbin, northern China, Monday, Oct. 21, 2013. Visibility shrank to less than half a football field and small-particle pollution soared to a record 40 times higher than an international safety standard in one northern Chinese city as the region entered its high-smog season. (AP Photo/Kyodo News) JAPAN OUT, MANDATORY CREDIT

This brown cloud goes out in the Pacific Ocean, then up in the Arctic, settling on the snow and ice, causing the show and ice to have a faster spring ans summer melt.

chinapollutioncloud


This is at least partly why the Arctic ice is shrinking while the Antarctic ice is growing.

217380main_May9_fires_label_500

This chart was made in 2003. Since then Chinese cement production has tripled. Notice the southern hemisphere is by comparison pollution free.  The CO2 levels are the same for the northern and southern hemisphere, but the temperature trends over the poles go in opposite direction.

ftp://ftp.ssmi.com/msu/graphics/tlt/plots/rss_ts_channel_tlt_southern%20polar_land_and_sea_v03_3.png