At the end of the latest ice age, rising CO2 level was only a secondary effect, but rising CO2 levels will delay the onset of the next ice age. The real measurable causes of climate change are examined.

The normal state of the Earth is being in an ice age. If there were no greenhouse gasses at all, the temperature average for the earth would be about -20 C. But there are greenhouse gasses that increases the present world average temperature to about 15 C.

The earth every now and then warms up and enters an interglaciary period, and then slowly cools down again. People have noticed that for the last few ice ages the CO2 levels have closely tracked temperature, at least for Antarctica.

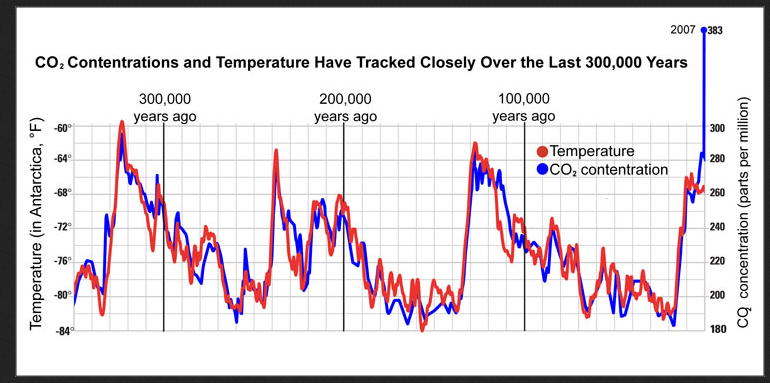
From this chart we can see that for an 18F (10 C) rise in temperature the CO2 level rose 85 PPM. Today;s CO2 level is 425 ppm, a rise of about 165 ppm from pre-industrial levels of about 260 ppm. If the relationship between CO2 levels and temperature still holds we should experience a temperature rise of about 9C for an average temperature on earth to rise to about 23 C (73F) in the near future.

This must be some of the information fed to United Nations Secretary-General Antonio Guterres when he pleaded for immediate radical action on climate change, saying that record-shattering July temperatures show Earth has passed from a warming phase into an “era of global boiling”.

In the book “An inconvenient truth” Al Gore used a very similar chart from the Vostok research site in Antartica, and he used the temperature scale in deviation from normal, hiding the fact that it showed temperatures in Antartica which are not very representative for average temperatures on earth. While the CO2 concentration is about the same everywhere on earth, 20,000 years ago it was about 180ppm. In Vostok, Antarctica the corresponding water vapor concentration was about 50 ppm in the Antarctic winter.

Al Gore chose the Antarctic to show the correlation between temperature and CO2 levels, but does that hold for the rest of the earth?

It was in Antarctica the last Ice age began to end; 19,000 years ago. Why did it end?

To answer that we must look at the

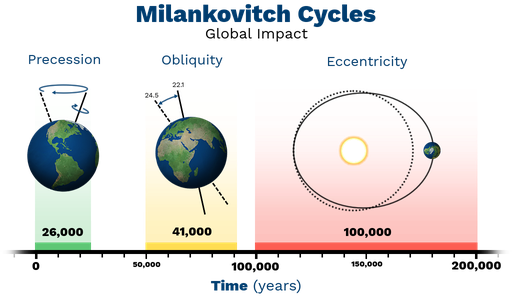
Right now the Earth is near its most circular path, nearing optimum,which is a very good place to be, minimizing yearly temperature cycles globally

Likewise the obliquity angle is about half way between minimum and maximum and is slowly decreasing.This is also good.

The most important of the cycles is the precession cycle. 19,000 years ago it gave most annular heat to the southern hemisphere. This does not normally trigger an end to the ice age, only every 16th cycle or so, when all cycles work together plus the influence of Jupiter and Saturn.One way to describe it is like the rotation in a tilt-a-whirl, popular in many county fairs. You sit peacefully in your car and go around and up and down and nothing happens, and suddenly the centrifugal forces pins you to the back of the car, the more the merrier. But for it to happen, all forces must come together. There could have been a large ice berg break-off, a volcanic eruption spewing ash over the southern hemisphere, an earthquake or a meteoric impact causing a tsunami that caused the start of the beginning of the end of the ice age. One thing is sure, there was no anthropogenic origin (rising CO2 didn’t start it), The question is:

Which came first, rising temperature or rising CO2 level?

The only way to answer that question is to measure what actually happened.

(from LiveScience By Wynne Parry published April 04, 2012.

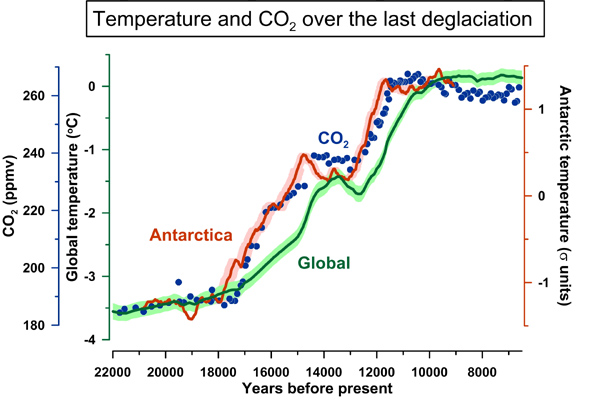
This chart is very interesting. It shows the Antarctic temperature, starting to rise 19,000 years ago, global temperature and global CO2. The chart clearly shows that Antarctic temperature rose first, followed by rising CO2 levels for the first 4000 years. The CO2 level in the Northern Hemisphere follows the level in the Southern Hemisphere with only a 2 year time lag.

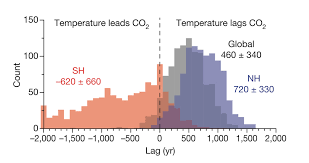
At about 14,000 years ago the Precession changed so solar radiation began to favor the Northern Hemisphere. At this time the CO2 levels had already increased to about 240 PPM but the ocean temperature was still lagging. In the Northern Hemisphere the CO2 rise came before the temperature rise. As we can see from the above picture temperature did lead CO2 levels by about 620 years +- 600 years in the Southern Hemisphere, whereas in the Northern Hemisphere CO2 leads Temperature by about 720+- 300 years for a global lead of CO2 rise over Temperature rise of 400 +- 340 years. But it is important to note that it was temperature that rose first, and as the oceans began to slowly warm up CO2 was released from the warming water hundreds of years later.

Then about 11,500 years ago CO2 levels leveled off at 265 PPM and began a slow decline to 260 PPM while global temperatures rose one degree C during the next 3,500 years. 8,000 years ago began a slow decrease in temperature. Then with no major change in CO2 levels temperatures declined by about 2,5 C until the end of the ‘little ice age’.

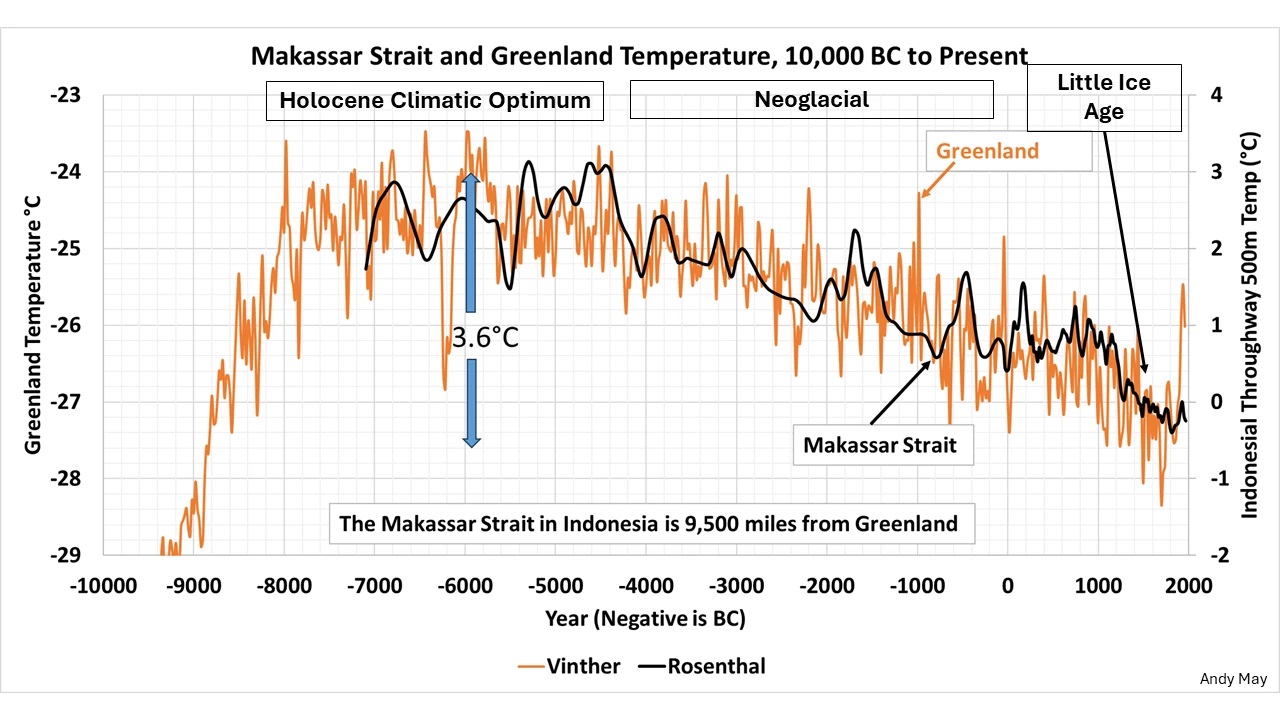
The chart above compares two temperature proxy reconstructions. The orange reconstruction is the Vinther (2009) elevation corrected Greenland temperature reconstruction from ice cores. The black reconstruction is from Rosenthal (2013) and is his 500-meter depth temperature reconstruction in the Makassar Strait, Indonesia. It is thought to represent sea surface temperatures in the North Pacific Ocean. The Greenland temperatures are taken from ice cores from Southeastern Greenland. These are all indirect measures derived from O2 isotopes in Greenland and from sea shells and other sources in the sea bottom of Makassar Strait

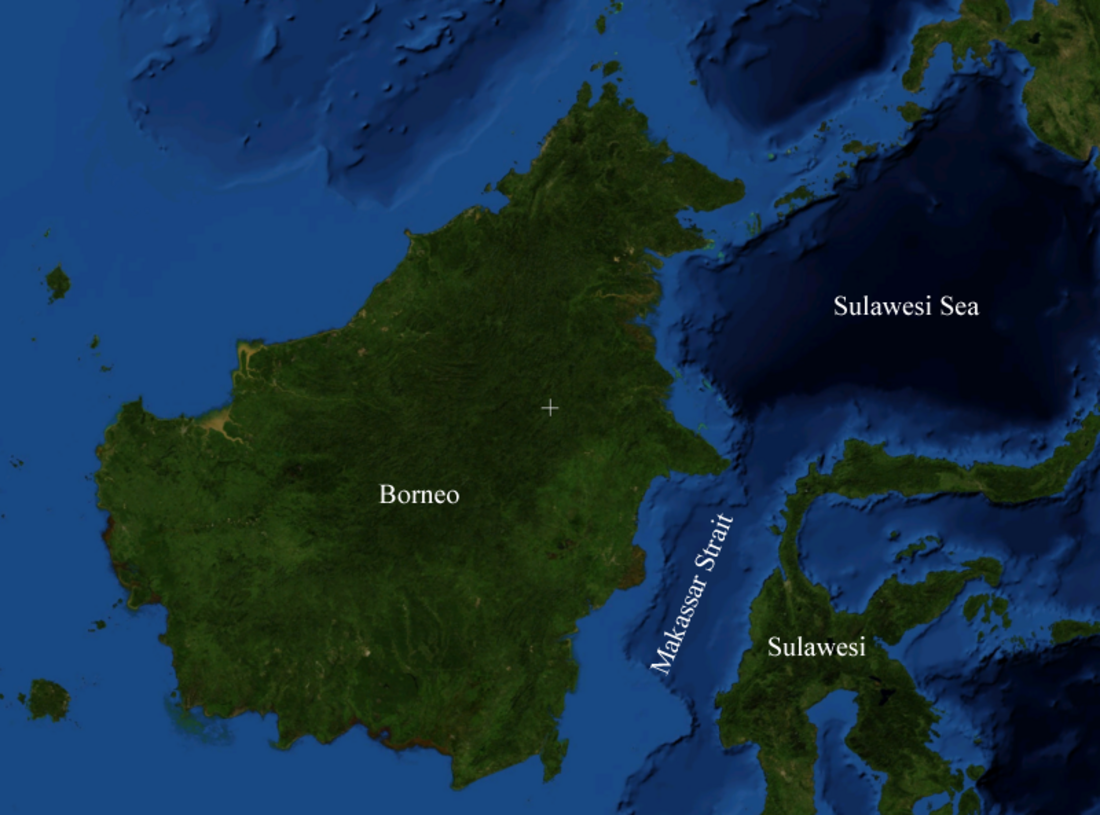
As the graph shows, temperatures follow each other very closely until the industrial revolution, when for the first time in 10,000 years the Greenland temperature start to increase, but the Makassar Strait temp doesn’t. One could argue that ocean temperature change lags atmospheric change by about 300 years.

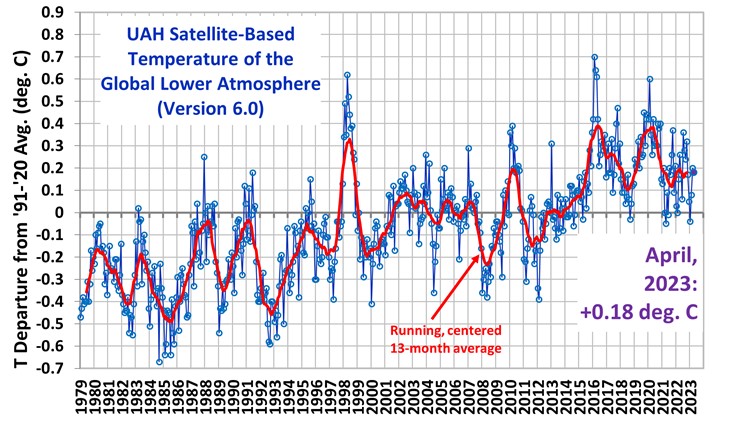
Let us take a closer look at the temperature changes in the last 46.5 years, the only time we have good satellite records of global temperatures, and they are indeed rising.

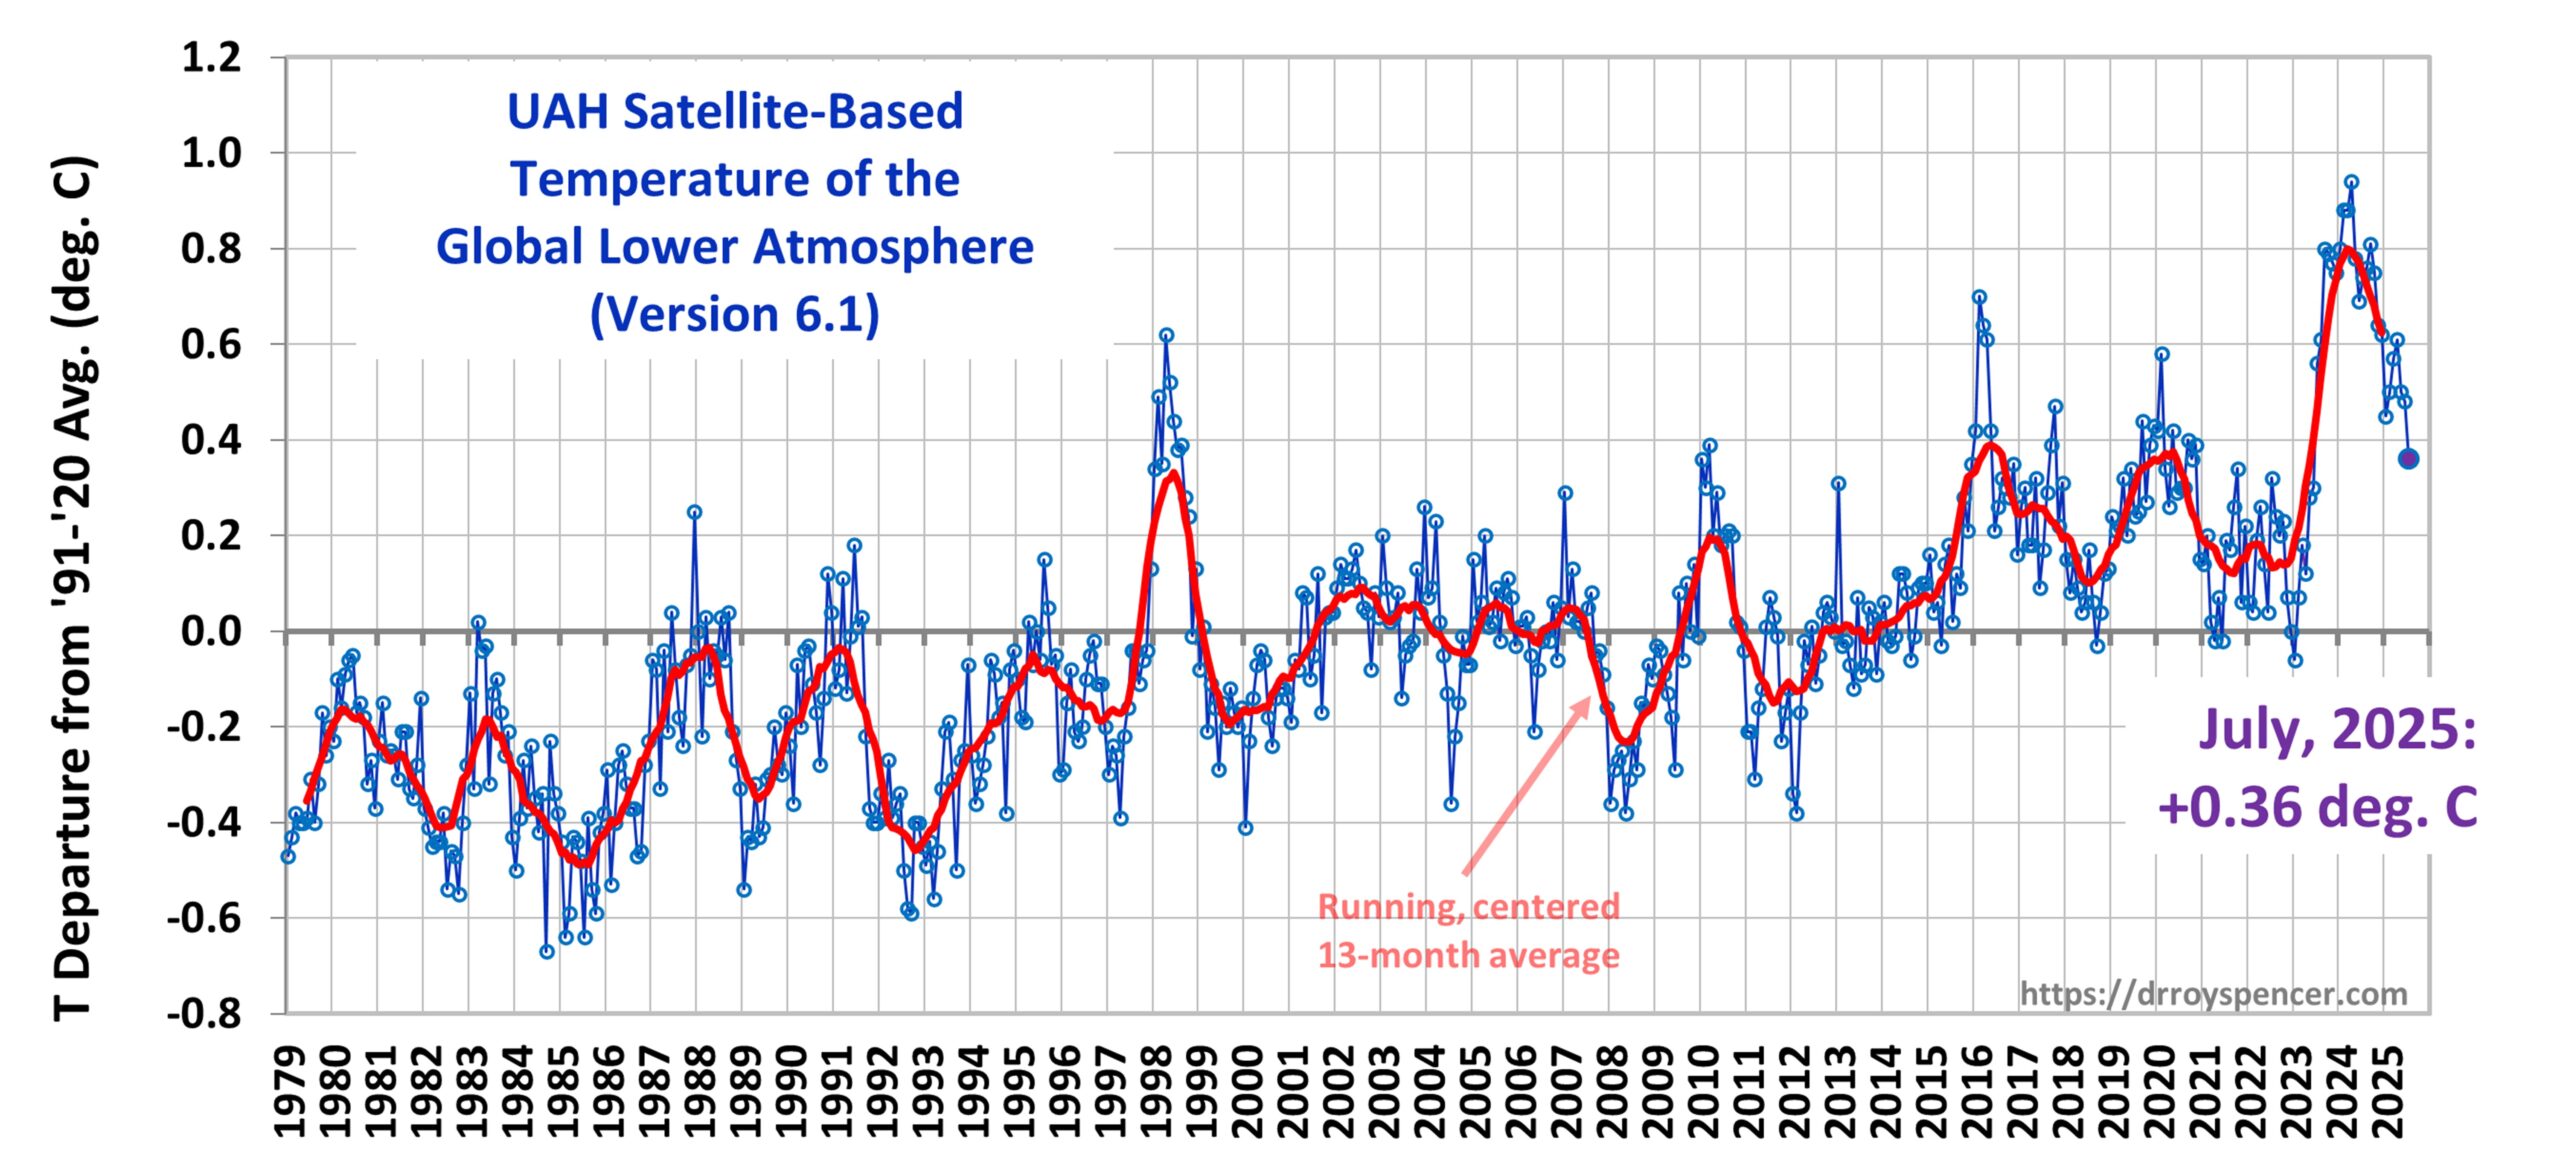
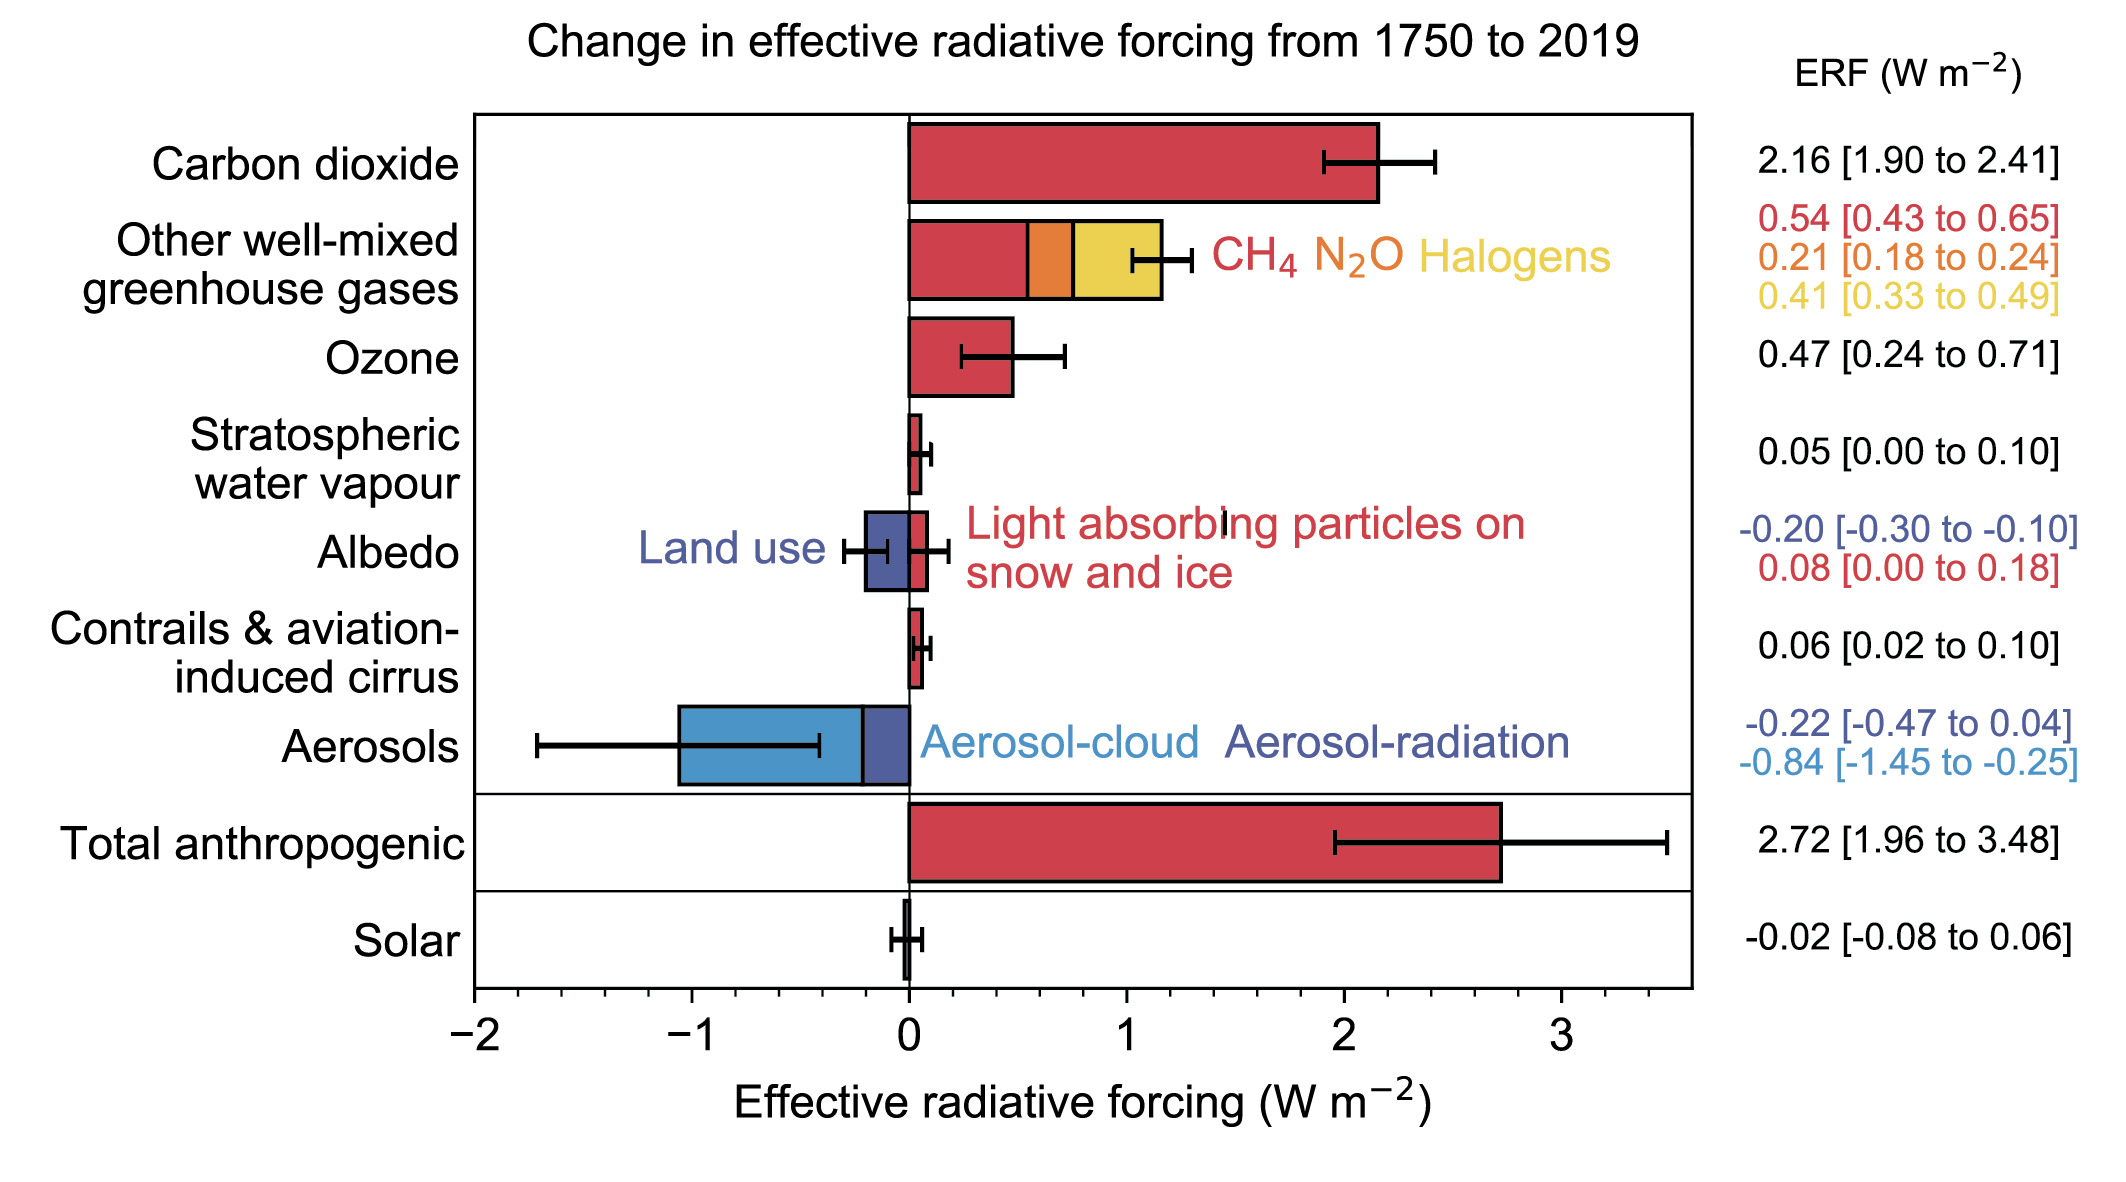
Yes. in the last 46.5 years the global lower atmosphere average temperature has risen about 0.8C. The question is: How much of this is due to rising CO2, how mush to H2O in all its forms: vapor, clouds, liquid, ice; and how much is due to other factors, such as Methane, Nitrous oxide, and the greening of the earth?

When global temperature increases 0.8 degrees Celsius and relative humidity stays the same there will be 5.5% more water vapor in the air. How much of the temperature rise is attributable to a 5.5% increase in water vapor?

To answer that we must take a look at the greenhouse effect. Without it the earth would be an ice ball with an average temperature about 34C cooler than today. The earth can be considered a black body that obeys laws for black body radiation, the Stefan–Boltzmann law that states that the total energy radiation is proportional to the fourth power of the absolute temperature (Kelvin), so an increase in global temp from 14C to 14.8C results in an increase of 1.01% in the total greenhouse effect (a smaller increase in the atmospheric window).

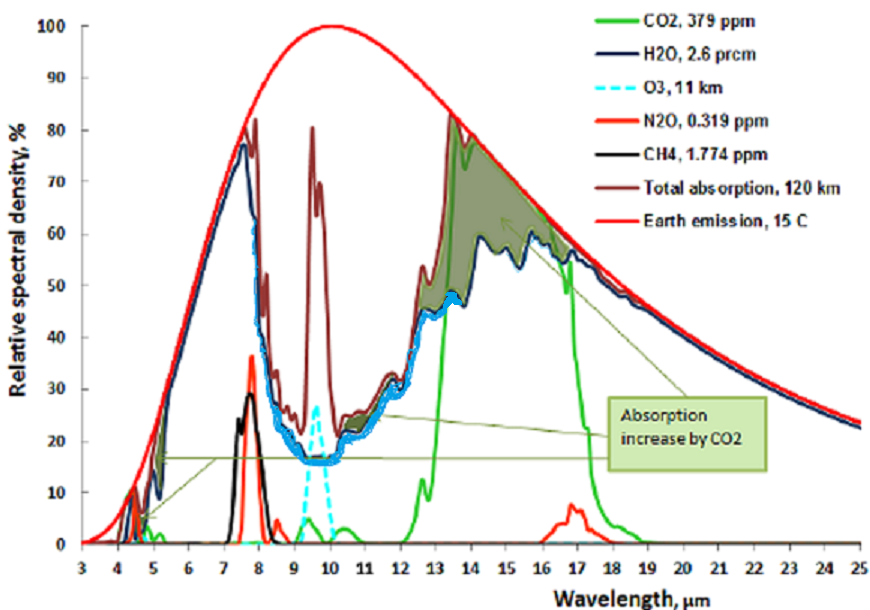
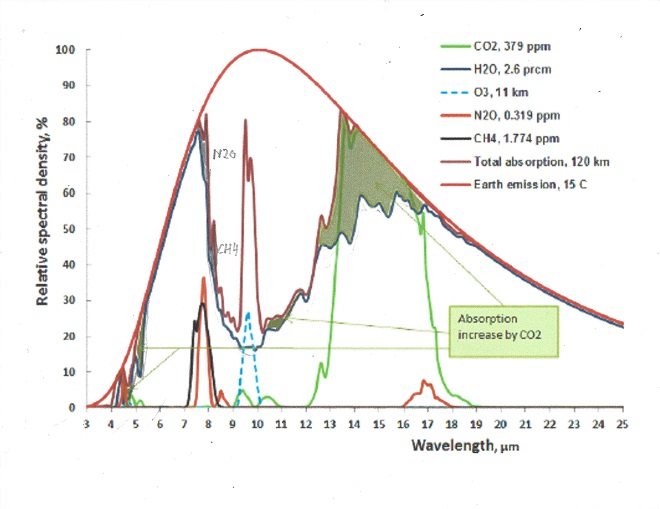
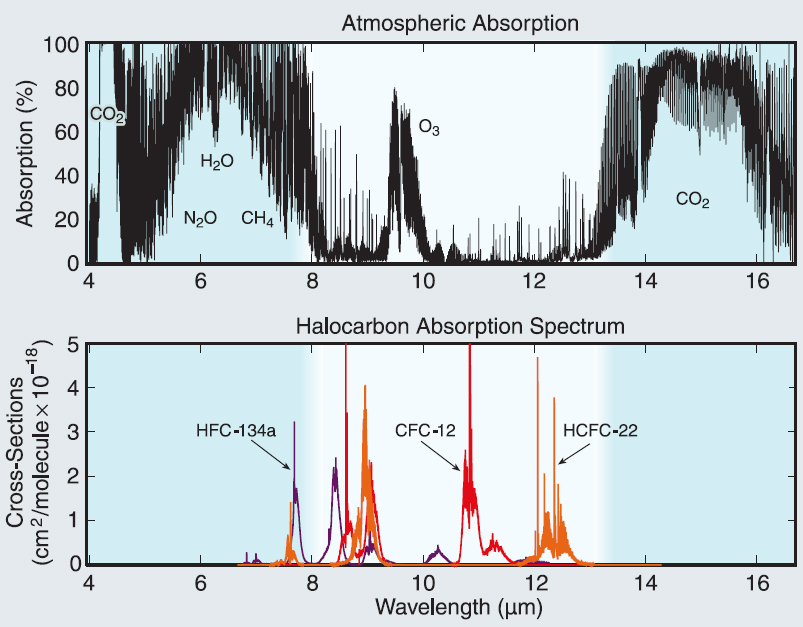
To sum it up: Since water vapor is fundamental I will count it first, and the effect of all the other greenhouse gases will be additional, remembering that the total absorption in any frequency band can never exceed 100% of available energy. Water vapor absorbs all available black body energy in all wavelengths except in the atmospheric window (7 to 17 μm) The increase of absorption occurs in the atmospheric window, and in some bands of the incoming sunlight in the near infrared region. The bands are 0.7, 0.8, 0.9, 1.1, 1.4 and 1.9 μm. Together, they make up 90% of the greenhouse gas temperature rise, or 29.9 degree C. When global temperatures increase by 0.8 C there will be 5.5% more water water vapor assuming relative humidity will stay constant, there will be an additional 0.17 C temperature rise.

Total greenhouse effect 33 C, Greenhouse effect from water vapor is 29.9C

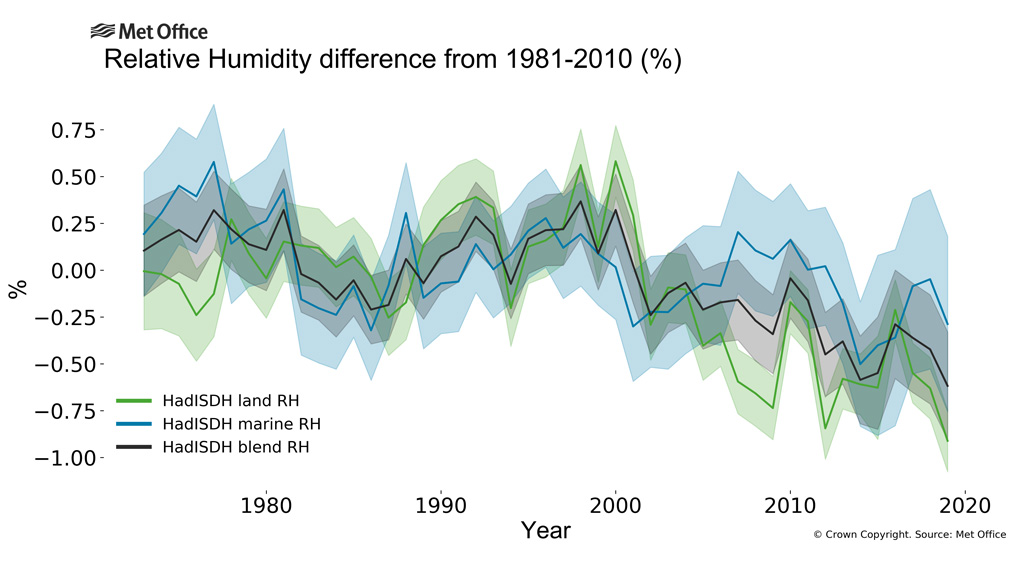
Increased greenhouse effect from 5.5 % water vapor increase 0.17C. This is true only if relative humidity stayed constant. How much has the relative humidity changed?

From a temperature increase standpoint the change is too small to change the results. However relative humidity has a great influence in the formation of clouds. We now has the 46.5 years of satellite data of clouds, but I only have the cloud averages. We all know that clouds cool by day and warm by night. During night, what is under clouds will absorb all the black body radiation, but re-emit as a new black body above the clouds, but at a much lower absolute temperature, depending on the cloud height. This is the smaller night effect.

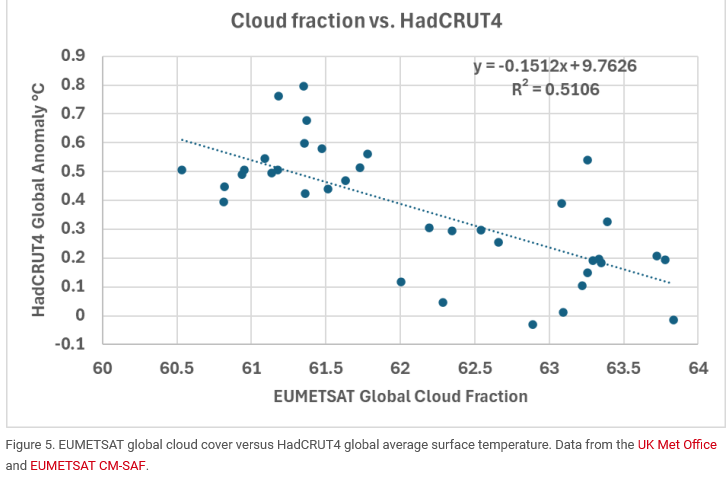
Much more important is the daytime reflection of incoming sunlight. The most important clouds are the low level cumulus clouds that forms from humid air rising in daytime sunshine and disappear in the evening, but all clouds reflect back the incoming sun. All I have is statistics of cloud averages, but not where and when they appear and dissolve, but I will make the assumption that averages prevail. This is recent statistics of world average cloud cover:

The cloud cover average (extrapolated) has decreased 3.45% in 46.5 years How much has temperature increased in the same time?

The total temperature rise due to less cloud cover over 46.5 years is 0.23C

Now it is time to see the effect of CO2 increase. In 1979 it was about 327 ppm, now it is about 427 ppm, a 27% rise in 46.5 years. If there was no water vapor in the atmosphere the greenhouse effect of CO2 would be 5.09C at 327 ppm and 5.28 C at 427 ppm. The reason it does not rise more as CO2 rises is that from 13 to 17 μm the temperature rise is limited because all available energy in that band is already fully absorbed. But it gets worse; the water vapor is already the dominant absorber, so the net addition from increased CO2 is only 30% of what would be if there was no water vapor, that is 1.527 C at 327 ppm and 1.584C at 427 ppm for a total CO2 rise of 0.057C.

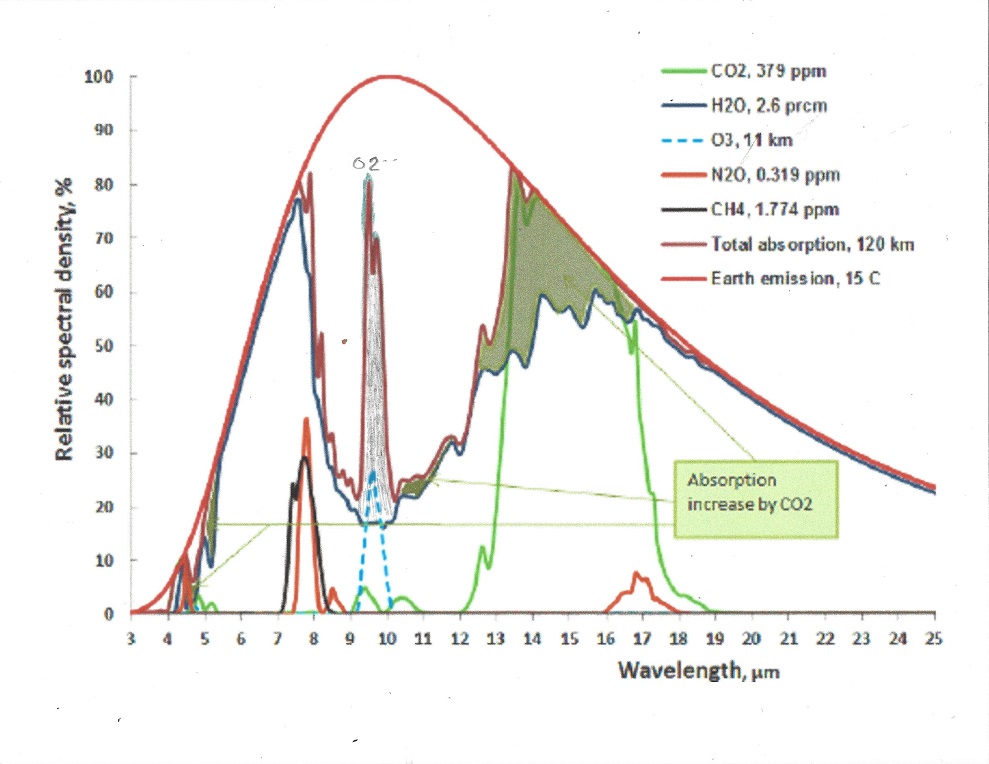
Likewise Methane and N2O absorption both occur around the 8 μm wavelength, where water vapor already absorb about 80% of all available energy, so that means both Methane and N20 are attenuated by about a factor of five from what they would have been had there been no water vapor.

Methane concentration has increased from 1.6 ppm to 1.9 ppm, leading to a temperature increase of 0.03C in 46.5 years.

N2O concentration has increased from 300 ppb to 340 ppb, leading to a temperature increase of 0.006C in 46.5 years.

The Arctic has experienced a temperature rise due to increased cloud cover and snowfall. It is due to increased heat transfer from the American Gulf in the form of water vapor, clouds, rain, and snow. When water vapor condensates into clouds, over 500 calories per gram of energy is released, and when it condensates into snow, another 80 calories per gram gets released. As water vapor increases with temperature, the Arctic gets less cold but snowier. The snow acts as an insulator on the sea ice, allowing the ice to freeze slower in the winter, and melt faster from the underside. This lead to a global warming of 0.06C in the last 46.5 years.

No such heating has occurred as of yet in the Antarctic. It is still the largest desert in the world; a hostile ice desert. (I wonder why Al Gore chose this climate to represent the relation between CO2 and temperature).

Add up all temperature changes so far in the 46.5 years of satellite data

Increased greenhouse effect from 5 % water vapor increase: 0.17C.

Total temperature rise due to less cloud cover over 46.5 years is 0.23C

Total temperature rise due to increased CO2 levels in 46.5 years is 0.057C.

Total temperature rise due to increased Methane levels in 46.5 years is 0.03C.

Total temperature rise due to increased N2O levels in 46.5 years is 0.006C.

Warming in the Arctic (globalized) over 46.5 years: 0.06 C.

Warming due to increased Ozone over 46.5 years: 0.004 C.

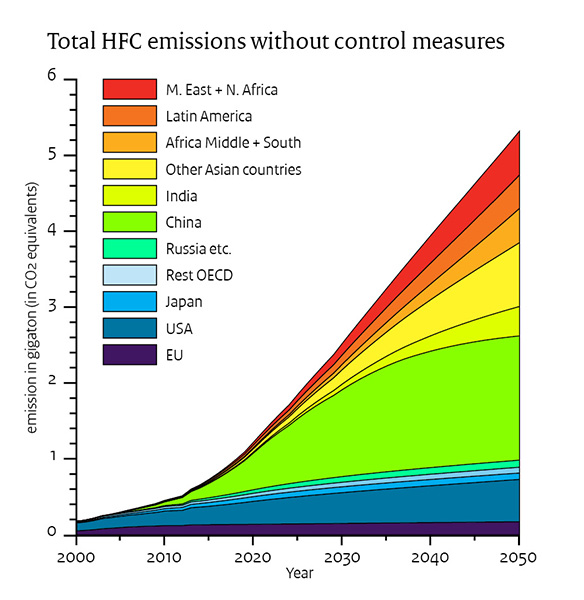
Warming due to increased HFC gasses over 46.5 years: 0.0015 C.

The total temperature increase noticed so far: 0.5585C. CO2 is responsible for 10% of the found rise, and Methane for 6% of the experienced rise.

There is one very interesting side effect of rising CO2, and to a much less extent; rising Methane levels. It leads to a substantial greening of the earth. The leaf area has been steadily increasing in areas where the leaf area is not fully saturated:

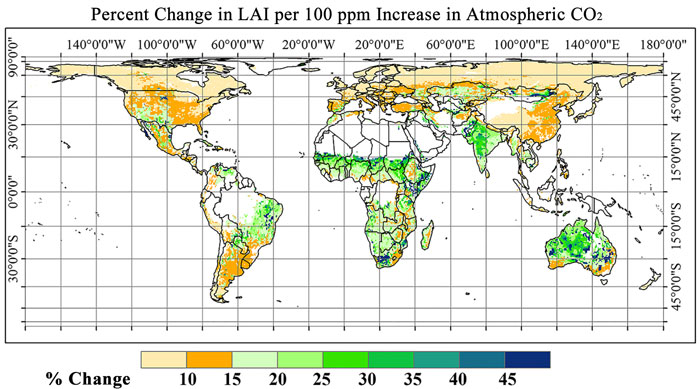
This picture shows the Leaf Area Index increase over the last 46.5 years.As we can see there is no increase in the deserts and in the dense rain forests, but overall there has been between 15 and 20% increase in the LAI. More leafs, more area to absorb CO2.

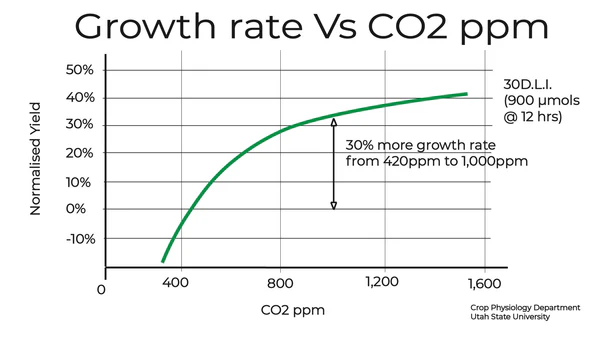
The rise in CO2 concentration from 327 ppm to 427 ppm makes the effective growth rate of vegetation increase about 25% on average. There is a wide variation between plant sensitivity to increased CO2, but they all react favorably up to more than 1000 ppm concentration.

Using this information there should have been an increase in vegetation of 25 + 15% of CO2 uptake by vegetation worldwide without any other use of fertilizer. (Notice that the leaf area index did not increase much in the tropical rain forests since the leaf area is already fully optimized.

If one looks at the total greening of the earth the total leaf area did increase even in the rain forests, in some other areas by as much as 50%.

However, there are a few areas where the leaf areas decreased. these areas are where there is a deficit of water for optimal leaf growth. This is worrying, since the areas of water deficiency are areas where people want to live. An extreme example is today’s Iran, where the water reservoirs are running dry, and all water used in the hot summer is taken from aquifers that are also running dry. And it is getting worse:

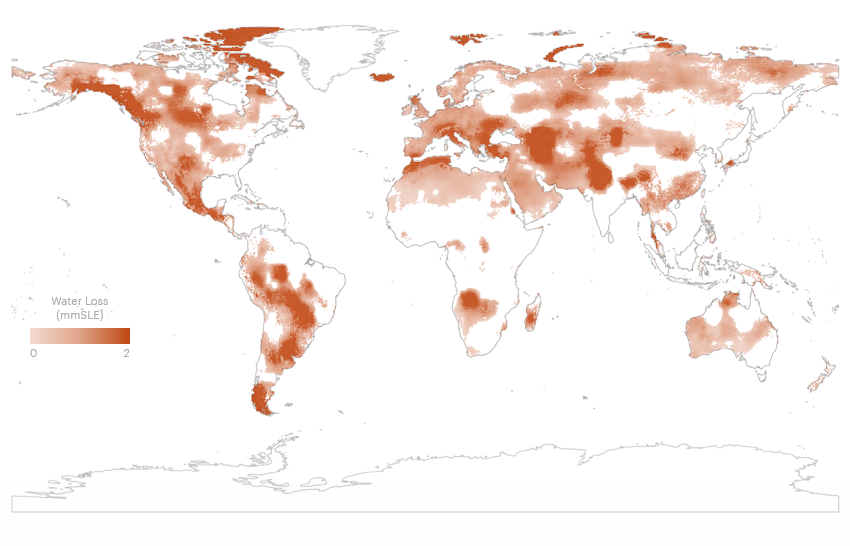
The following picture shows the drying up of the earth between 2003 and 2013 in sea level equivalence from 0 to 2 mm

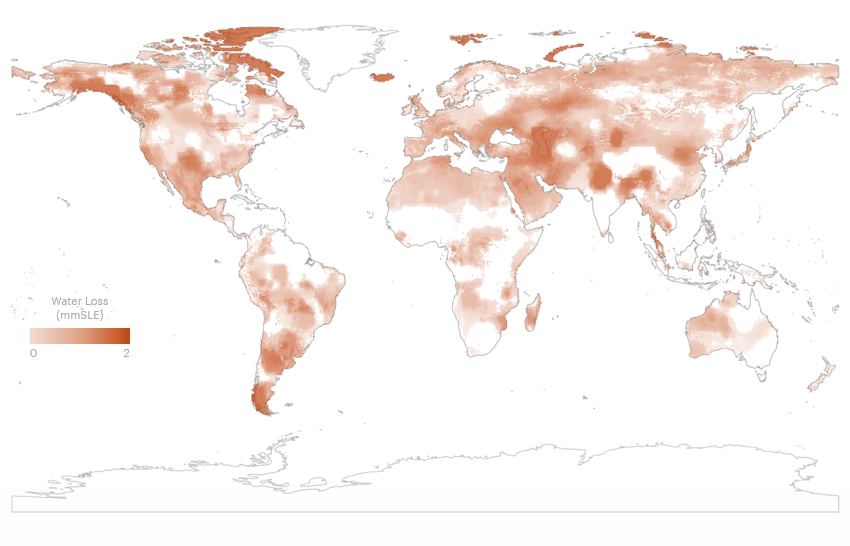
The areas most affected are the U.S. and Mexico Southwest, the South American Pampas, Southern Europe. Northern Africa, The Arabian Peninsula, The Middle East from Syria to Iraq, Iran Kazakhstan, Pakistan and North Western India, This is from 2014 to 2024 and it shows it is getting worse. The aquifers are getting consumed

To take water out of aquifers without replacing it leads to an inevitable desertification of the areas where people want to live. Desertification leads to disaster, the rivers dry up and the areas become uninhabitable.

Urban heat islands: The worlds urban areas are growing rapidly and are now housing more than half the world’s population. It is now occupying more than 1% of the land area and has grown 0.15 % of the total area of the world. People living in urban areas, especially in areas with air conditioning are experiencing ‘local global warming’ of about 7F in the U.S. It is still large in all urban areas, maybe 4F on global average. (This is why people living in a megalopolis are convinced in global warming, they are living it.) Total global warming effect in the last 46.5 years: 0.033C

Draining land for infrastructure. We are doing what we can now to preserve wetlands, but wherever a road or other structure such as an airport is being built, proper drainage and land improvement is being performed. In the last 46.5 years about 1% of the worlds land surface has been drained and made dry. This is another heat effect that I estimate to lead to about 2C in the affected areas leading to a world temperature increase of 0.04C

Temperature increase from greening of the earth (without taking into account a changing cloud cover that is accounted for separately 0.002C

Temperature decrease from desertification of the earth: 0.001C

Total estimated temperature rise: 0.6325C

Summary: Temperature change due toWhat to do

Loss of cloud cover: 0.23C or 36%

5% increase in absolute humidity: 0.17C or 27%

Warming in the Arctic: 0.06C 0r 9,5%

Increased CO2: 0.057% or 9%

Infrastructure land use change: 0.04C or 6.3%

Urban heat islands: 0.033C or 5.2%

Increased Methane levels: 4.7%

All 0ther causes: 2.3%

What to do.

To go carbon neutral and do nothing else will solve less than 10% of the perceived problem. Neutralize Methane increase will add less than 5% to the solution

No, the problem is all about water, clouds and desertification.

In the next 100 years or so we will experience a magnetic polar reversal, and this may lead to an unprecedented rash of volcanic activity since the magnetic force reversals will activate magma in ways that we cannot yet foresee. When volcanic ash reaches the stratosphere it stays there for years causing global cooling. The Milankovitch cycles points to a slow cooling down of the earth.

The current rise in CO2 is very good. It has helped us feed another 2 billion people, not to mention all the wild life and plant growth.

The CO2 increase will delay the onset of the next ice age by about 2000 years. Without it we would still be in the little ice age.

President Trump signed 4 nuclear power Executive orders today. Small Nuclear Reactors (preferably Molten Salt Reactors) will finally be realized!

In addition he signed one Executive Order restoring Science to the Golden Standard: Free from politics!

In the presentation of the Executive Orders the CEO of Oklo, James DeWitte mentioned that we are restarting a technology that has been inactive for over 40 years. This can only mean he meant without saying so the Oak ridge Molten Salt Thorium reactor. It was going great, but President Nixon wanted to go with the fast breeder reactor and move nuclear development to California, so they started to badmouth the MSR. One false accusation was that it was unreliable and needed to be shutdown frequently. The real reason was it was routinely shut down on weekends to save money and personnel. The Molten Salt Reactor does not have a poison time after shutdown as does conventional power station but can be scaled up and down including small power stoppages. I see this as an advantage. Anyhow, this is what Mr. DeWitte said:

One of many new options

There are only a few fissionable options, Uranium 233, Uranium 235 and Plutonium 239. Uranium 233 is produced by bombarding Thorium 232 with neutrons. Plutonium 239 is produced by bombarding Uranium 238 with neutrons.

Right now only 0.5% of the mined uranium is used. The rest goes to nuclear waste. Molten Salt reactors can use the nuclear waste as raw material and use the other 99.5% of the available energy. Another exciting use of Plutonium is when we finally dismantle the nuclear arsenal and burn it for peaceful use. And there is four times as much Thorium as there is mine-able Uranium, enough for thousands of years!

This is the beginning!

Here are 30 reasons why Thorium is a superior source for nuclear power:

 1. A million year supply of Thorium available worldwide.

 2. Thorium already mined, ready to be extracted.

 3. Thorium based nuclear power produces 0.012 percent as much TRansUranium waste products as traditional nuclear power.

 4. Thorium based nuclear power will produce Plutonium-238, needed for space exploration.

 5. Thorium nuclear power is only realistic solution to power space colonies.

 6. Radioactive waste from an Liquid Fluoride Thorium Reactor decays down to background radiation in 300 years compared to a million years for U-235 based reactors. A Limerick.

 7. Thorium based nuclear power is not suited for making nuclear bombs.

 8. Produces isotopes that helps treat and maybe cure certain cancers.

 9. Liquid Fluoride Thorium Reactors are earthquake safe, only gravity needed for safe shutdown.

10. Molten Salt Liquid Fluoride Thorium Reactors cannot have a meltdown, the fuel is already molten, and it is a continuous process. No need for refueling shutdowns.

11. Molten Salt Nuclear Reactors have a very high negative temperature coefficient leading to a safe and stable control.

12. Atmospheric pressure operating conditions, no risk for explosions. Much safer and simpler design.

13. Virtually no spent fuel problem, very little on site storage or transport.

14. Liquid Fluoride Thorium Nuclear reactors scale beautifully from small portable generators to full size power plants.

15. No need for evacuation zones, Liquid Fuel Thorium Reactors can be placed near urban areas.

16. Liquid Fluoride Thorium Reactors will work both as Base Load and Load Following power plants.

17. Liquid Fluoride Thorium Reactors will lessen the need for an expanded national grid.

18. Russia has an active Thorium program.

19. India is having an ambitious Thorium program, planning to meet 30% of its electricity demand via Thorium based reactors by 2050.

 20. China is having a massive Thorium program.

21. United States used to be the leader in Thorium usage. What happened?

22. With a Molten Salt Reactor, accidents like the Three Mile Island disaster will not happen.

23. With a Molten Salt Reactor, accidents like Chernobyl are impossible.

24. With Molten Salt Reactors, a catastrophe like Fukushima cannot happen.

25. Will produce electrical energy at about 4 cents per kWh.

26. Can deplete most of the existing radioactive waste and nuclear weapons stockpiles.

27. With electric cars and trucks replacing combustion engine cars, only Thorium Nuclear power is the rational solution to provide the extra electric power needed.

28. The race for space colonies is on. Only Molten Salt Thorium Nuclear reactors can fit the bill.

29. President Donald J. Trump on Jan. 5 2021 issued an Executive Order on Promoting Small Modular Reactors for National Defense and Space Exploration. Only Liquid fluoride thorium reactors can meet all the needs.

30. We have to switch from Uranium to Thorium as nuclear feed-stock. We are running out of domestic Uranium.

Today is the 55th Earth Day. A Limerick.

It’s time for the fifty-fifth Earth Day

To celebrate Lenin’s old birthday

Let’s dig swales, plant more trees

grow more food, attract bees.

Revive God’s dry earth in rebirth day.

Lenin

The very first Earth Day was celebrated April 22 1970, on the 100 year anniversary of the birth of Vladimir Lenin (Владимир Ильич Ленин). True green environmentalists keep telling me it is just a coincidence. I think not..

earth-day-Einhorn-02

The first Earth Day in Philadelphia 1970 featured Ira Einhorn (The Unicorn Killer) as master of Ceremonies. For those too young to remember, he murdered his girlfriend , stuffed her in a piece of luggage in his apartment and kept her there for seven years, and no one smelled a dead rat). He was finally convicted many years later. The big environmental scare of that day was the threat of a new Ice Age. The clarion call was: “In the year 2000 temperatures will have fallen 10 degrees”, the culprit was pollution, especially acid rain.

Things have changed, and we have experienced decades of climate change, or so they say, but it depends very much on where you live. Most of the increased temperature since 1970 is due to cleaner air in the industrialized nations, there are now more thunderstorms as opposed to daylong rains. This leads to fewer clouds and less reflection of incoming light back into space. This means warmer days.

What forms clouds is saturated humidity with a sufficient aerosol to form condensing spots. The best solution is to plant trees that provide enough aerosols to form clouds. This is especially important in the American Southwest and the whole 10-40 degrees latitude region where the majority of the world’s population lives.

USA can be seen as two very different regions: In the West the fight is about water rights; in the East it is about water responsibilities.

My proposal is that we reshape the water rights laws so that water rights belong to the land. Where it rains, as much as possible of the rain should remain on that land without building dams. By building swales and planting trees at high elevations the erosion from flash floods will diminish, and more water will remain in the ground, causing rivers to flow year round rather than seasonal. As it is now a house owner in Arizona cannot even water his plants from what falls on his roof or driveway.

In the East the opposite is true. When you build a house with a driveway you must also provide a catch basin capable of absorbing all the rain that falls on the improved property, sufficient to absorb a substantial rainstorm.

As it is now, the aquifers is the west are being drained, and need to be restored. Yes, without restoring the aquifers the American Southwest will experience desertification.

A hint of why medical expenses are so high in the U.S.

If you can, do.

If you can’t do, teach.

If you cant teach, administrate.

If you cant administrate, administrate.

This saying is old, and was circulated both when I was in private industry and when I worked at the University. During my 56 years in the U.S. I have watched the cost of medical care rise from 6% of GNP to over 20% of GNP. Part of it is of course that we are getting older, and people used to die at their first heart attack, and now they can survive multiple heart attacks, just to name one disease.

I got a hint at the real reason seeing this official chart:

While the number of doctors have slightly more than doubled, the number of administrators have risen thirty-twofold. and that was in 2009. Things are even worse now, since another level of federal bureaucracy have come between the doctors and the patients. It used to be simple, you paid the doctor, and that was it. The problem with this was that many could not afford a doctor, so during the second world war companies offered free health care since there was wage controls and competition for available workers was strong. This got institutionalized, and unions negotiated the best contracts, so pressure for national health care, which was the norm in many parts of the world never materialized.

Obamacare was finally enacted in 2010 and we now have the worst of all possible health care systems. The pharmaceutical establishment operate under their mission statement: “To cure a patient is not a sustainable business model” and so all pharmaceutical research is directed to control diseases, not to find permanent cures. Granted, there are many doctors that want to cure their patients, but they are swamped by incentives to control the diseases instead; the U.S. and New Zealand are the only two countries in the world that allow medical advertisements. The doctors operate in a difficult regulatory environment, there are local and state regulations, overlayed by federal regulations, often in conflict with each other. The hospitals are burdened with a lot of patients that are not willing or able to pay leading to people that are able to pay with horrendous bills, that they have to pay for the rest of their lives. I could go on, but you get the picture.

There has been much ballyhoo about to control the cost of medicine, like limit the cost of insulin to no more than 35 dollars per month. this all makes sense, since a person with type 1 diabetes is totally dependent on insulin for survival.

Yesterday I received a reimbursement for overpaying a drug. They really try to control drug costs!

This is how bureaucracy works. Thanks for the 15 cents back.The stamp alone was 59.3 cents. And the letter included the obligatory “Discriminating is against the law” page. Just to be sure, it was the bureaucracy itself that made the request, not me.

Thanks, bureaucracy!

Of the recorded temperature increase between 1980 and 2023, how much is attributable to CO2, and how much to other greenhouse gases? The correct answer is; it is mostly due to the decreased cloud cover.

By far, the strongest greenhouse gas is water vapor, not because it is very strong of itself, but it absorbs nearly all outgoing energy in the infrared spectrum except in the so called atmospheric window, where it only partially absorbs. Yet water vapor is missing from the IPCC AR6 chart seen here:

IPCC has consistently treated the effect of greenhouse gasses as additive, but it is impossible to absorb more than 100% of all emitted energy for a given wavelength. This leads to an overestimation of absorption when 2 or more gasses are present. For example, if CO2 absorbs 90% of available energy at 13 μm and water vapor another 50%, the sum is 90% + (1 -0.9} * 0.5 = 95%, not 140%

This will change the relative importance of greenhouse gasses drastically so it must be tested against reality. We now have a good global satellite temperature record from 1980 to 2022 or 43 years:

During this time the temperature rise was 0.5 C, which translates to 2.375 W/m2 ERF

Water vapor.

This is a good chart to see the relative importance of all major greenhouse gasses:

It is to be noted that water vapor also absorbs the incoming solar radiation in certain wavelengths, but solar influx is assumed to be constant.

When average temperature rises 0.5 C, the possible absorption rises by 2.375 W/m2 minus the energy that escapes through the atmospheric window.Water vapor through saturation: is responsible for all of this increase except where other gasses also absorb in the atmospheric window, and in the atmospheric window the absorption must be proportionally shared, subject to the 100% absorption limitation.The atmospheric window is about 26% of all the emitted radiation so net water absorption is 0.74 * 2.375 = 1.6 W.m2 or 0.34 C. However, the relative humidity is also decreasing, see picture:

Between 1980 and 2022 the net humidity increase is 3.6% minus 0.75% relative humidity for a net increase of 3.54%. This increase only matters in the atmospheric window which is on average 25% saturated, so the total increase from water vapor increase is 0.26 * 2.375 * 0.25 * 0.9925 = 0.15 W/m2 or 0.03 C., to be added to the total before increase in humidity.This means that for a 0.5C temperature increase between 1980 and 2022 the total sensitivity to water vapor is 1.75 W/m2 or 0.37 C. A confirming picture of the total cloud cover shows the , but temperature sensitivity to the decline in cloud cover between 1980 and 2015

This is of course a very crude method, since it incorporates all temperature rises from all sources, which is 0,5C degrees, from which should be deducted the 0.08C rise from all. This is of course a very cruse assessment of the influence of clouds vary greatly between low clouds, middle clouds and high clouds; as well as when they occur, day or night, and even what time of day they appear. Because of this complexity IPCC has consistently failed to give clouds their full respect. The clouds are the main regulator of temperature on earth!

Carbon dioxide

CO2 is the strongest greenhouse gas after water vapor. The only wavelength band that is meaningful is 13 to 17.4 μm and absorption occurs from both CO2 and water vapor. Since they exist together, the effect of each of them must be proportionally allocated, or the sum of them added would exceed 100%

Between 1980 and 2022 the CO2 levels rose from 335 ppm to 415 ppm or 24% increase. The temperature increase 0.5 C. The net temperature increase or ERF in the 13 to 17.4 μm band is 0.035C or +0.17 W/m2 for the water vapor and 0.04C or +0.19 W/m2 for the CO2. To see how the calculation was made, go to Appendix 1.

Methane.

Methane gas is created from a variety of sources, both man made and natural. See pie chart

The good thing about methane is that its lifetime in the atmosphere is only 10 to 15 years, and the real contribution to climate change is only 1/5th of what is commonly advertised, since iits absorption bands occur together with partly saturated absorption from water vapor. See appendix 2.

In 1980 the CH4 concentration was 1.6 ppm and will be 2.0 ppm in 2022 which results in an increase of the greenhouse effect of 0.035 C or 0.17 W/m2 ERF from rising levels of Methane since 1980.

N2O.

Atmospheric N2O levels averaged 336 ppb (parts per billion) during 2022, about and was 301 ppb in 1980. It is a 300 times stronger greenhouse gas than CO2 by itself, because its absorption is not saturated in the atmosphere. When water vapor is dominant it is diminished by over 70% since it is at the edges of the Atmospheric window. For calculations see Appendix 3.

In 1980 the N2O concentration was 0.3 ppm which results in an increase of the greenhouse effect of 0.0065 C or 0.031 W/m2 ERF from rising levels of N2O since 1980 .

Ozone.

Ozone occurs as stratospheric O3 which is good. It protects us from uv radiation. O3 in the troposphere is considered harmful if it is over 0.08% It is normally around 0,01% in the troposphere. For calculations and figures, see appendix 4.

When the earth’s temperature rises by 0.5C, from 1980 to 2022, the amount of tropospheric O3 probably rises by 2% (Lacking good data I am guessing wildly, in urban areas it may be much more, but this is global average). This comes to 0.0034C temperature increase or 0.016 W/m2 ERF from O3, from 1980 to 2022.

CFC gasses.

CFC’s are cheap and efficient gasses to use in refrigerators and air conditioners.Their use rose rapidly until it was discovered they destroyed the protective ozone layer in the stratosphere, so its use, got banned in 1994, later diminished including its use in inhalers. CFCs has since diminished slowly and is maybe already below the levels in 1980. See also Appendix 5.

HFC gasses.

HFCs replaced CFCs and are rapidly growing in use, and the compressor seals still leak. For pictures on why they are a growing concern for the future, see Appendix 6.

The temperature increase from 1980 to 2022 was 0.0015 C or 0.007 W/m2 ERF.

Summary of all greenhouse effect causes for temperature rise from 1980 until 2022:

Effect from water vapor increase: 0.37 C or 1.75 W/m2; 80.9% of total

Effect from rising CO2: 0.04C or 0.19 W/m2; 8.78% of total

Effect from rising Methane: 0.036 C or 0.17 W/m2, 7.86% of total

Effect from rising N2O: 0.0065 C or 0.031 W/m2 1.4% of total

Effect from rising Ozone: 0.0034C or 0.016 W/m2 0.7% of total

Effect from rising HFCs : 0.0015 C or 0.007 W/m2 0.3% of total

TOTAL TEMPERATURE CHANGE 1980 to 2022: 0.4544C or 2.164 W/m2

Conclusion

CO2 amounts to less than 10% if the temperature increase since 1980, and so does Methane. The green new deal is a pipe dream that does not solve the climate problem, but will make it worse.the price of lithium carbonate used in batteries has risen sixteen-fold between 2020 and late 2022. Since then, it has dropped to one third of its peak price. China has corned the market in Lithium for now. There is not enough Lithium to be economically and ecologically justifiable to mine to meet demand in the future. Since solar and wind power are intermittent supplier of electricity they can never be used as base supplier of energy. Other solutions must be offered

Actions to be taken

What congress is doing to solve the problem.

Congress has passed the anti-inflation bill that included over 300 billion to fight climate change, and it included more solar panels and wind turbine motors to be imported from China. The experience from Europe is that electricity from solar panels and windmills is 5.7 times as expensive as conventional power generation.

This analysis was done for 2019, before COVID. The situation is worse now, with electricity rares up to 80 c/kWh, topping $1 /kWh last winter in some countries before subsides.

Even at the current increased European Gas prices, the estimated excess expenditures on Weather-Dependent “Renewables” in Europe is still very large:  $0.5 trillion in capital expenditures and $1.2 trillion excess expenditures in the long-term.

These simple calculations show that any claim that Wind and Solar power are now cost competitive with conventional fossil fuel (Gas-fired) generation are patently false.  The figures give an outline of the financial achievements of Green activists in stopping  fracking for gas in Europe, close on to $1.2 trillion of excess costs.

It would be better not to import any solar panels and wind power generators from China and let them pay for the extra cost rather than building more coal burning plants. After all they were planning to build over a thousand new plants between now and 2030, all legal under the Paris accord. This would benefit the world climate much more, since Chinese coal plants are far more polluting, since China has far less stringent environmental regulations than U.S.

U.S. uses 13.5% of the world’s coal, and eliminating U.S. CO2 emissions would in time reduce the world temperature by 0.023C, providing no other country, such as China and India would increase their use of Coal, which they are, to the total of 1300 new coal plants between now and 2030. This would raise global temperature by more than 0.06 C.

What congress should do instead.

a. What congress should do immediately.

  1. Immediately stop downblending U 233 and pass The Thorium Energy security act SB 4242a. See more here.

2. Remove Thorium from the list of nuclear source material. The half-life of Thorium232 is 14 billion years, so its radioactivity is barely above background noise. More importantly, while Thorium is fertile, it is not fissile and should therefore not be included in the list. This would make it far easier to mine rare earth metals, as long as the ore consists of less than 0.05% Uranium, but any amount of Thorium is allowed without classifying the ore “Source material”.

3. Separate nuclear power into 3 categories. a. conventional nuclear power. b. Thorium breeder reactors that make more U233 than it consumes.c. Thorium reactors that reduce nuclear waste, and d. Plutonium and other trans uranium depletion reactors.

4. Stop buying solar panels from China. Stop buying wind turbine generators from China. Let them install those in China and pay 5 times as much for their electricity.

5. Immediately form a commission led by competent people, not politicians; to decide how to best expand the electric grid and to best harden it against electro-magnetic pulses, whether solar or nuclear and to safeguard it against sabotage.

6. Remove all subsidies on electric cars, solar panels and wind generators, but continue to encourage energy conservation.

7. Encourage research and development of Thorium fueled reactors, especially liquid salt reactors by drastically simplifying and speeding up the approval process. President Trump issued an executive order in the last month of his presidency EO 13972 specifying that the United States must sustain its ability to meet the energy requirements for its national defense and space exploration initiatives. The ability to use small modular reactors will help maintain and advance United States dominance and strategic leadership across the space and terrestrial domains. This EO should be expanded to include civilian small modular reactors, including Liquid salt Thorium reactors less than 200 MW, which are the only valid reactors for space exploration.

Appendix 1, CO2

The following chart shows both CO2 and H2O are absorbing greenhouse gases, with H20 being the stronger greenhouse gas, absorbing over a much wider spectrum, and they overlap for the most part. But it also matters in what frequency ranges they absorb.

For this we will have to look at the frequency ranges of the incoming solar radiation and the outgoing black body radiation of the earth. It is the latter that causes the greenhouse effect. Take a look at this chart:

The red area represents the observed amount of solar radiation that reaches the earth’s surface. the white area under the red line represents radiation absorbed in the atmosphere. Likewise, the blue area represents the outgoing black body radiation that is not absorbed. The remaining white area under the magenta, blue or black line represents the retained absorbed energy that causes the greenhouse effect.

Let us now take a look at the Carbon Dioxide bands of absorption, at 2.7, 4.3 and 15 μm. Of them the 2.7 and 4.3 μm bands absorb where there is little black body radiation, the only band that counts is at 14.9 μm, and that is in a band where the black body radiation is near its maximum. Let us first consider the CO2 alone in a dry atmosphere, that is one with no water vapor at all. We will investigate the concentration of 335 ppm (in 1980) and 415 ppm (in 2022)

The very top line of the top black band represents total absorption at 415 ppm, the bottom of the black black band represents absorption at 335 ppm. Divide the frequency spectrum in 3 parts, below 14 μm, 14-16 μm, and above 16 μm, In the 13 to 14 μm band 66% of available energy is absorbed at 335 ppm, 70% at 415 ppm. in the 14 to 16 μm band 100% of available energy is absorbed at both 335 and 415 ppm. In the > 16 μm the numbers are also 66 and 70%. In addition, temperature is 0.5 C higher at 415 than at 335 ppm, so available energy is 0.7 % higher at 415 ppm.

The net result is greenhouse gas contribution for CO2 is 5.10 C at 335 ppm and 5.26 C at 415 ppm and 1.5C higher ambient temperature for a dry atmosphere.

The normal way to account for greenhouse gasses contribution is to simply add together the CO2 contribution and the contribution from water vapor. This leads to the wrong result for in doing so, the total result is more than 100% for some energy band, because it is impossible to add more than 100% of all available energy for a given wavelength. Again, the spectrum of interest is 13 to 17.4 μm.

The first thing to notice is that no absorption exceeds 100% , so at 14.9 μm wavelength CO2 absorbed 100%, and water vapor absorbed another 75%, the total sum is still 100%. It is impossible to absorb more than 100% of the total energy available for that wavelength. Therefore between the wavelengths 14 and 16 μm all energy was absorbed regardless of CO2 concentration and water vapor concentration. The only fair way to allocate the absorption is proportionally, 57% to CO2 and 43% to water vapor. Likewise, the 13 to 14 μm band is not fully saturated, so the total absorption is 62% of available energy for CO2 and 33% for water vapor. In the 16 to 17.4 μm range the total absorption is 44% for CO2 and 55 % for water vapor. For CO2 at 335 ppm and average temp 13.5 C the total temperature rise, when proportionally allocated comes to 2.73 C for the CO2 and 2.30 C for the water vapor. For CO2 at 415 ppm and an average temp 0.5 C higher, at 14 C average the net temperature increase or ERF in the 13 to 17.4 μm band is 0.035C or +0.17 W/m2 for the water vapor and 0.04C or +0.19 W/m2 for the CO2.

Appendix 2, Methane

Atmospheric methane levels averaged 2.0 ppm (parts per million) during 2022, or around 25% greater than in 1980. It is a 28 times stronger greenhouse gas by itself unlike CO2, because its absorption is not saturated in the atmosphere. On the other hand the lifetime of Methane in the atmosphere is 10 to 15 years, some of the Methane eating bacteria will do its job. There is only one significant absorption band that absorbs in the atmospheric window at 7.7 μm, at the edge of the atmospheric window.

The picture shows a small peak at 7.7μm. This is because at lower wavelengths absorption from water vapor has nearly eliminated the CH4 contribution. Remember that total absorption can never exceed 100 %, so the maximum absorption from CH4 occurs at 7.7μm. At 1.6 ppm it amounts to a greenhouse effect of 0.68 C for a dry gas.

The only major absorption line at 7.7 μm has two side lobes, at 7.5 and 7.9 μm. In the 7.5 μm sideband water vapor already absorbs nearly all energy, so the NH4 is of little effect. In the 7.9 μm sideband water vapor is 50% saturated at that level and the NH4 net absorption is 20% the net greenhouse effect is one fifth of the effect for a dry gas, or 0.14 C. In 1980 the CH4 concentration was 1.6 ppm and will be 2.0 ppm in 2022 which results in an increase of the greenhouse effect of 0.035 C or 0.17 W/m2 ERF from rising levels of Methane since 1980

Appendix 3, N2O.

Atmospheric N2O levels averaged 336 ppb (parts per billion) during 2022, about and was 301 ppb in 1980. It is a 300 times stronger greenhouse gas than CO2 by itself, because its absorption is not saturated in the atmosphere. When water vapor is dominant it is diminished by over 70% since it is at the edges of the Atmospheric window. On the other hand the lifetime of N20 in the atmosphere is short and is typically greatest at 5 p.m. One of the major reasons for the N2O increase is the increase of fertilization with nitrates, the other is from diesel fumes from trains, boats, ships, trucks and mining equipment

The picture shows a double N2O peak at 7.4 and 7.8 μm. . At 0.336 ppm in 2022it amounts to a greenhouse effect of 0.325 C for a dry gas. In the 7.4 μm band water vapor is saturated, in the 7.8 μm band 80% is saturated by water vapor.In 1980 the N2O concentration was 0.3 ppm which results in an increase of the greenhouse effect of 0.0065 C or 0.031 W/m2 ERF from rising levels of N2O since 1980 .

N2O is commonly called laughing gas, and is hazardous in high concentrations, and should be limited in confined places, but in concentrations of under 1 ppm nobody laughs because of that.

Appendix 4, Ozone.

Ozone or 03 is good if it is in the stratosphere. There it helps to absorb the ultraviolet and cosmic rays from the sun and other cosmic radiation. Ozone is bad if it is near the ground. The total proportion of O3 in the troposphere is about 0.01 ppm, yet it is a substantial greenhouse gas because it forms by uv radiation in the stratosphere and mesosphere, and thus protecting us from uv damage. See figure:

The O3 in the troposphere on the other hand is bad. It is normally around 0.01 ppm, but is considered damaging if people are exposed to more than 0.08 ppm in an 8 hour period. This can happen in urban environments in warm and stagnant weather, typically through car traffic. It is a great greenhouse gas because its main absorption band is at 9.5 μm, right in the atmospheric window where the outgoing black body radiation is the greatest. See fig:

The dotted blue line at 9.5 μm represents the tropospheric absorption, the total absorption is between the brown and the solid blue line. The total greenhouse effect from O3 is 0.88C, but the stratosphere does not interact very much with the troposphere, so the stratospheric O3 does not count as a greenhouse gas, only tropospheric O3. The total contribution to the greenhouse effect from tropospheric O3 is about 1/5 of the total, because atmospheric O2 absorbs in the same band limits the temperature rise to 0.17C When the earth’s temperature rises by 0.5C, from 1980 to 2022, the amount of tropospheric O3 probably rises by 2% (Lacking good data I am guessing wildly, in urban areas it may be much more, but this is global average). This comes to 0.0035C temperature increase or 0.016 W/m2 ERF from O3, from 1980 to 2022.

Appendix 5, CFC gasses.

ChloroFluoroCarbon (CFC) gasses started to be manufactured at the beginning of the refrigeration age, replacing ice as the refrigerant. It soon appeared in the atmosphere, mostly due to leaks in the air conditioner compressor seals. It didn’t amount to much as a greenhouse gas even though it was five thousand times more efficient than CO2 as a greenhouse gas. It was discovered that CFCs ate up the Ozone in the stratosphere, and if it continued to increase it could deplete the protective Ozone layer faster than it could be produced. In fact it created an Ozone hole over Antarctica. So it got forbidden Jan 17, 1994, In 2020 even China stopped production. Since 1994 CFC are decreasing by about 1% per year, but cheating persisted, especially among poorer nations and China. By 2022 it will probably have a greenhouse effect of 0.01C or 0,05 W/m2 ERF.

Appendix 6, HFC gases.

CFC started to be phased out and replaced by HydroFluoroCarbons (HFC), less efficient and more expensive, but at least they do not deplete the Ozone layer that protects us from cancer. Some of the HFCs are even bigger greenhouse effect generators than CFC, but well worth it to protect the Ozone layer. Their biggest absorption bands are in the middle of the atmospheric window.

If nothing is done to control them they will increase from nothing in 1980 until 2022 and beyond. See fig: NOAA Research News

The temperature increase from 1980 to 2022 was 0.0014 C or 0.007 W/m2 ERF..

The connection between the Hebrides’ revival of 1949 and this year’s presidential election.

I have been praying for a revival for a few years, This time it is critical, and when it comes it will be worldwide thanks to the power of internet and what it means for both good and evil. It has enabled the spiritual warfare to increase to unprecedented levels. There was a time not long ago when people communicated with each other, went to church on Sunday and endured yet another sermon they had heard three years ago and it was time to preach it again according to the three year cycle, and not much happened, but there was a few people who prayed for a revival, such a one that had happened before in their youth. Such it was on the Lewis part of the island of Lewis and Harris in the outer Hebrides, and this short video will tell the story vividly. This was while Donald Trump was still president:

More than four years have passed, and the world is no longer the same. In 2020 the Abraham accords were signed, and we were looking for and anticipated transitioning into a time of peace. The opposite did indeed happen; the time was not yet ready for a revival. People were still asleep, not aware of the fullness of evil. The 2024 election is upon us, and we are still not fully aware of who the contestants really are, 28% of the people want to know more about Kamala Harris, but only 9% want to know more about Donald Trump. I didn’t know this about him until a few days ago, when I looked up Duncan Campbell and the1949 Hebrides’ revival, the beginning of which he vehemently denied he had originated. He claimed the revival had already started when he arrived, thanks to the two old ladies and the young Donald Smith.

Anyhow the Bible given to Donald Trump by his mother was used at the 2017 presidential. inauguration together with the 1861 Bible used by Abraham Lincoln at his taking the oath of office.

This is an example of the synergy of the ages .Two elderly shut-in ladies prayed for years for a revival, and nothing happened, but suddenly it did, and the effect lasts for generations

Pray for the revival. God uses the most unlikely characters to accomplish His purposes.

Check out https://www.baptist.org.uk/Articles/608089/The_Hebrides_Revival.aspx

Coal 2023. The US consumption is 5% of world total, China’s share is more than 11 times larger. Who are we kidding on the “climate crisis?”

The following content is sponsored by Range ETFs

World Coal Consumption by Region in 2023

Despite many nations transitioning away from fossil fuels, in 2023, world coal consumption reached a staggering 164 exajoules (EJ) of energy, a record high for any year.

For this graphic, Visual Capitalist has partnered with Range ETFs to explore the role coal plays in the global energy mix and determine which regions still consume large quantities of coal.

The Role of Coal in Global Energy

Coal is a significant player in the global energy mix, contributing 26% of the world’s energy in 2023, more than all non-fossil fuel sources combined. The only energy source that contributed more to the global energy mix was oil.

Here’s how that consumption breaks down by region:

RegionConsumption (1018 joules)Share %
China91.956.1%
Asia Pacific (excluding China)43.826.7%
Americas
10.06.1%
Europe8.45.1%
CIS*5.53.4%
Africa4.12.5%
Middle East0.40.2%
Total164.0100%

Coal consumption has decreased in many regions. For example, both North America and Europe reduced their energy consumption from coal by 16% in 2023. However, a heavy reliance on coal in the Asia Pacific region has led to global coal consumption remaining essentially the same over the past 10 years.

When I saw this statistics I immediately looked up: What is the U.S role in global coal consumption and found out it was 8.2 EJ om 2023 or 5.0% of world consumption.

China’s coal consumption is more than eleven times larger than the U.S Coal consumption. In fact, their appetite for mining coal is that they even mine coal with a noticeable Uranium content, and burn it without separating out the Uranium first, leading to severe health problems for the people downwind from the coal burning power plants. In addition, since scrubbing is expensive the operators have the scrubbers down for maintenance as often as they can get away with it.

China is also the world leader in cement production. In 2022 China produced 2,1 billion metric tons of cement, or 64% of the world total. By comparison, U.S. produced 95 million metric tons, or about 22 times less than China.

But where China has U.S and the rest of the world over a barrel is in the mining and production of rare earth metals. China mined 240,000 metric tons in 2023, or about 64% 0f the worlds total, but China is also the world’s largest importer of rare earth metal ore for refining. By comparison, US mined 43,000 metric tons, but most of it is still refined in China. The US regulatory environment makes it a slow process to get permits. China has strict export controls over who can be allowed to buy refined rare earth metals, and they always want a favor in return for doing so.

We have our work cut out for us. Right now we are too dependent on China to fully be able to sever our dependence on China.

Flaring off natural gas, a big carbon footprint with no benefits.

This is a satellite photo of a mostly clear night over U.S. (There are a few clouds over eastern U.S.) It shows clearly where the big cities are, and how empty the western half of U.S. is compared to the eastern half. From this we can see and guess the size of the major metropolitan areas. Looking over North Dakota there seems to be a city of about half a million people judging from the light. But North Dakota has no big cities! What is going on?

The light area below is here_______V______________________________________________

While North Dakota is the second largest oil producing state in the nation it produces very little natural gas, only what comes as a bi-product of oil recovery, in fact it is so little that the government has let the oil companies flare off the gas rather than recover it and us it for supplying the country with more natural gas. Since the government has put a halt to build the Keystone and other pipelines, the oil out of these wells are shipped by truck and train to refineries mostly in Texas at at least three times the cost (read energy usage) of a pipeline, the government is not concerned about energy usage, only control of the production means. Granted it is only a pittance in the grand scheme of energy use, only 291 million cubic feet of natural gas was officially flared off per day in Oct 2023, but it is growing as oil production is climbing.

How much is 291 million cubic feet of natural per day that is flared off? It corresponds to a little over 300 billion BTU/day, not much, but enough to supply gas for over 5 million gas stoves in normal family use. The Government is trying to prohibit any new gas stoves in new construction. This again proves that their main concern is not energy use, since it is o.k. to flare off large amounts of gas but not using it for superior cooking, it shows that their concern is people control, not energy conservation or even common sense.

Pfizer knew 2 1/2 months after emergency authorization of COVID-19 vaccine how deadly and debilitating it was. It should have been taken off the market no later than May 21, 2021.

Moderna invented a new way of making vaccines in late 2010’s and Pfizer did likewise. It got patented. All they had to do was to wait for the right pandemic, prophesied by Anthony Fauci in the beginning of Trump’s presidency: He will have to deal with a “surprise outbreak”. The opportunity came with the outbreak of COVID-19, and within 10 days Pfizer and Moderna had a suggested vaccine ready to be mass produced. President Trump jumped at the opportunity to develop it at “warp speed” by promising to buy the first few million doses whether they worked or not. To further speed it up they skipped the animal steps and went directly to human subjects, whether pregnant or not. The initial few months looked promising, so one week after the 2020 election the vaccine was approved for emergency use. (It takes 9 months to complete a pregnancy). The first doses were administered mid December , and the VAERS results were evaluated, and Pfizer compiled the data up to Feb 28 2021. The results were publicized internally Apr 30, 2021 and subsequently shared with the White House senior staff, including the Surgeon General. The White House freaked out and held a number of emergency meetings, and May 21 published comforting words that there was nothing to be afraid of, the vaccine is working perfectly as designed.

Be that as it may, here is the Pfizer report as of Apr 30 2021.

Why Thorium? 37. China has approved the commissioning of a thorium-based molten salt nuclear reactor. The Cat is out of the bag.

The reactor, known as “Thorium Molten Salt Reactor – Liquid Fuel 1 (TMSR-LF1)“, began construction in 2018 in Wuwei City, Gansu Province, by the Hongshagan Industrial Cluster.

The TMSR-LF1 reactor is an experimental liquid fluorinated thorium reactor using a LiF-BeF2 -ZrF4 -UF4 [+ThF4] fuel salt mixture and a LiF-BeF2 coolant salt. It runs on a combination of thorium (about 50 kg) and uranium-235, enriched to 19.75%, and can operate at a maximum temperature of 650°C for up to 10 years. The liquid fuel design is based on the molten salt reactor experiment conducted in the 1960s by the Oak Ridge National Laboratory in Tennessee, USA.

With this authorization, China has become the first country to take a significant step towards harnessing the power of thorium for clean, large-scale energy generation in over 50 years.

“From Reuters in Dec 2013: “China has enlisted a storied partner for its thorium push: Oak Ridge National Laboratory. The U.S. government institute produced the plutonium used for the Manhattan Project and laid important groundwork for the commercial and military use of nuclear power.

The Tennessee lab, as it happens, helped pioneer thorium reactors. The Pentagon and the energy industry later sidelined this technology in favor of uranium, (it didn’t produce Plutonium 239.) The Chinese are now enthusiastically tapping that know-how, in an example of how the rising Asian superpower is scouring the world for all sorts of technology needed to catch up to America in a broad array of scientific fields.

Thorium’s chief allure is that it is a potentially far safer fuel for civilian power plants than is uranium. But the element also has possible military applications as an energy source in naval vessels. A U.S. congressman unsuccessfully sought to push the Pentagon to embrace the technology in 2009, and British naval officers are recommending a design for a thorium-fueled ship.

In a further twist, despite the mounting strategic rivalry with China, there has been little or no protest in the United States over Oak Ridge’s nuclear-energy cooperation with China.

“The U.S. government seems to welcome Chinese scientists into Department of Energy labs with open arms,” says physicist and thorium advocate Robert Hargraves. He and other experts note that most of the U.S. intellectual property related to thorium is already in the public domain. At a time when the U.S. government is spending very little on advanced reactor research, they believe China’s experiments may yield a breakthrough that provides an alternative to the massive consumption of fossil fuels.

The technology’s immediate appeal for China, both Chinese and American scientists say, is that thorium reactors have the potential to be much more efficient, safer and cleaner than most in service today.

The Chinese plan to cool their experimental reactors with molten salts. This is sharply different from the pressurized water-cooling systems used in most uranium-fueled nuclear plants. The risks of explosions and meltdowns are lower, proponents say.

“If a thorium, molten-salt reactor can be successfully developed, it will remove all fears about nuclear energy,” says Fang Jinqing, a retired nuclear researcher at the China Institute of Atomic Energy. “The technology works in theory, and it may have the potential to reshape the nuclear power landscape, but there are a lot of technical challenges.”

Other advocates agree on thorium’s peaceful promise. Republican Senator Orrin Hatch and Senate Majority Leader Harry Reid, a Democrat, introduced legislation in 2010 calling on the U.S. government to share its thorium expertise.” The bill failed, leaving Oak ridge labs to look for other sponsors. That was in 2013.

What China has done is to turn the nuclear clock back to the mid-1960s, when Oak Ridge successfully operated a reactor with fuel derived from thorium and cooled with molten salts. The lab also produced detailed plans for a commercial-scale power plant, which was then shared with the Chinese.

If successful, TMSR-LF1 would open the door to developing and constructing a demonstration facility with an output of 373 MWt by 2030 and could lead to the construction of a TMSR fuel salt batch pyroprocessing demonstration facility, which would enable the utilization of the thorium-uranium cycle in the early 2040s.

Top view of a thorium molten salt reactor

What did I mean by “The Cat is out of the bag”? Only that molten salt Thorium reactors are breeder reactors that can produce more U233 than is used, and if U 233 is stolen, it can be used to make nuclear bombs, like Plutonium 239 is used for nuclear bombs. Nobody has done it yet, and it is more difficult to do than with Plutonium, but it is possible. However Uranium 233 contains 0.02% Uranium 232, which is used as a tracer in chemical processes, so U 233 is easy to trace.

The race is on, there is no stopping it now!