The 6th IPCC assessment report still suffers from the same fatal flaw that was in the first assessment report regarding greenhouse gases. It assumes greenhouse gases are additive, when in fact it is impossible to absorb more than all energy emitted for any given energy band! With that obvious fact in mind I will present the real greenhouse effect and its rise from 1775 to 2050. Nitrogen concentration staying constant, Oxygen concentration staying constant, Water vapor increasing 10% assuming relative humidity staying constant and average temperature increasing 1.5 C, CO2 rising from 280 ppm to 460 ppm, Methane from 0.725 ppm to 1.9 ppm, N2O from 0.27 ppm to 0.32 ppm, Ozone holding steady, since I do not have any worldwide concentration trends for it, and finally the man-made greenhouse gasses CFCs and HFCs.
The real temperature increase from 1776 to 2050 from greenhouse gases increase.
The greenhouse effect of Nitrogen.
Nitrogen is the most abundant gas in the atmosphere, consisting of 75 to 77% of all the air dependent on humidity. It has a small absorption band at 4.29 micrometer and another way out in the far infrared region where earth emission is negligible In the 4.29 range water vapor absorption is about 90% of available energy, and we only include the 2.2% increase coming from the 1.5 C temperature increase, so the net greenhouse effect is 0.11 * 0,1 * 0,022 w/m2, or about 0.0002 W/m2, not enough to care about.
The greenhouse effect of Oxygen.
Oxygen is the second most abundant gas with a concentration of about 21% in the atmosphere, but unlike Nitrogen it has a strong absorption band right in the middle of the atmospheric window. see picture:
The greenhouse effect of the Oxygen band at 9.4 micrometer is 1.2 C and the increase in greenhouse effect when temperature rises 1.5 C is 0.026 C in the tropics and 0.003 C at the poles due to their lower water content.
The greenhouse effect of Argon.
Argon is nearly 1% of the atmosphere, bur since it is a noble gas and absorbs in lines rather than bands, and there are no strong absorption lines in the infrared region it is not a factor.
The greenhouse effect of water vapor.
During the little ice age the earth was significantly colder than today, but there was special factors that led to this: The Maunder solar minimum and two super novas, one discovered in 1572 by Tycho Brave and the other in 1604 by Kepler.
I will begin the time of industrialization with the invention of the steam engine 1775 by James Watt. While not the original inventor he improved it so much that it became in common use for power generation. Up to that time people had depended on water and wind power and in a few cases tidal power. This increased the use of coal, which up to that point had been used exclusively for heating.
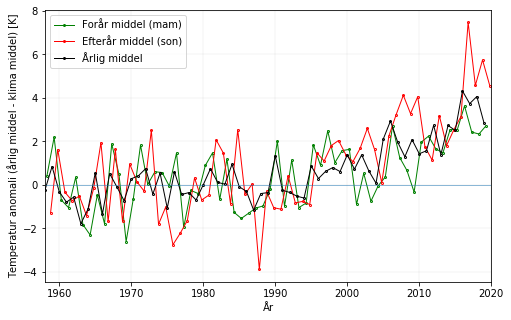
Since 1775 the global temperature of the earth has increased by about 1.2 C and is expected to increase another 0.3C by 2050.
When global temperature increases 1.5 degrees and relative humidity stays the same there will be 10% more water vapor in the air. How much of the temperature rise is attributable to a 10% increase in water vapor?
To answer that we must take a look at the greenhouse effect. Without it the earth would be an ice ball with an average temperature about 33C cooler than today. The earth can be considered a black body that obeys laws for black body radiation, the Stefan–Boltzmann law that states that the total energy radiation is proportional to the fourth power of the absolute temperature (Kelvin), so an increase in global temp from 13C t0 14.5C results in an increase of 2.11% in the total greenhouse effect.
To sum it up: Since water vapor is fundamental I will count it first, and the effect of all the other greenhouse gases will be included later, remembering that the total absorption in any frequency band can never exceed 100% of available energy. The increase of absorption occurs in the atmospheric window, Together, they make up 90% of the greenhouse gas temperature rise, or 29.7 degree C. When global temperatures increase by 1,5 C there will be 10% more water water vapor assuming relative humidity will stay constant, there will be an additional 0.65 C temperature rise.
The greenhouse effect of CO2.
The following chart shows both CO2 and H2O are absorbing greenhouse gases, with H20 being the stronger greenhouse gas, absorbing over a much wider spectrum, and they overlap for the most part. But it also matters in what frequency ranges they absorb.

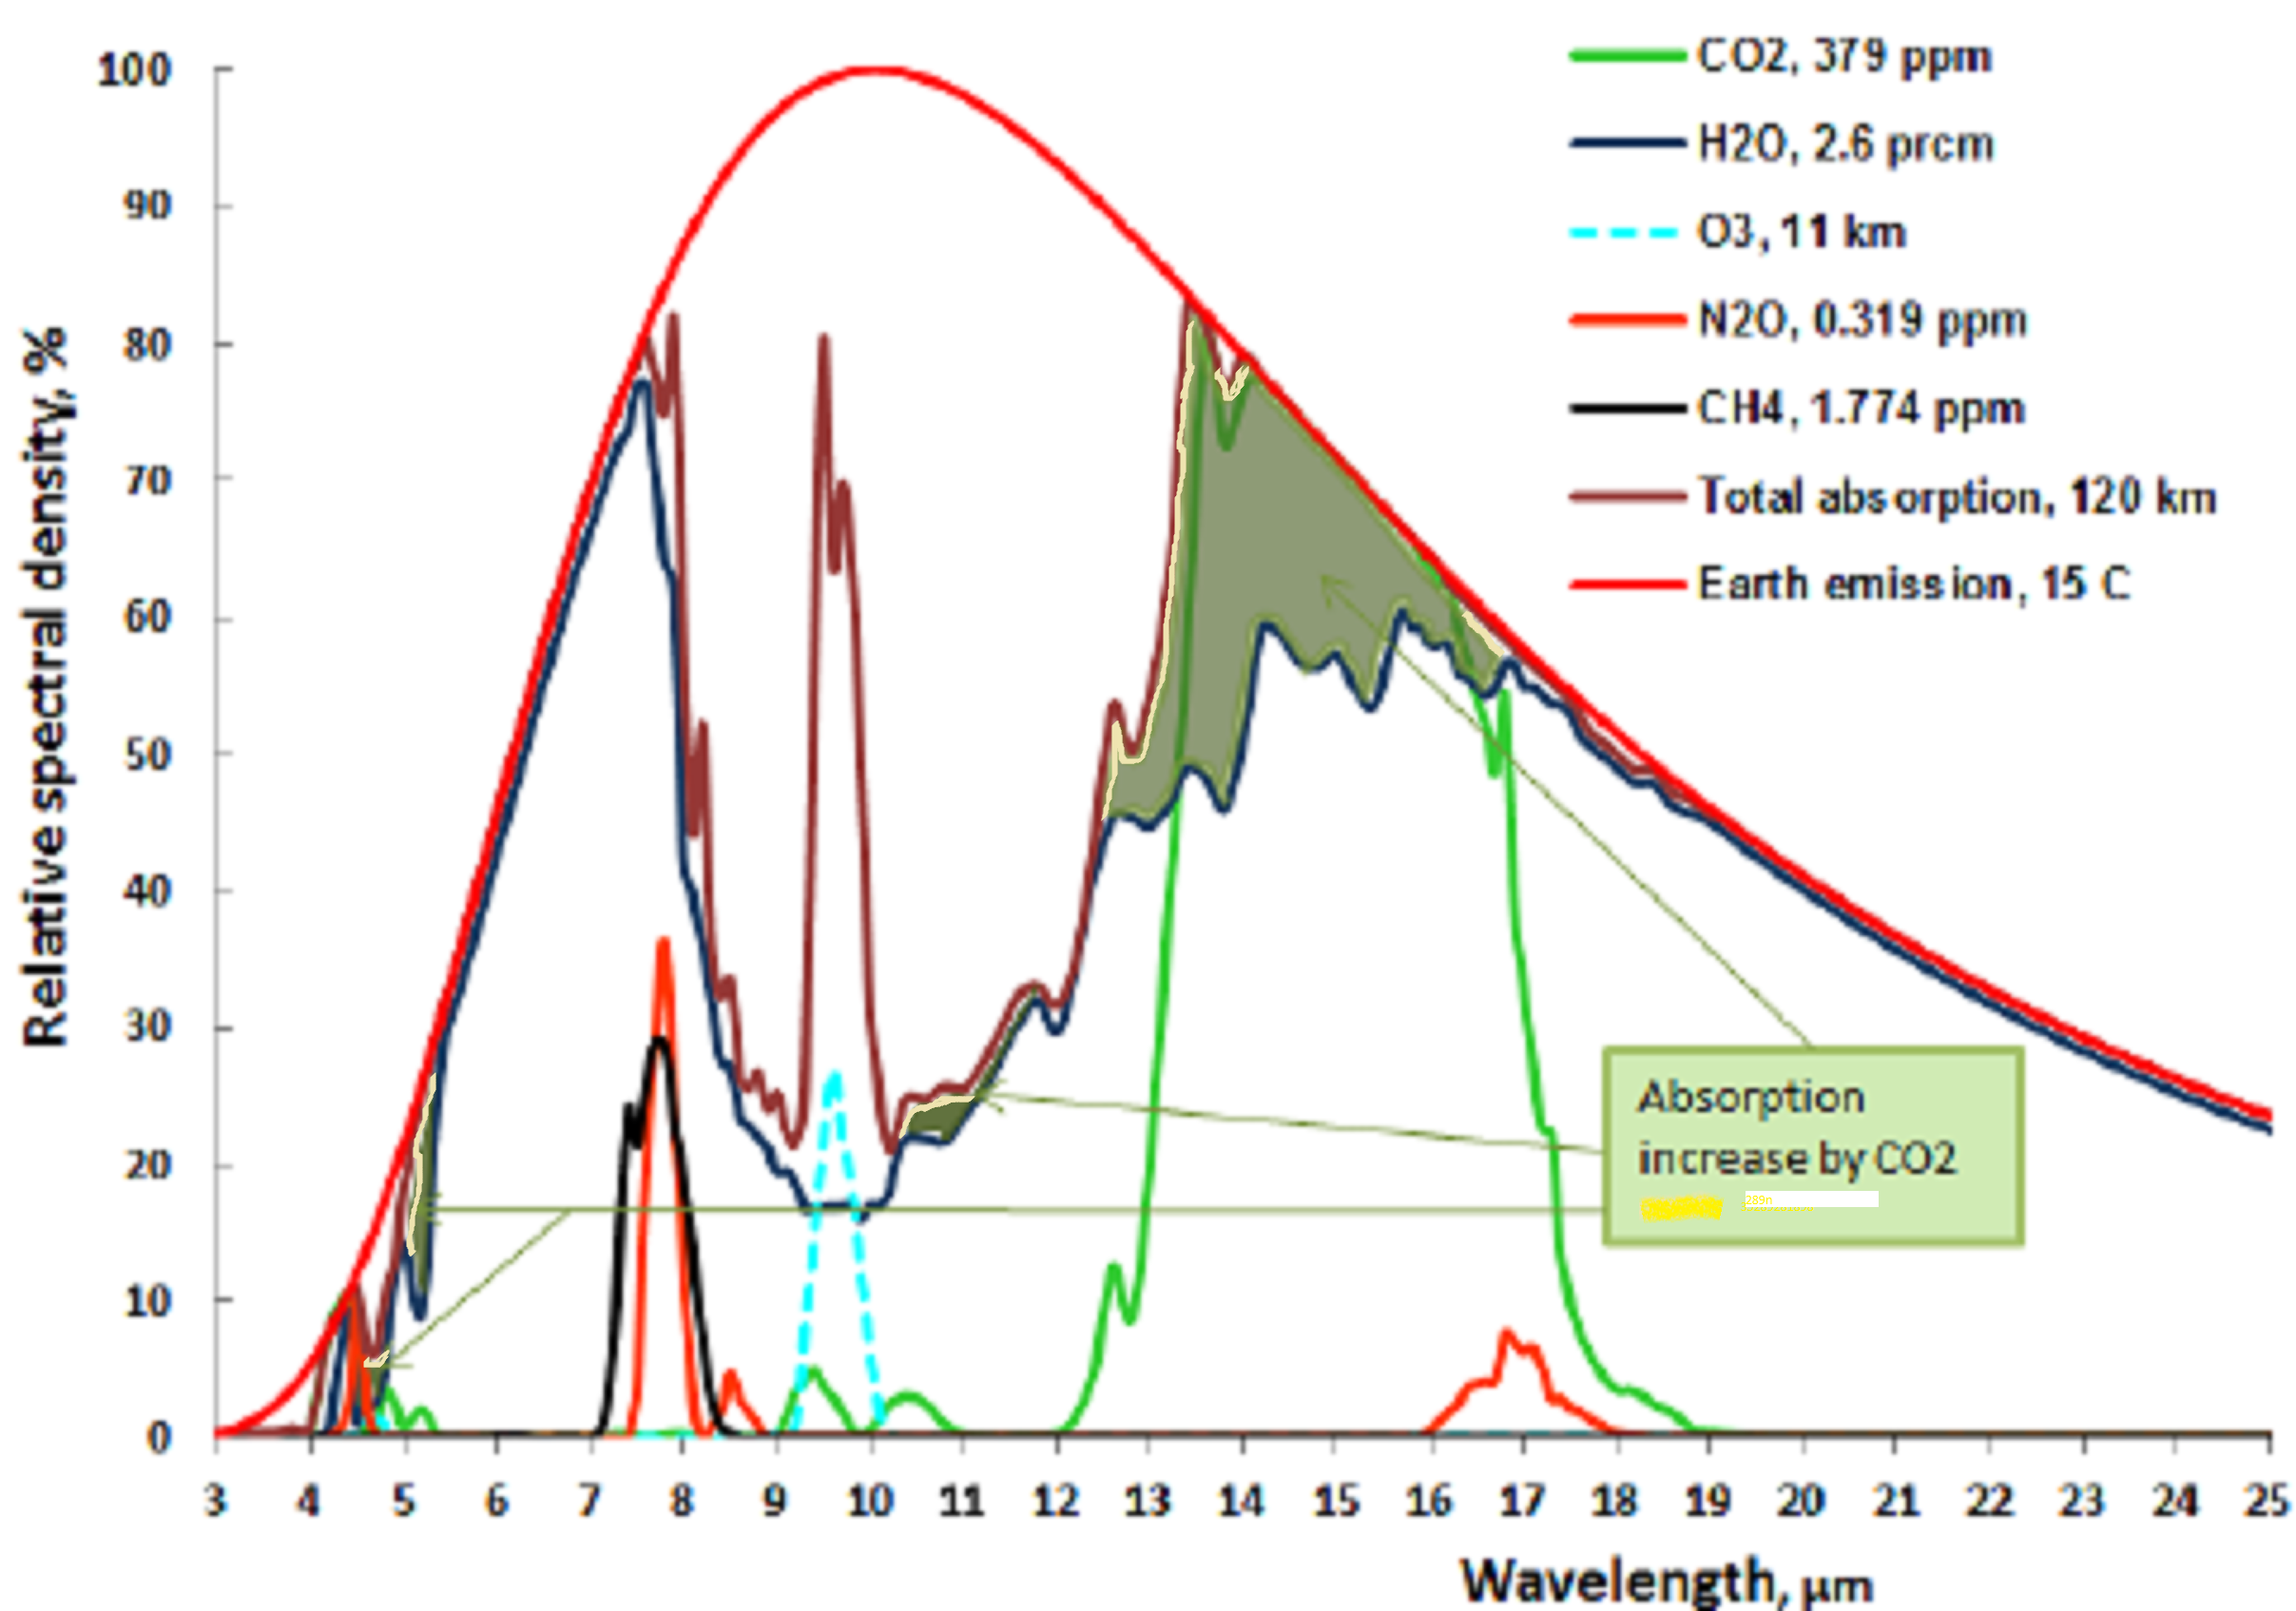
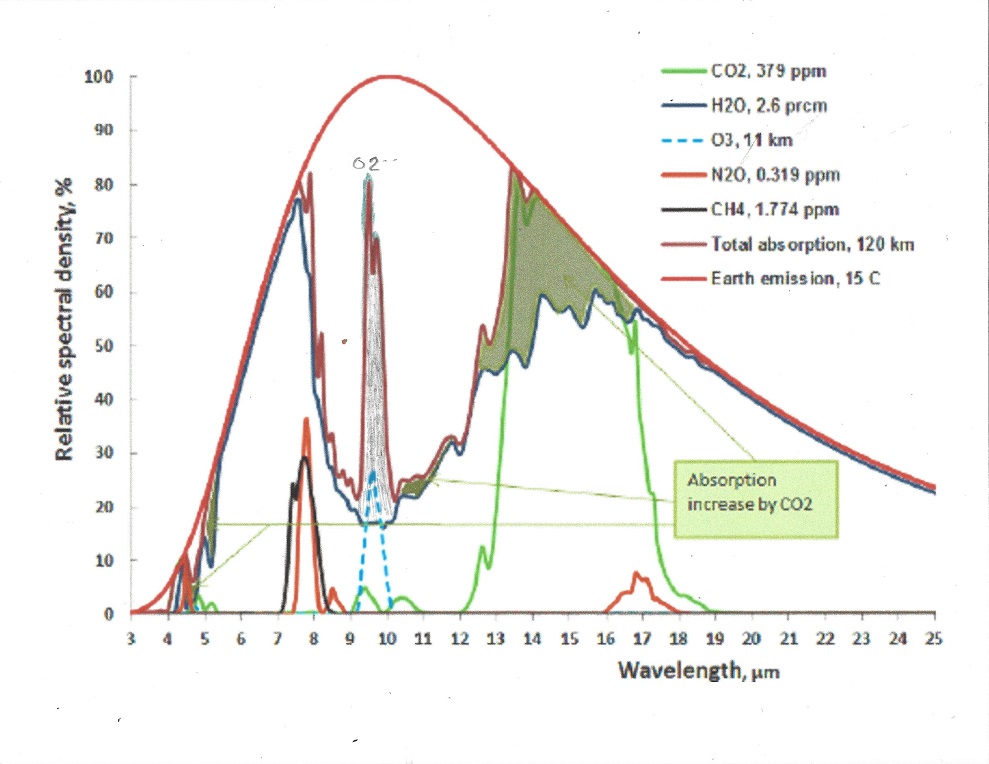
For this we will have to look at the frequency ranges of the incoming solar radiation and the outgoing black body radiation of the earth. It is the latter that causes the greenhouse effect. Take a look at this chart:

The red area represents the observed amount of solar radiation that reaches the earth’s surface. the white area under the red line represents radiation absorbed in the atmosphere. Likewise, the blue area represents the outgoing black body radiation that is not absorbed. The remaining white area under the magenta, blue or black line represents the retained absorbed energy that causes the greenhouse effect.
Let us now take a look at the Carbon Dioxide bands of absorption, at 2.7, 4.3 and 15 μm. Of them the 2.7 and 4.3 μm bands absorb where there is little black body radiation, the only band that counts is at 14.9 μm, and that is in a band where the black body radiation is near its maximum. Let us first consider the CO2 alone in a dry atmosphere, that is one with no water vapor at all. We will investigate the concentration of 280 ppm (in 1775) and 460 ppm (in 2050)

The very top line of the top black band represents total absorption at 460 ppm, the bottom of the black black band represents absorption at 280 ppm. Divide the frequency spectrum in 3 parts, below 14 μm, 14-16 μm, and above 16 μm, In the 13 to 14 μm band 65% of available energy is absorbed at 280 ppm, 71% at 460 ppm. in the 14 to 16 μm band 100% of available energy is absorbed at both 280 and 460 ppm. In the > 16 μm the numbers are also 65 and 71%. In addition, temperature is 1.5 C higher at 460 than at 280 ppm, so available energy is 2.2 % higher at 460 ppm.
The net result is greenhouse gas contribution for CO2 is 5.0 C at 280 ppm and 5.34 C at 460 ppm and 1.5C higher ambient temperature for a dry atmosphere.
The normal way to account for greenhouse gasses contribution is to simply add together the CO2 contribution and the contribution from water vapor. This leads to the wrong result for in doing so, the total result is more than 100% for some energy band, because it is impossible to add more than 100% of all available energy for a given wavelength. Again, the spectrum of interest is 13 to 17.4 μm.
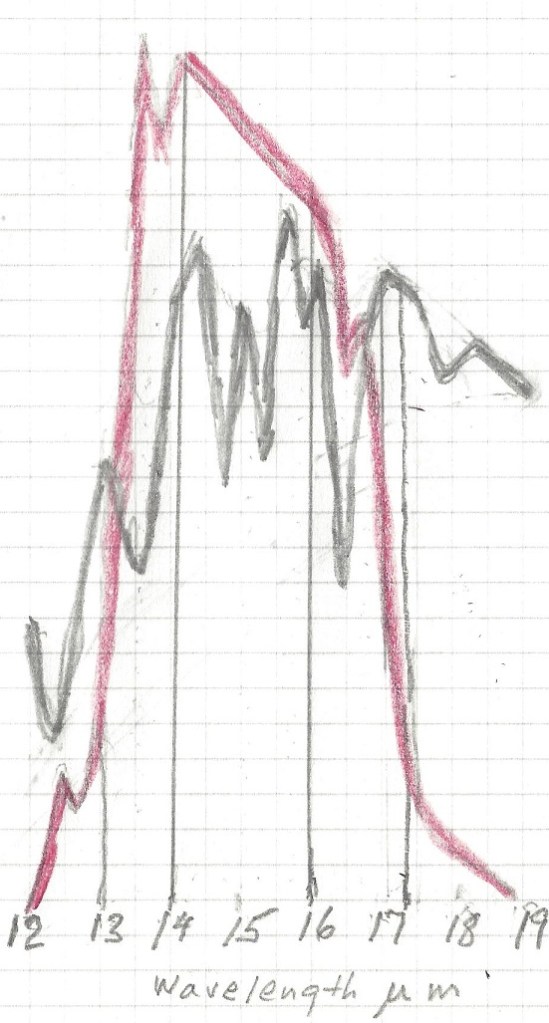
The first thing to notice is that no absorption exceeds 100% , so at 14.9 μm wavelength CO2 absorbed 100%, and water vapor absorbed another 75%, the total sum is still 100%. It is impossible to absorb more than 100% of the total energy available for that wavelength. Therefore between the wavelengths 14 and 16 μm all energy was absorbed regardless of CO2 concentration and water vapor concentration. The only fair way to allocate the absorption is proportionally, 57% to CO2 and 43% to water vapor. Likewise, the 13 to 14 μm band is not fully saturated, so the total absorption is 62% of available energy for CO2 and 33% for water vapor. In the 16 to 17.4 μm range the total absorption is 44% for CO2 and 55 % for water vapor. For CO2 at 280 ppm and average temp 13C the total temperature rise, when proportionally allocated comes to 2.73 C for the CO2 and 2.30 C for the water vapor. For CO2 ar 460 ppm and an average temp 1.5 C higher, at 14.5 C average the net temperature increase in the 13 to 17.4 μm band is 0.11C for the water vapor and also 0.11C for the CO2.
The greenhouse effect of Methane.
Atmospheric methane levels averaged 1,895.7 ppb (parts per billion) during 2021, or around 162% greater than at pre-industrial levels. It is a 28 times stronger greenhouse gas by itself unlike CO2, because its absorption is not saturated in the atmosphere. On the other hand the lifetime of Methane in the atmosphere is 10 to 15 years, some of the Methane eating bacteria will do its job. There is only one significant absorption band that absorbs in the black body emission spectrum, at 7.7 μm.
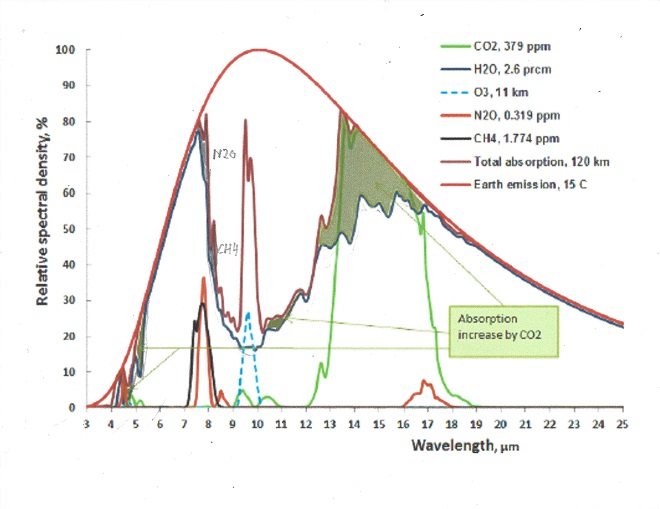
The picture shows a small peak at 7.7μm. This is because at lower wavelengths absorption from water vapor has nearly eliminated the CH4 contribution. Remember that total absorption can never exceed 100 %, so the maximum absorption from CH4 occurs at 7.7μm. At 1.8 ppm it amounts to a greenhouse effect of 0.80 C for a dry gas.
The only major absorption line at 7.7 μm has two side lobes, at 7.5 and 7.9 μm. In the 7.5 μm sideband water vapor already absorbs nearly all energy, so the NH4 is of little effect. In the 7.9 μm sideband water vapor is 60% saturated at that level and the NH4 net absorption is 20% the net greenhouse effect is one sixth of the effect for a dry gas, or 0.13 C. Before industrialization the CH4 concentration was 0.725 ppm and will be 2.13 ppm in 2050 which results in an increase of the greenhouse effect of 0.1C from rising levels of Methane since 1775.
The greenhouse effect of N2O.
Atmospheric N2O levels averaged 310 ppb (parts per billion) during 2021, about 19 % greater than at pre-industrial levels. It is a 300 times stronger greenhouse gas than CO2 by itself, because its absorption is not saturated in the atmosphere. When water vapor is dominant it is diminished by over 70% since it is at the edges of the Atmospheric window. On the other hand the lifetime of N20 in the atmosphere is short and is typically greatest at 5 p.m. One of the major reasons for the N2O increase is the increase of fertilization with nitrates, the other is from diesel fumes from trains, boats, ships, trucks and mining equipment
The picture shows a double N2O peak at 7.4 and 7.8 μm. . At 0.32 ppm in 2050 it amounts to a greenhouse effect of 0.31 C for a dry gas. In the 7.4 μm band water vapor is saturated, in the 7.8 μm band 80% is saturated by water vapor.Before industrialization the N2O concentration was 0.27 ppm which results in an increase of the greenhouse effect of 0.005 C from rising levels of N2O since before industrialization .
N2O is commonly called laughing gas, and is hazardous in high concentrations, and should be limited in confined places, but in concentrations of under 1 ppm nobody laughs because of that.
The greenhouse effect of Ozone.
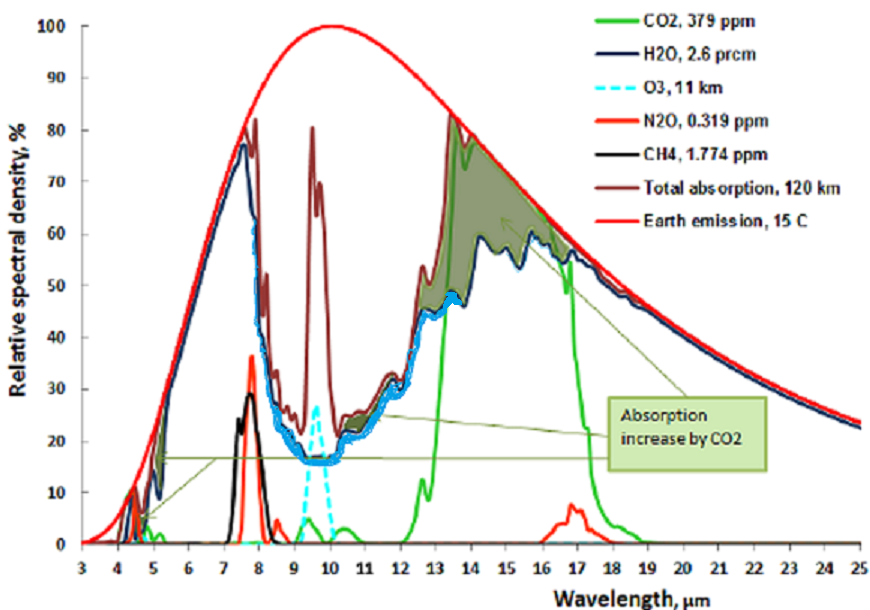
Ozone or 03 is good if it is in the stratosphere. There it helps to absorb the ultraviolet and cosmic rays from the sun and other cosmic radiation. Ozone is bad if it is near the ground. The total proportion of O3 in the troposphere is about 0.01 ppm, yet it is a substantial greenhouse gas because it forms by uv radiation in the stratosphere and mesosphere, and thus protecting us from uv damage. See figure:
The O3 in the troposphere on the other hand is bad. It is normally around 0.01 ppm, but is considered damaging if people are exposed to more than 0.08 ppm in an 8 hour period. This can happen in urban environments in warm and stagnant weather, typically through car traffic. It is a great greenhouse gas because its main absorption band is at 9.5 μm, right in the atmospheric window where the outgoing black body radiation is the greatest. See fig:
The dotted blue line at 9.5 microns represents the tropospheric absorption, the total absorption is between the brown and the solid blue line. The total greenhouse effect from O3 is 0.88C, but the stratosphere does not interact very much with the troposphere, so the stratospheric O3 does not count as a greenhouse gas, only tropospheric O3. The total contribution to the greenhouse effect from tropospheric O3 is about 1/6 of the total, or 0.15C. When the earth’s temperature rises by 1.5C, from pre-industrial times to 2050, the amount of tropospheric O3 probably rises by 3% (Lacking good data I am guessing wildly, in urban areas it may be much more, but this is global average). This comes to 0.005C temperature increase from O3, from pre-industrial times until 2050.
The greenhouse effect of CFC gasses.
ChloroFluoroCarbon (CFC) gasses started to be manufactured at the beginning of the refrigeration age, replacing ice as the refrigerant. It soon appeared in the atmosphere, mostly due to leaks in the air conditioner compressor seals. It didn’t amount to much as a greenhouse gas even though it was five thousand times more efficient than CO2 as a greenhouse gas. It was discovered that CFCs ate up the Ozone in the stratosphere, and if it continued to increase it could deplete the protective Ozone layer faster than it could be produced. In fact it created an Ozone hole over Antarctica. So it got forbidden. Since then CFC are decreasing by about 1% per year, but there is still cheating, especially among poorer nations and China. By 2050 it will probably have a greenhouse effect of 0.01C
The greenhouse effect of HFC gasses.
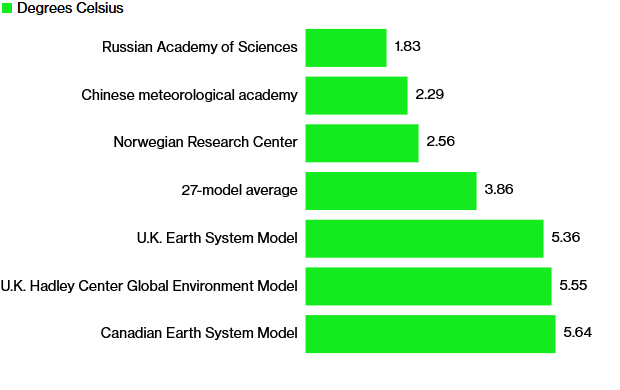
CFC started to be phased out and replaced by HydroFluoroCarbons (HFC), less efficient and more expensive, but at least they do not deplete the Ozone layer that protects us from cancer. Some of the HFCs are even bigger greenhouse effect generators than CFC, but well worth it to protect the Ozone layer. If e dont do anything they will increase drastically from now until 2050. See fig: NOAA Research News
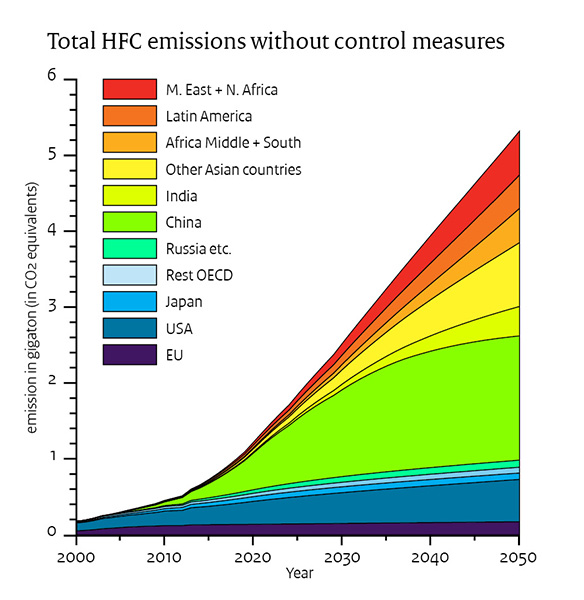
If we assume worst case scenario; no control measures, the temperature increase will be 0.06 C by 2050.
Summary of greenhouse gases, their size in 1775 and increase until 2050.
Gas,………………temperature……Increase 1775 – 2950. ………………………..contribution C
N2…………………0………………………………….0
O2………………….0.026………………………….0.003
Argon……………0…………………………………0
Water vapor..29.4………………………………0.65
CO2………………2.73……………………………..0.11
CH4……………..0.16………………………………0.10
N2O……………..0.03……………………………….0.005
O3……………….0.15……………………………….0.005
CFC………………..0……………………………………….0.01
HFC……………….0……………………………………….0.06
Total ……..….32.496……………………………..0.916
The CO2 contribution to the greenhouse effect increase is less than 12% of the greenhouse effect. Even if the multiplier effect from water vapor is included it is less than 24%.