It’s time for the annual Earth day
to celebrate Lenin’s old birthday.
Less “carbon pollution”
is not the solution.
Plant trees and clean up! Don’t call mayday.
We are called to be good stewards of the Earth, and strive to leave it a better place than we entered it.
To do a good cleanup job takes energy. That is true for the whole Eco-system as well as the toilet bowl.
All our energy comes from the Sun in one way or another, except for nuclear energy. If the cosmic radiation changes, the total energy output from the sun changes or our polar orbit changes, all of these factors will lead to climate change. The normal state for the earth is an ice-age, interrupted by shorter warm periods. We are now at the bog-building phase of an interglacial period, which means, the next phase is another ice-age. This warm period is unique since we are experiencing rapidly increasing levels of CO2. Will that cause a rise in temperatures rendering the earth uninhabitable, or will it prolong the warm period, or -will it hasten the arrival of the next ice-age?
The political class has made the decision increasing CO2 is bad, leading to thermal runaway and they base this on climate models that assumes a logarithmic response of the effect of rising CO2 levels, coupled with a gain, since absolute humidity also rises with temperature, and since water vapor is a much stronger greenhouse gas than CO2, there must be a strong gain in the system. In so doing they are the true Climate Change Deniers, since they deny the strong negative feedback from changing clouds and thunderstorms.
There is a group of people that deny Climate Change has anything to do with human activity, and all that happens is what has always been: Climate changes over time. This too is too simplistic.
The third group, Climate Change Scientists, try to observe what is really going on apart from models, to get a grip on which way Climate is changing. We now have enough data that a scientific approach can be taken by looking at data.
1. The Antarctic ice-sheet is at new record levels for this time of the year, 28th 2015 Daily Record for the Antarctic – 1.8 million square kilometers above the 1981-2010 mean.

2. The arctic ice-mass is no longer shrinking, but stabilizing.
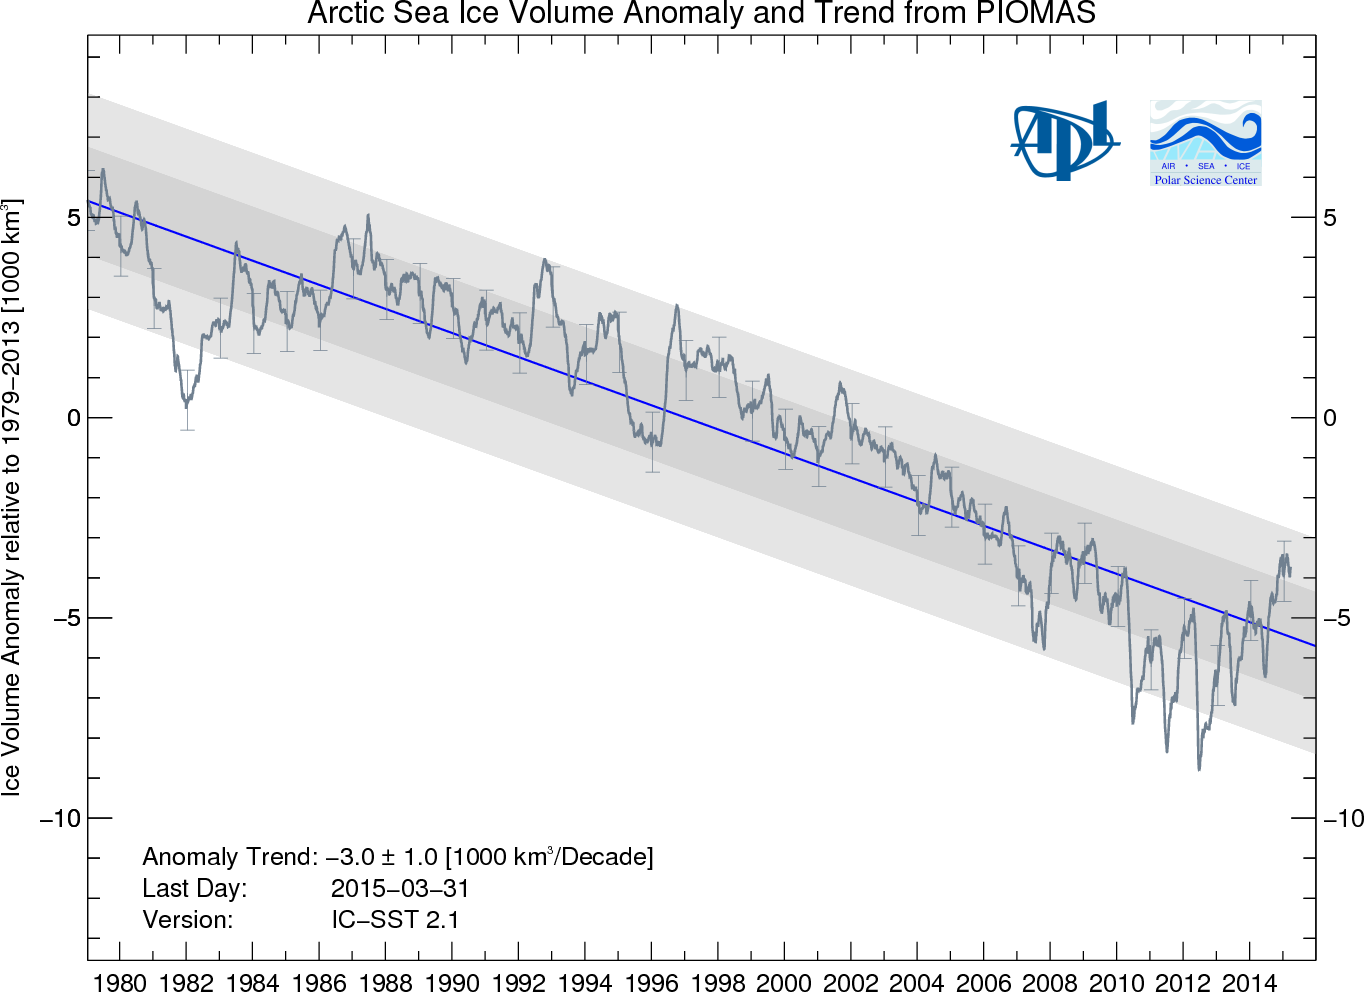
The trend line has been broken since 2011, and ice mass is increasing again (for now). Ice mass is a lagging indicator, so a better concurrent indicator is point 4.
3. The Greenland ice-mass has stopped shrinking, and is now increasing.
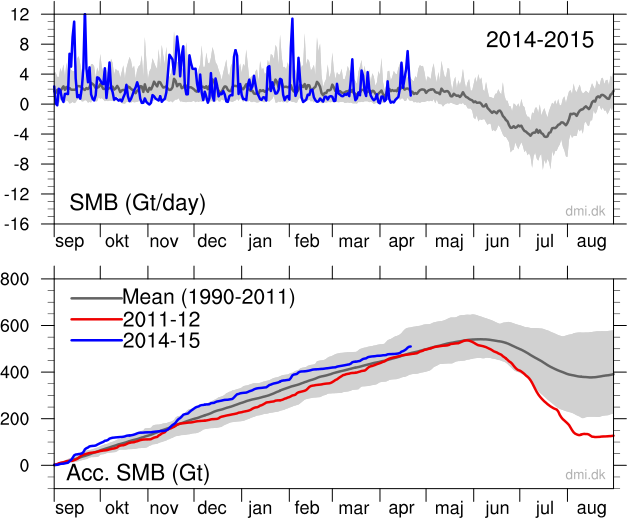
This chart needs some explanation. The total ice mass of Greenland is about 2.85 million Gt. The changes so far this season is an accumulation of about 500 Gt. This will partially melt away during summer, and some ice will be lost through calving, so the net loss of ice has been about 200 Gt per year, at which rate all the ice might be lost in 14250 years. 2014 was the first year in a long time Greenland added ice, and the 2015 season is following the same pattern.
4. The Arctic snow-cap maximum is again increasing, and has been increasing since 1990.

But that is not really the story. The snow-cap is increasing earlier. Here is the November snow-cap:
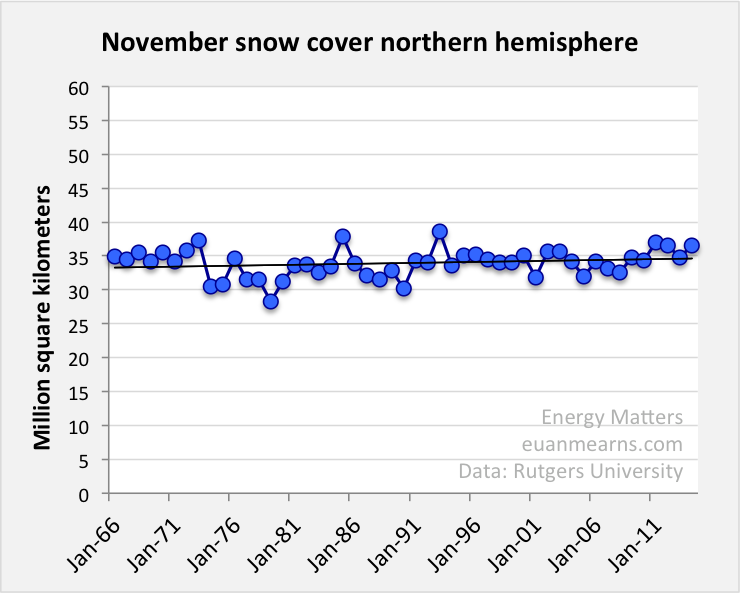
This chart shows an increase so the snow comes earlier and earlier.
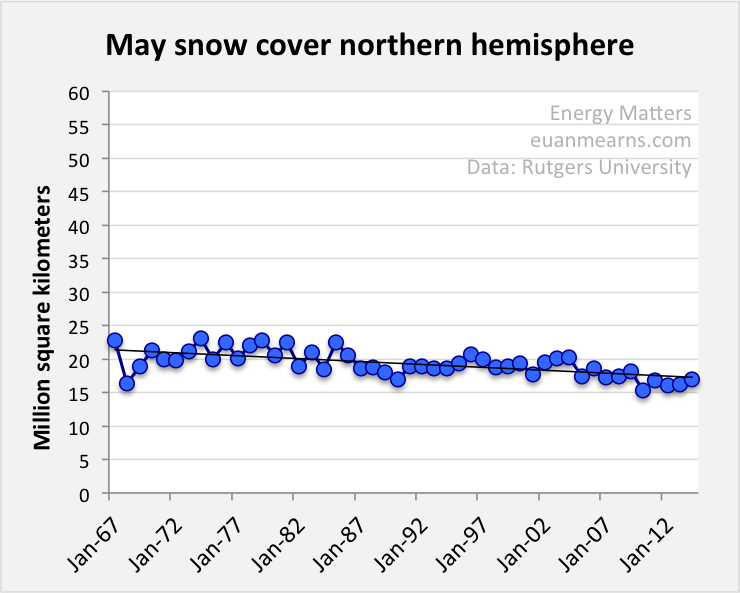
We can also see the snow is melting faster and faster. Why is that. Which brings us to point
5. The changing albedo of the ice and snow cap.
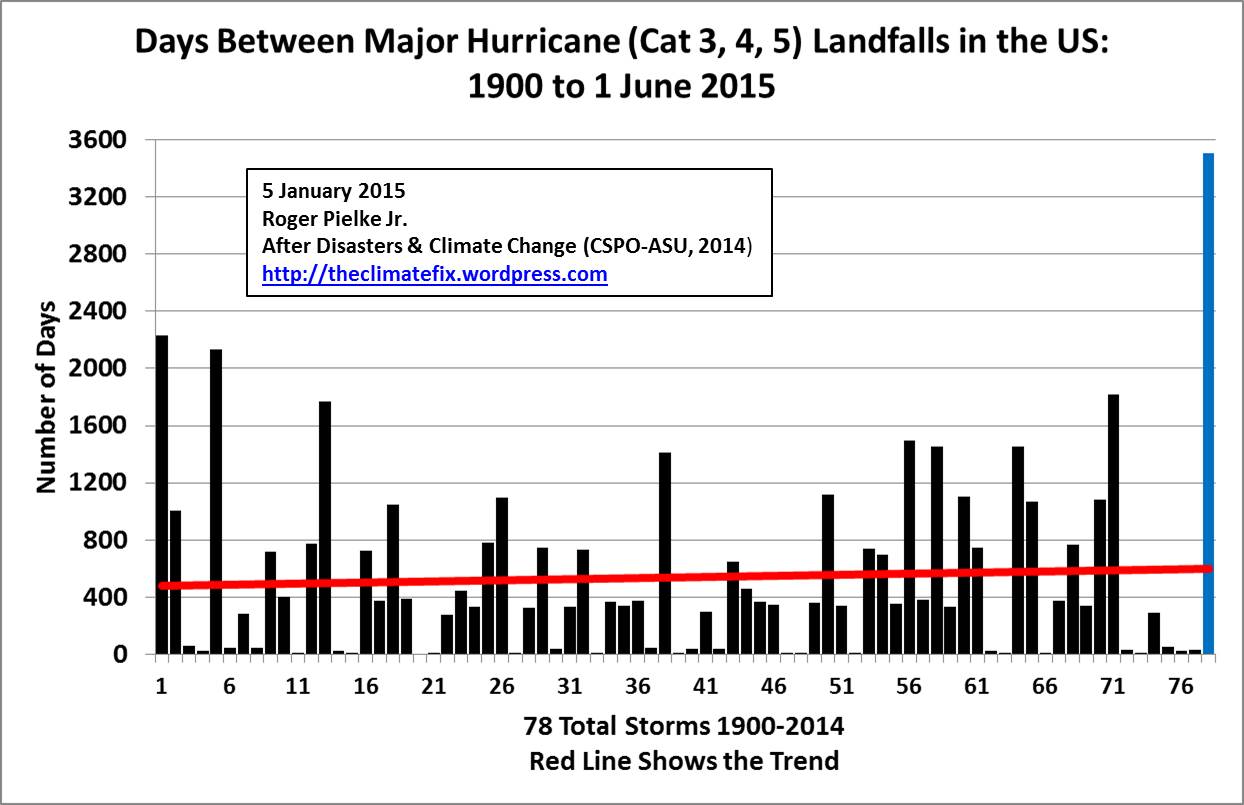
6. Ten years since a major hurricane hits the Eastern United States, a new record.
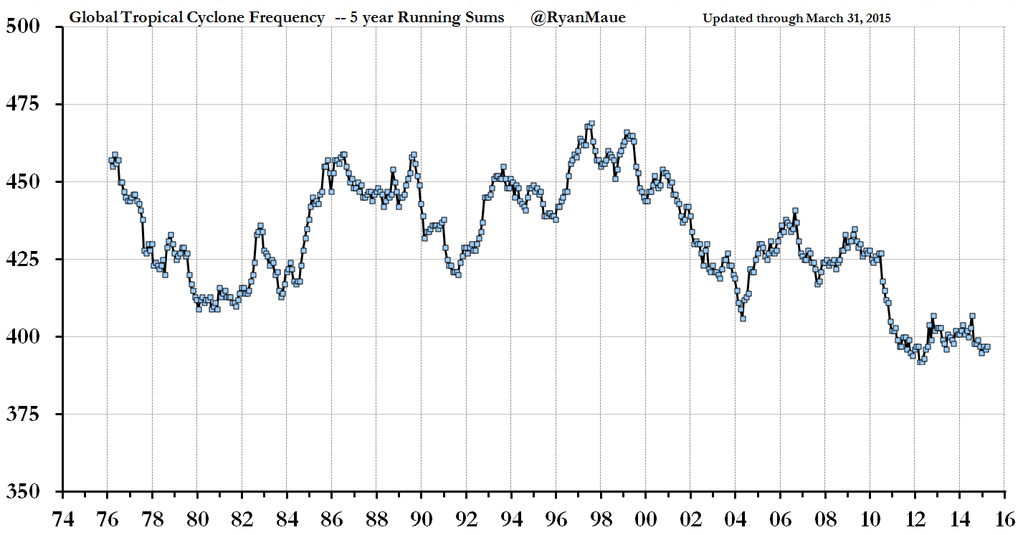
7. Global hurricane, typhoon, tropical cyclone activity is trending down.
8. Global droughts are diminishing.

Fraction of the global land in D0 (abnormally dry), D1 (moderate), D2 (severe), D3 (extreme), and D4 (exceptional) drought condition (Data: Standardized Precipitation Index data derived from MERRA-Land).
As we can see droughts are not increasing, there is a slight decrease in worldwide droughts over time.
