The Antarctic sea ice now covers an area that is larger than United States and Canada combined, or more than twice the size of Europe..
Another way to look at the ice cover size is, if the landmass of Antarctica is included, the ice cover is larger than Asia.
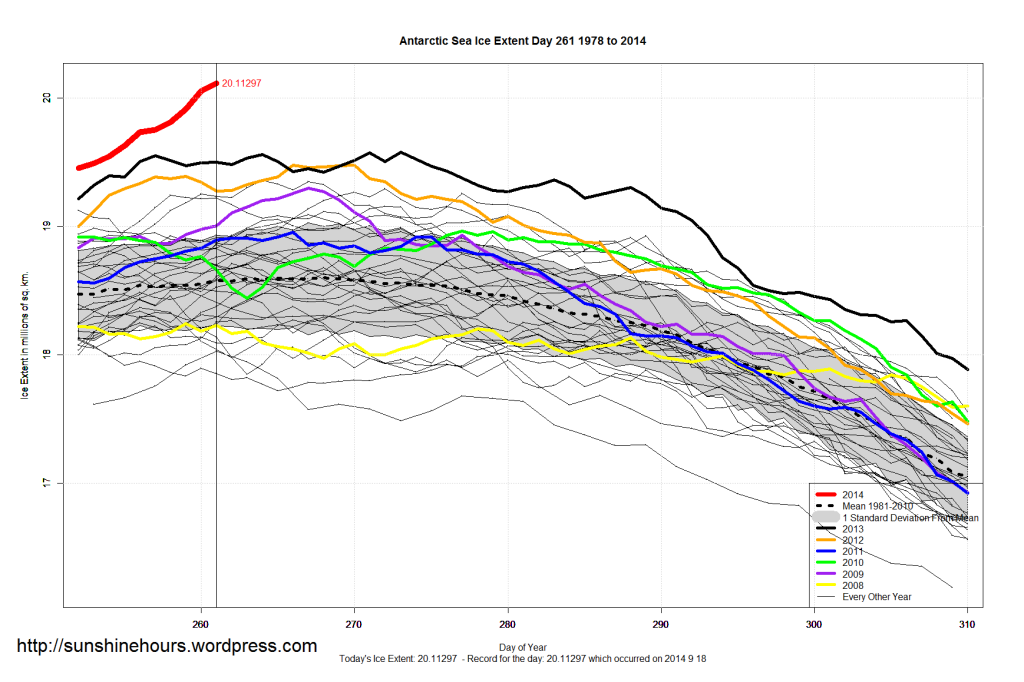
The amount of ice over last years absolute record is larger in area than the country of Spain.
Notice the ice extent goes all the way up to the 55th latitude, where a change in the albedo from the ice has a substantial cooling effect since a large portion of the sunlight gets reflected rather than absorbed. At the 55th latitude the sun is now 35 degrees above the horizon. The sun in the Arctic by contrast is now only 10 degrees above the horizon at the 80th latitude, so the effect of the Arctic ice is much less important.
One wonder is this going to be mentioned at the United Nations’ Summit on Climate Change September 23 in N.Y.?
The Climate Summit September 23 in N.Y. is expected to gather 125 heads of State or heads of Government.
Notably absent will be Aussie PM Tony Abbott representing 1.12% of the world’s CO2 emissions, Chinese President Xi Jinping with 24.65%, Indian Prime Minister Narendra Modi with 6%, Canadian Prime Minister Stephen Harper with 1.48%, German Chancellor Angela Merkel with 3% and Russian President Vladimir Putin with 5.18%.
The absences represent about 43% of the world’s CO2 emissions. Of course, when it comes to real pollution, nobody beats China. A good day in Beijing would be an air alert in the U.S.
Here are the 30 highest daily values for sea-ice in millions of square Kilometers.
2014, 09, 18, 20.11297, Absolute record since satellite monitoring begun
2014, 09, 17, 20.05201, Yesterday’s Record
2014, 09, 16, 19.91462, Record 2 days ago
2014, 09, 15, 19.81305, Record 3 days ago
2014, 09, 14, 19.75260, Record 4 days ago
2014, 09, 13, 19.73444, Record 5 days ago
2014, 09, 12, 19.62641, Record 6 days ago
2013, 09, 30, 19.57892, 2013 final absolute record
2013, 09, 28, 19.57295, 2013 record
2013, 10, 01, 19.57088,
2013, 09, 21, 19.56010, 2013 record
2013, 09, 14, 19.55145, 2013 record
2014, 09, 11, 19.54671,
2013, 09, 20, 19.53172,
2013, 09, 27, 19.51465,
2013, 09, 13, 19.50511, 2013 record
2013, 09, 22, 19.50450,
2013, 09, 29, 19.50390,
2013, 09, 18, 19.50078,
2013, 09, 17, 19.49298,
2014, 09, 10, 19.48881,
2013, 09, 19, 19.48110,
2012, 09, 22, 19.47713, 2012 new absolute record
2012, 09, 25, 19.47159,
2013, 09, 16, 19.47074,
2013, 10, 02, 19.46862,
2012, 09, 26, 19.47649,
2013, 09, 26, 19.46622,
2012, 09, 24, 19.46327,
Source: ftp://sidads.colorado.edu/DATASETS/NOAA/G02135/south/daily/data/

For your own edification, you might want to go to Google, type in the terms “warmest august on record,” pick an article, and have someone read it to you.
Here is one article:
I am not that good at reading, so I mostly just look at the figures. They speak for themselves, since they stem from official sources.
I am looking at the raw data as published by NASA (remember, I can’t read).
According to NASA it was warmer (globally) in both 1998, 2003, 2006, 2007, 2009, 2010, 2011, and 2012.
Equal temperature last year.
http://data.giss.nasa.gov/gistemp/tabledata_v3/GLB.Ts.txt