On March 13 Bill Gates, founder of Microsoft abruptly resigned from the board. Not long after it was discovered that one of his small research companies held a patent on the Coronavirus, or so it was said. Being curious I took a look at the patent. It turns out, it is a corona virus all right, complete with a vaccine against it, but it is for use in animals, not humans. Bill Gates has always been interested in vaccines, especially viruses that has a potential to develop into pandemics. It is a very worthwhile research subject, you want to have the answer right away, should a pandemics develop. The good thing about patents is, you have the exclusive right to manufacture it, or license it for a fee. He knows this very well. In the beginning of PCs Bill Gates offered to sell the Microsoft operating system to IBM for 82000 dollars. IBM said no, they had their own team developing it, so they needed no help, thank you. Well, it turned out they failed, so IBM came back to Bill Gates to take him up on the offer. Bill Gates refused, but offered to license it to IBM for a “reasonable” fee and the rest is history. So it can be very profitable. The price you pay for issuing a patent is that you have to disclose all pertinent information, in this case it consisted of the whole DNA sequence of the corona virus and the method to make the vaccine. Now it shows up that this virus was close enough to the one that caused the current pandemic, so the full DNA sequence information became very helpful to have a starting point to develop a vaccine for the current strains. Where was the original research conducted? You guessed it – in Wuhan, China. Why did Bill Gates choose China for the research?
On a totally unrelated subject, but still concerning Bill Gates, his company TerraPower decided to discontinue development of a research Nuclear reactor near Beijing, China. The reason was that the U.S. Department of Energy in October announced new restrictions on nuclear deals with China, in keeping with a broader plan by the Trump administration to limit China’s ability to access U.S-made technologies it considers to be of strategic importance.
Gates, who co-founded TerraPower, said that regulations in the United States are currently too restrictive to allow the reactor prototype to be built domestically.
There we have it! China has given sweetheart deals to everybody that want to come and do research in China. No bothersome regulations, all they want is to get full knowledge of what you are doing, be equal partners in all the findings, and if it leads to good production, be equal partners until they can fully take over. This has bee going on for over 25 years, and China was ready to fully take over, but the corona virus was released prematurely by accident.
By the way, be not surprised if North Korea suddenly agrees to abolish their nuclear weapons and stockpile. Bio warfare is cheaper and more difficult to trace and control and China doesn’t want to take the blame for it.
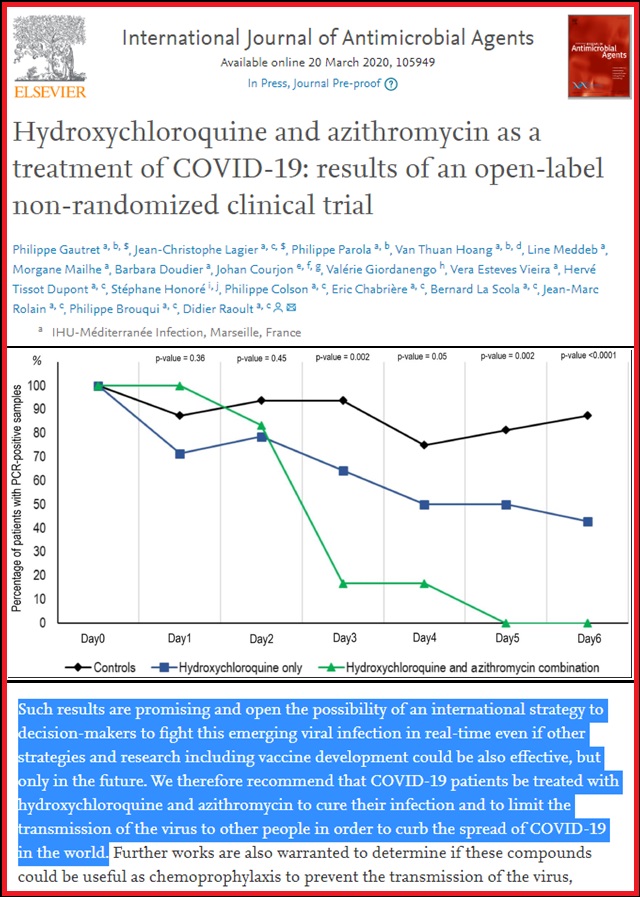
Anecdotal evidence shows that China is now using Hydroxychloroquine as a first defense against the COVID-19 outbreak. Did they tell us? No, but they have prohibited export of one of its main ingredients, and until very recently they were single sourced.
The moral of this story is: don’t ever get caught single sourced again! By the way, it is in the Defense Procurement Regulation. And don’t get me started on Rare Earth Metals!