In Luke 3 John the Baptist prepared the way and performed the baptism of repentance. Jesus’ was also baptized by John, after which “the Holy Ghost descended in a bodily shape like a dove upon him, and a voice came from heaven, which said, Thou art my beloved Son; in thee I am well pleased.” The chapter then lists the genealogy of Mary, from the human side of Jesus. (Matthew listed the genealogy of Joseph from the Kingly side, and since Joseph adopted Jesus as his own, it shows Jesus became the rightful heir to the throne of David.)
In 1 Samuel 26 David Spared Saul’s Life a second time.
1 Samuel 27. David allied himself with the Philistines.
Luke 2:21-52 is telling of when Jesus was brought to the Temple, Simeon’s and Anna’s testimonies, and Jesus at age 12, also in the Temple. Read it and marvel.
In 1 Samuel 24, David Spared Saul’s life, staying true to God.
1 Samuel 25 records Samuel’s Death. It also tells the vivid story of David and Abigail, the wife of Nabal.
To begin cost estimates, the model used is the cost for the Arizona central project. The waterway was constructed 1974 to 1993 at a cost of 4.7 billion dollars. In 2022 dollars that would be about 13.5 billion. The cost for the canal would be about 12.6 billion and 900 million for the pumping stations. The average size of the aqueduct in its beginning is 80 feet across the top and 24 feet across the bottom and the water is 16.5 feet deep. The concrete is 3.5 inches thick and, in some areas, it is reinforced with steel rebars. It is 336 miles long from Lake Havasu City to Tucson with a total lift of over 2,900 feet. The capacity starts out at over 2.2 million acre-ft per year, diminishing as the drop-off point occurs, and the total pumping of 1.4 million acre feet of water is lifted by up to 2,900 feet by 14 pumping stations using 2,500 GWh of electricity each year. The pumping stations have a total pumping capacity of 240 MW. It has a 7 mile long, 22 feet diameter tunnel from Lake Havasu to the beginning of the waterway.
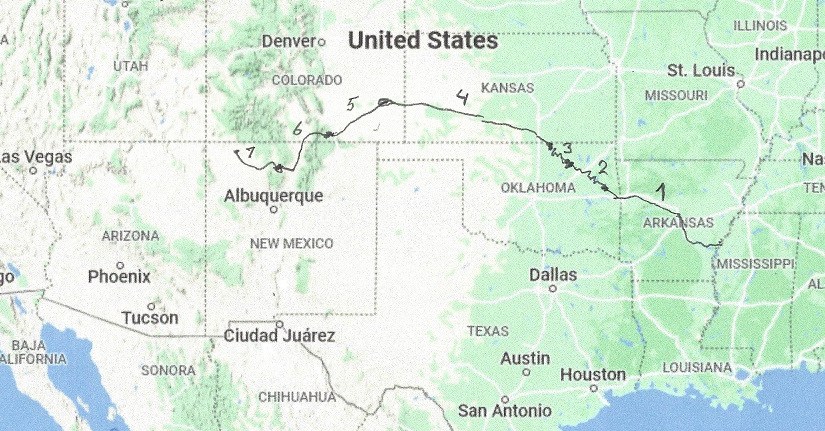
The Trans-Rocky-Mountain aqueduct is much bigger: The The average size of the aqueduct in its beginning is 160 feet across the top and 80 feet across the bottom and the water is 35 feet deep. The concrete is 4 inches thick and, in most areas, it is reinforced with steel rebars. The concrete used is 4,500 cu yd per mile. It will cost about 2.5 times as much per mile as the ACP, so the total cost for the Trans-Rocky-Mountain Aqueduct will be ((12.6x 2.5 : 336) x 480) = 45 billion dollars. Like the CAP, it will have an 8 mile tunnel, and its diameter will be 48 feet. This cost estimate is probably high, since eminent domain costs will be minimal; all the dams already exist and are paid for, the Arkansas river is there, complete with dams; and land for all the reservoirs are already litigated and settled. The canal will go through sparsely inhabited land.
The cost of building 17 additional small dams in the Arkansas River will be on the order of $120 million per dam, for a total of $2 Billion.
There will be a total of 7.4 GW of pumped energy needed and 200 MW of base power generated. To get the aqueduct operational at 6 MAF/year it requires 7.4 GW of energy. Pumping cost capital is about $ 1.30 per watt, so the minimum pumping capital cost is 9.6 Billion dollars.
The Liquid Fluoride Thorium Reactors proposed is 100 MW units. so called Small Modular Reactors (SMR) The reactor core assemblies are small enough so they can be produced on an assembly line and delivered via truck. There are 3 assemblies needed, the reactor, the safe shutdown unit and the reprocessing and separation unit. The whole building can be built for $ 230 million. To complete the installation costs, add another # 30 million per unit. The aqueduct needs 74 units. The initial capital cost for grid access and minimum flow is $19 billion.
To sum it up,the capital cost for a flow of 6 MAF is (45 +2 + 9.6 + 19) = 75.6 billion dollars. The amount of water in the aqueduct when filled is 230,000 acre-feet and will take 1.1 TWh of electricity to fill, or about $35,000dollars at 3 c/kWh base rate.
When the electricity demand requires peak power, the pumps are turned off, and electricity will be sold back to the grid, at peak rate.
Solar power and wind power will also power the pumps, and they will lessen the demand for nuclear reactors. But the remaining reactors will still be needed, or peak power will still have to be supplied by natural gas, or coal when the sun doesn’t shine and the wind doesn’t blow.
In short: assuming a 50 year amortization plan for the aqueduct, and money available at 2%, , it will cost 3 billion a year in capital cost to deliver 6 MAF water from the Mississippi River to Lake Powell or any point in between, or $2,000 per acre-ft. Add to that $240 for electricity and another $50 per acre-ft in overhead and maintenance, the cost will be $2,290 per acre-ft.
The Rocky Mountains places are ideal for wind and solar power, but they need to store the energy when the sun is not up or doesn’t shine, or the wind doesn’t blow. Right now that is provided by coal and natural gas. Conventional nuclear power is best for use as base power only, so this Trans-Rocky-Mountain aqueduct will provide up to 7.4 GW of pure virtual pumped power storage, the LFTR nuclear power plants will provide the energy by shutting off the pumping of water in the aqueduct when the need arises, and instead provide another up to 7.4 GW of virtual pumped storage power. The beauty of this is that the pump response is instantaneous, so the grid can be really finetuned to meet the exact power needs.
Luke 2:1-20. The birth of Jesus is so well known that even Charles Schulz’ Peanuts tell of the Birth of Jesus, and the Shepherds and the Angels. Beginning in 2015 many school districts banned the play because of the biblical quotes. Some replaced it with Frosty the Snowman, something we all can believe in.
1 Samuel 20, . Jonathan and David vowed an oath of loyalty, saying: “The Lord be between me and thee, and between my seed and thy seed for ever.”
In 1 Samuel 21 David and his men ate from the Holy Showbread. After that David fled to the Philistine city-state of Gath and pretended to be insane to stay alive.
1 Samuel 22. David gathered four hundred men and went back into Judah. Because the LORD’s priests had helped David, Saul had Doeg the Edomite murder the priests, eighty-five in all.
1 Samuel 23. David Saved the City of Keilah, was pursued by Saul, spending most of the time in strongholds of the wilderness.
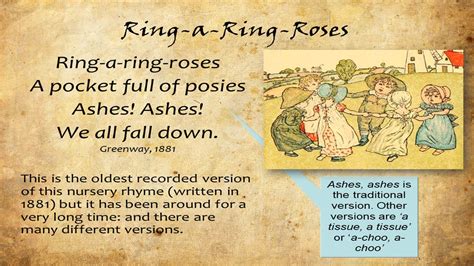
Ring around the roses. pocket full of poses, ashes ashes. Everybody fall down.
When my Wife and I immigrated to America from Sweden and Denmark in the late 60’s we noticed that the girls seemed to sing and play “ring around the roses” everywhere. Being curious I asked them what it meant, but of course nobody knew, they just liked to sing it. Those were innocent times.
How was this pandemic compared to earlier times?
The song refers to the black plague, happening in the mid 14th century A.D., when around 30 percent of the Swedish population died. It was so bad that some villages died out completely, and I know of one such village that did not get resettled until the end of the Little Ice Age. The movie “The Seventh Seal”, one of the best movies of all time has a scene where an exhausted knight plays chess with Death, and is convinced he is winning, upon which Death simply explains “I cheat”.
So, is there cheating going on with the statistics?
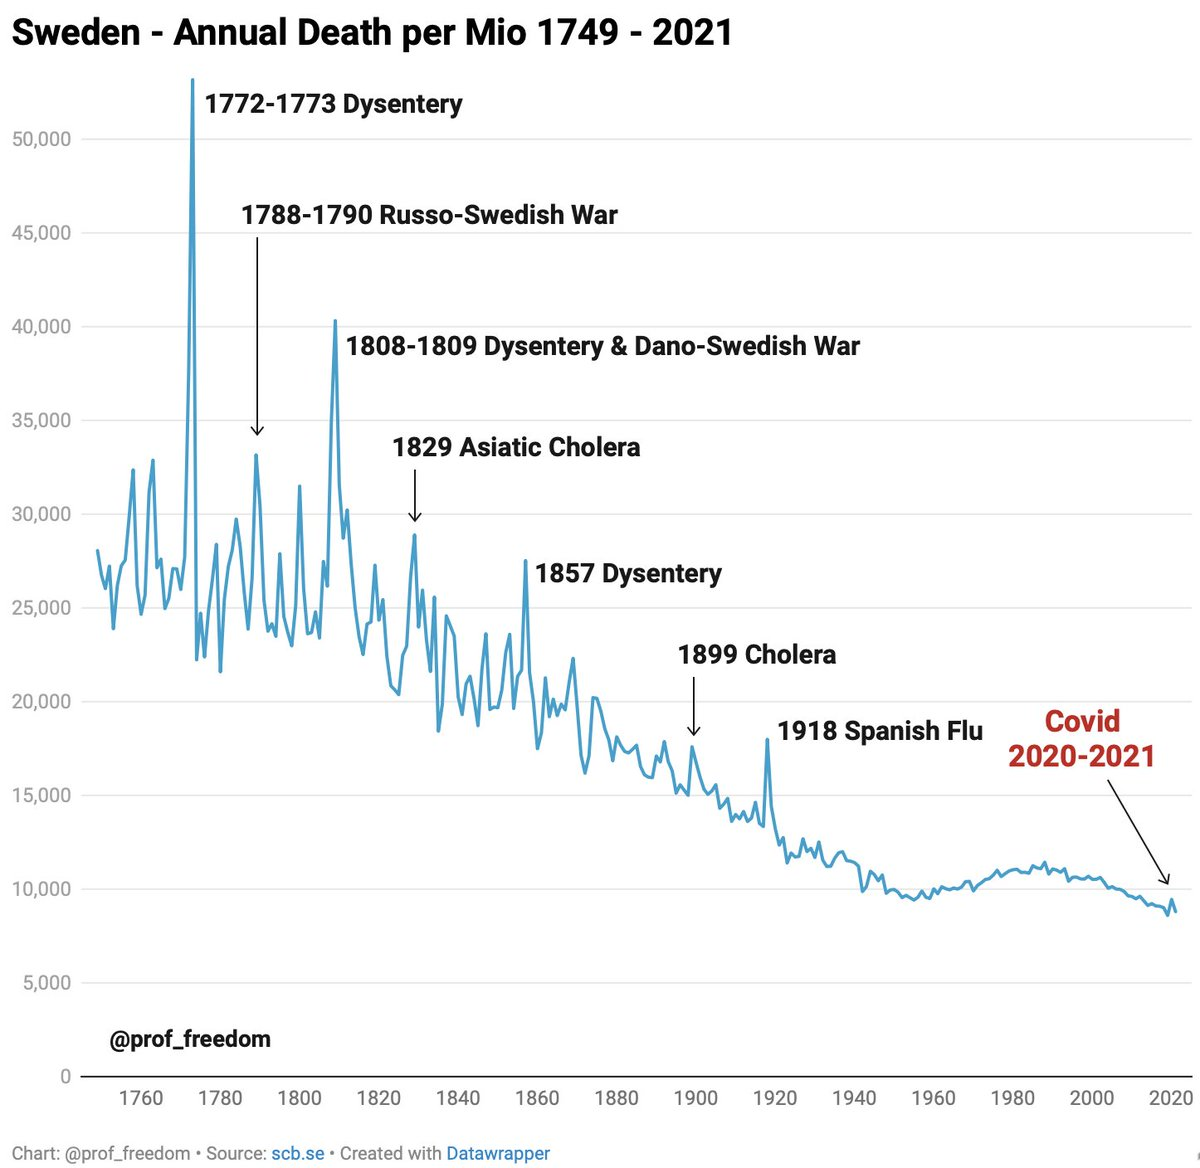
It so happens that Sweden, which used to include Finland, and Denmark, which used to include Norway and Iceland, have nearly complete church record since the reformation, and in many cases even since Catholic times. Everybody belonged to the church, and the pastors were very jealous that no one was missed, they were concerned for the soul of everyone in the congregation, and as a side note, that was how they collected taxes. Here a historical view of the the pandemic statistics for Sweden.
So, how did the world react to this statistical blip?
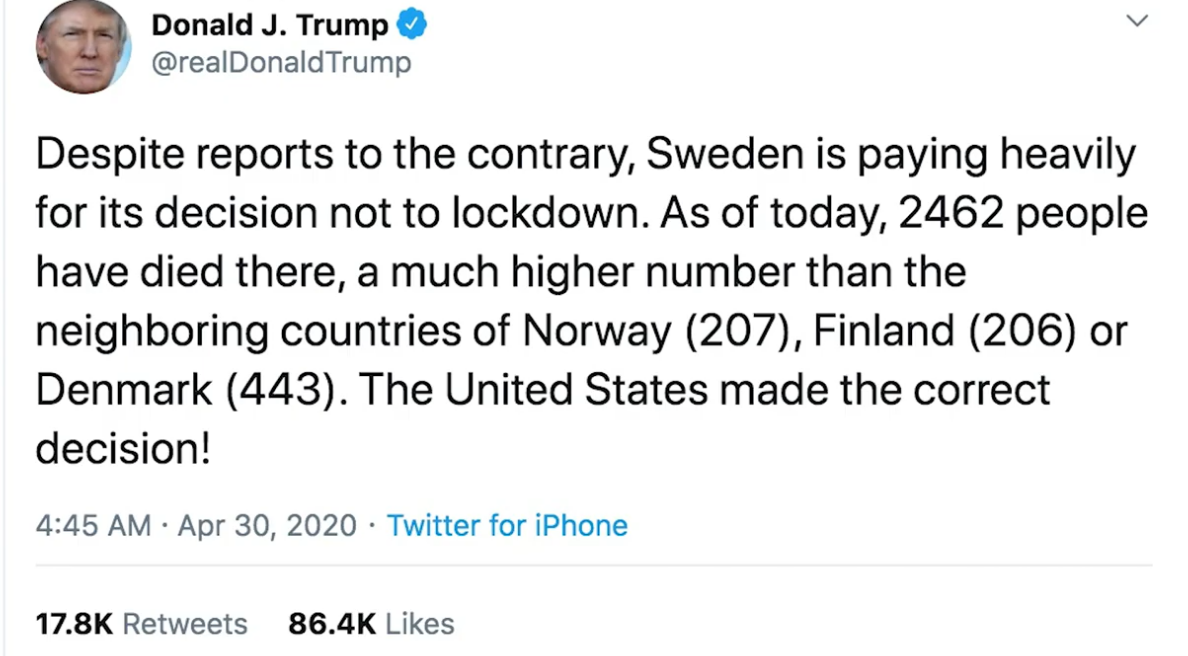
Most countries reacted with a lockdown of one form or another, Sweden alone decided to stick it out, keep production and transport as usual, only limit large gatherings. The result seemed horrendous at first. Then President Trump tweeted this:
Notice the date. The pandemic had barely started.
What President Trump did was to let the States decide how to implement the lockdown, if at all. Most states did a lockdown, Florida decided to protect the vulnerable and elderly first, New York, Michigan, New Jersey, Pennsylvania and California decided to send elderly Covid patients to their nursing homes and South Dakota did not do a lockdown. After all, health care is a State matter according to the 10th amendment.
We now have the statistics from 5 countries and 7 States:
Sweden, no lockdown: Cases per million: 244,634. Deaths per million 1,827
The other four Nordic countries had lockdowns:
Denmark: Cases per million: 507,644. Deaths per million 1,042
Norway: Cases per million: 258,878. Deaths per million 522
Finland: Cases per million: 180,063. Deaths per million 655
Iceland: Cases per million: 532,895. Deaths per million 324
While not technically an independent country, but still Nordic:
Faroe Islands: Cases per million: 704,460. Deaths per million 569
And now for the seven States:
South Dakota, no lockdown: Cases per million: 268,505. Deaths per million 3,279 Florida, limited lockdown: Cases per million: 276,713. Deaths per million 3,437
And now the 5 states that sent COVID patients to nursing homes:
Pennsylvania: Cases per million: 219,096. Deaths per million 3,483 California: Cases per million: 232,625. Deaths per million 2,281 New York: Cases per million: 270,904. Deaths per million 3,533 Michigan: Cases per million: 241,464. Deaths per million 3,598 New Jersey: Cases per million: 252,269. Deaths per million 3,757
The conclusion I can draw from this is that the COVID pandemic will run its course until herd immunity is achieved. Sweden has achieved it, and the other Nordic countries probably have too. As for U.S.A., it seems that it really doesn’t matter much how it was fought, except in the states with the strictest lockdown the children, especially the disadvantaged, lost two years of education, which cannot be regained.
Is there a better way? Look at the experiences of sub-Saharan Africa and the rest of the world here
Luke 1:57-80, tells of the birth of John the Baptist and Zechariah’s song.
.
1 Samuel 17 gives a vivid rendition of how David defeated Goliath. Just read it, it is great reading.
1 Samuel 18. Saul began to resent David, and no wonder, women started chanting “Saul hath slain his thousands, and David his ten thousands.” Saul’s daughter Michal fell in love with David, and Saul let them marry after a rather unusual dowry, but he became more and more suspicious and afraid of David.
In 1 Samuel 19 Saul’s paranoia was fully developed, and he persecuted David, trying to kill him over and over again.
The cause of Climate Change is still up in the air. Sherlock Holmes: “It is a capital mistake to theorize before one has data. Insensibly one begins to twist facts to suit theories instead of theories to suit facts”. From: “Scandal in Bohemia” by Arthur Conan Doyle.
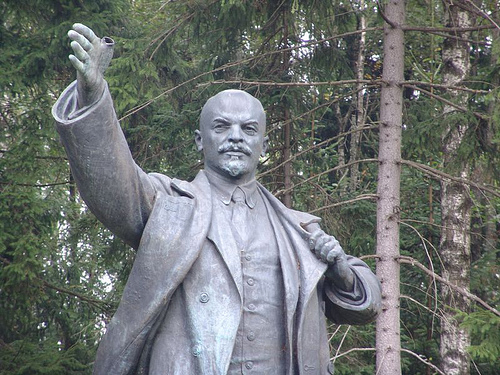
The very first Earth Day was celebrated April 22 1970, on the 100 year anniversary of the birth of Vladimir Lenin (Владимир Ильич Ленин). True green environmentalists keep telling me it is just a coincidence. I think not.
.
.
.
.
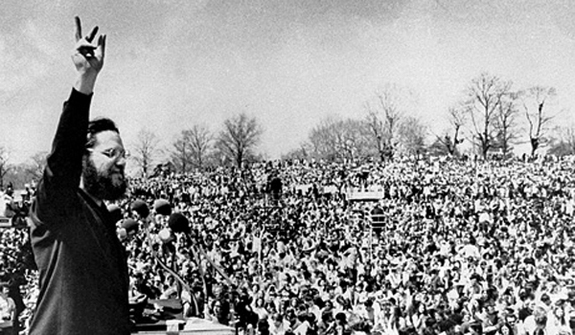
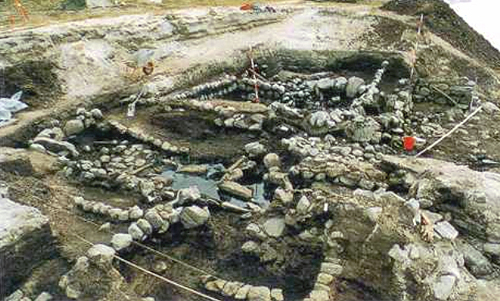
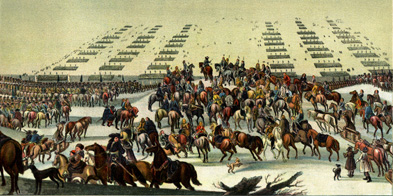
The first Earth Day in Philadelphia 1970 featured Ira Einhorn (The Unicorn Killer) as master of Ceremonies. For those too young to remember, he murdered his girlfriend , stuffed her in a piece of luggage in his apartment and kept her there for seven years, and no one smelled a dead rat). He was finally convicted many years later. The big environmental scare of that day was the threat of a new Ice Age. The clarion call was: “In the year 2000 temperatures will have fallen 10 degrees”, the culprit was pollution, especially acid rain. The acid rain was so bad in the Adirondacks, Canada, Norway and Sweden that the Rainbow Trout died in droves, and even the oceans were in danger of getting too acid. Regulations were enacted to add scrubbers to coal fired power stations, waste water was purified, and – wouldn’t you know it, the cooling trend reversed itself and was followed by warming. Since the cooling trend was “obviously man-made” they had to find a reason for the sudden warming. Never mind that around the year 1200 there was at least one farm on South West Greenland that exported, among other things, cheese. How do we know that? They have excavated the ruins of a farm, “Gården under Sanden”, buried under a glacier for five centuries. During these five centuries the Northern Hemisphere experienced what is called “the little ice age” a time when the winters could be so cold that in 1658 the Swedish army, cavalry and artillery crossed the Belts in the southern Baltic over ice and sacked Copenhagen. The Belts have not been that frozen since.
Picture left: Gården under sanden excavation.
Picture right: The crossing of the Great Belt 1658.
To predict future climate changes many computer models have been developed dealing with how the earth responds to changes in atmospheric conditions, especially how it responds to changes in CO2 levels. Most were developed in the 1970 to 2000 time frame, a time of rapid temperature rise and as such they were all given a large factor for the influence of rising CO2. Since 2005 we have had a cooling trend, so the models cooperate less and less and are given more and more unreliable predictions. It is no wonder then that they all have failed to model the past. None of them have reproduced the medieval warm period or the little ice age. If they cannot agree with the past there is no reason to believe they have any ability to predict the future. The models are particularly bad when it comes to predict cloud cover and what time of day clouds appear and disappear. Below is a chart of a number of climate models and their prediction of cloud cover versus observed data. Note especially to the right where they completely fail to notice the clear skies over Antarctica.
Is there a better way to predict future temperature trends? When you go to the doctor for a physical, at some point and without warning he hits you under the knee with a hammer and watches your reaction. He is observing your impulse response. Can we observe impulse responses for the earth? One obvious case is volcanic explosions. Sometimes the earth burps a lot of carbon dioxide or methane. But the most interesting response would be how the earth responds to a solar flare with a sudden change in the amount of cosmic radiation hitting the earth. That would give the best indication how the sun and cosmic radiation affects cloud formation. A couple of solar flares lately have been giving us a hint how the cloud cover responds to changes in cosmic radiation, and they are consistent with the latest results from the CLOUD project conducted using the CERN particle accelerator, a confirmation of a theory forwarded by the Danish Physicist Henrik Svensmark. He first presented the theory in 1997 and finally got the results verified and published in 2007, but the prevailing consensus has been slow to accept the theory that the sun as the primary driver of climate change. We have many reasons to be concerned about the well-being of the earth, but rising levels of CO2 is not one of them. In fact, CO2 is our friend. Rising CO2 levels increases crop yields, makes the impact of land use changes less pronounced and the photosynthesis process more efficient, using less water and allowing us to grow crops on land once deemed unprofitable.
Picture right: The CERN Cloud apparatus in 2009.
James Hansen, a world famous climate science activist/NASA physicist writes in one of his publications, called “Earth’s Energy Imbalance and Implications“. It contains a quote that ties nicely in with Sherlock Holmes observation: The precision achieved by the most advanced generation of radiation budget satellites is indicated by the planetary energy imbalance measured by the ongoing CERES (Clouds and the Earth’s Radiant Energy System) instrument (Loeb et al., 2009), which finds a measured 5-year-mean imbalance of 6.5 W/m2 (Loeb et al., 2009). Because this result is implausible, instrumentation calibration factors were introduced to reduce the imbalance to the imbalance suggested by climate models, 0.85 W/m2 (Loeb et al., 2009).
There we have it. The observed data does not fit the climate models. Change the observed data! Then use that data to validate the climate models! How convEEnient, as the SNL Churchlady used to say. Shenanigans like this have been exposed in what has been named “Climategate1.0”, followed by “Climategate2.0” and soon to be released “Climategate3.0” This is what happens when politicians take over science and make further funding contingent on obtaining desired results.
Luke 1:1-56, to Theophilus. The birth of John the Baptist was foretold to Zacharias by an Angel, then the angel Gabriel made an announcement to Mary. Mary met Elizabeth, Zacharias’ wife, and stayed with her. In this chapter is Mary’s song; called the Magnificat.
1 Samuel 15 is the chapter where Saul is rejected by God as King.
1 Samuel 16. Samuel anointed David as King after rejecting all of David’s older brothers and David entered into Saul’s service while Saul was still the titular King. Whenever Saul’s spirit troubled him David played for him and that soothed Saul.
The American Southwest is beginning to become desertified. More water is used up than falls in the Colorado River. All water and more is spoken for. The Gila River used to provide about 1.3 Million acre-feet yearly to Arizona. It is now all used up, and the aquifers are being depleted. Since 40 million people are dependent on the Colorado River and the Gila river and the population is rapidly growing the only real solution is to bring in more water to the American South-west. It will be expensive and require a lot of power, but the alternative is a depopulation of the American South-west. Something like it did already happen when the rivers Amu Darya and Sur Darya became used for irrigation and the Aral Lake dried up, the rains ended and the land east of the lake became more or less a desert.
Here are two proposals to save the American Southwest, Lake Mead, Lake Powell Arizona, New Mexico, Colorado, West Texas, Mexico, South California, Nevada and help Arkansas, Oklahoma and Texas with their water shortage and pumped water storage.
Together they will double the amount of water provided to the American Southwest and more than triple the amount of pumped storage capacity for the whole nation. When we shift from gas and diesel to electric vehicles the pumped storage capacity must be increased, or the extra electricity must still be provided by fossil fuels. Solar and wind power requires pumped storage to reduce the strain on the electric grid, when the cars need to be re-charged at lunch and dinner time.
Mark 16. On the first day of the week Jesus did rise from the dead and Mary Magdalene saw the Risen Lord. The oldest manuscripts end there. The majority script completes the Gospel with Jesus proclaiming the Great Commission, was taken up to heaven and is now sitting down at the Right Hand of God.
In 1 Samuel 11 King Saul rescued Jabesh Gilead. Then the people reaffirmed Saul as King.
1 Samuel 12 contains Samuel’s speech at Saul’s coronation.
In 1 Samuel 13 the real trouble began, Saul offered an unlawful sacrifice, so God would no longer fight for them, Saul’s kingship would be taken away and God would choose a king after his own heart. The weapons for the army were taken away from the Israelites and the Philistines took control of the iron trade.
1 Samuel 14. Jonathan Defeated the Philistines. King Saul made an oath that no one was allowed to eat until nightfall. Jonathan didn’t know that, so he ate, and Saul wanted to put Jonathan to death, but his men refused the King’s order, and thus Jonathan’s life was spared.