The climate is changing. The American Southwest is getting hotter and drier, the American East is getting wetter and the North is getting snowier. The urban areas are getting warmer as energy use and paving increase. How much of all this is attributable to increasing CO2 levels?
To get a grasp of how the greenhouse effect functions look at this chart:
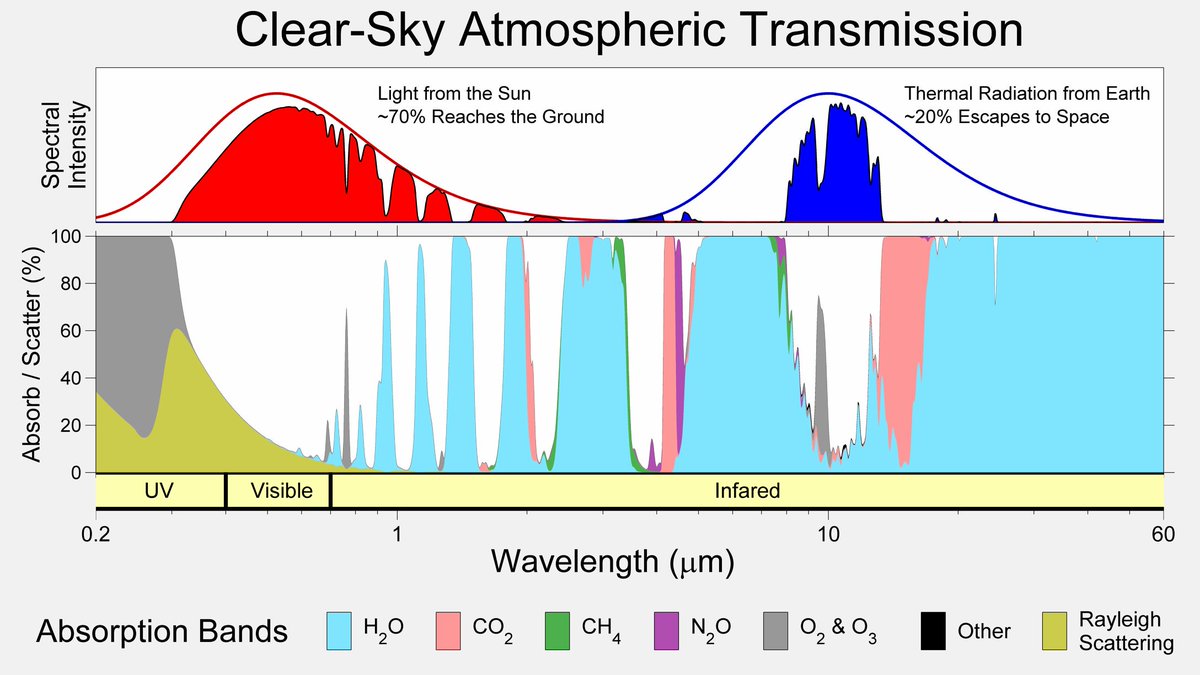
From this chart we can see that water vapor is by far the most important greenhouse gas, followed by CO2 with Methane and Nitrous oxide far behind. Oxygen is part of the atmosphere, and so is Nitrogen and their concentration is assumed to be constant. Ozone concentration is too small to have any effect. Raleigh scattering is why the sky is blue and it is constant regardless of other factors.
. But this chart is deceiving, for it does not fully explain the net effect on radiation, from the sun or from the earth. The chart below is much better:
The incoming solar radiation includes ultraviolet radiation, visible light and near infrared radiation. This is all the heat incoming to the earth, except the heat that is coming from the earth’s core. All area under the curves of the right halves represent greenhouse gases absorption, except the blue area which represents energy radiated into space under a cloud-free sky. The all dominant geenhouse gas is water vapor but CO2 contributes with 2 absorption bands, at 4.3 microns and 14.9 microns. The 4.3 micron absorption is of almost no importance since it occurs at a wavelength where very little radiation is available, neither from the sun, nor from the earth’s blackbody radiation. The only wavelength that counts for CO2 absorption is at 14.9 microns, because it occurs in the so called atmospheric window and the blackbody radiation is near its maximum.
Let us take a closer look at the outgoing blackbody radiation and the atmospheric window:
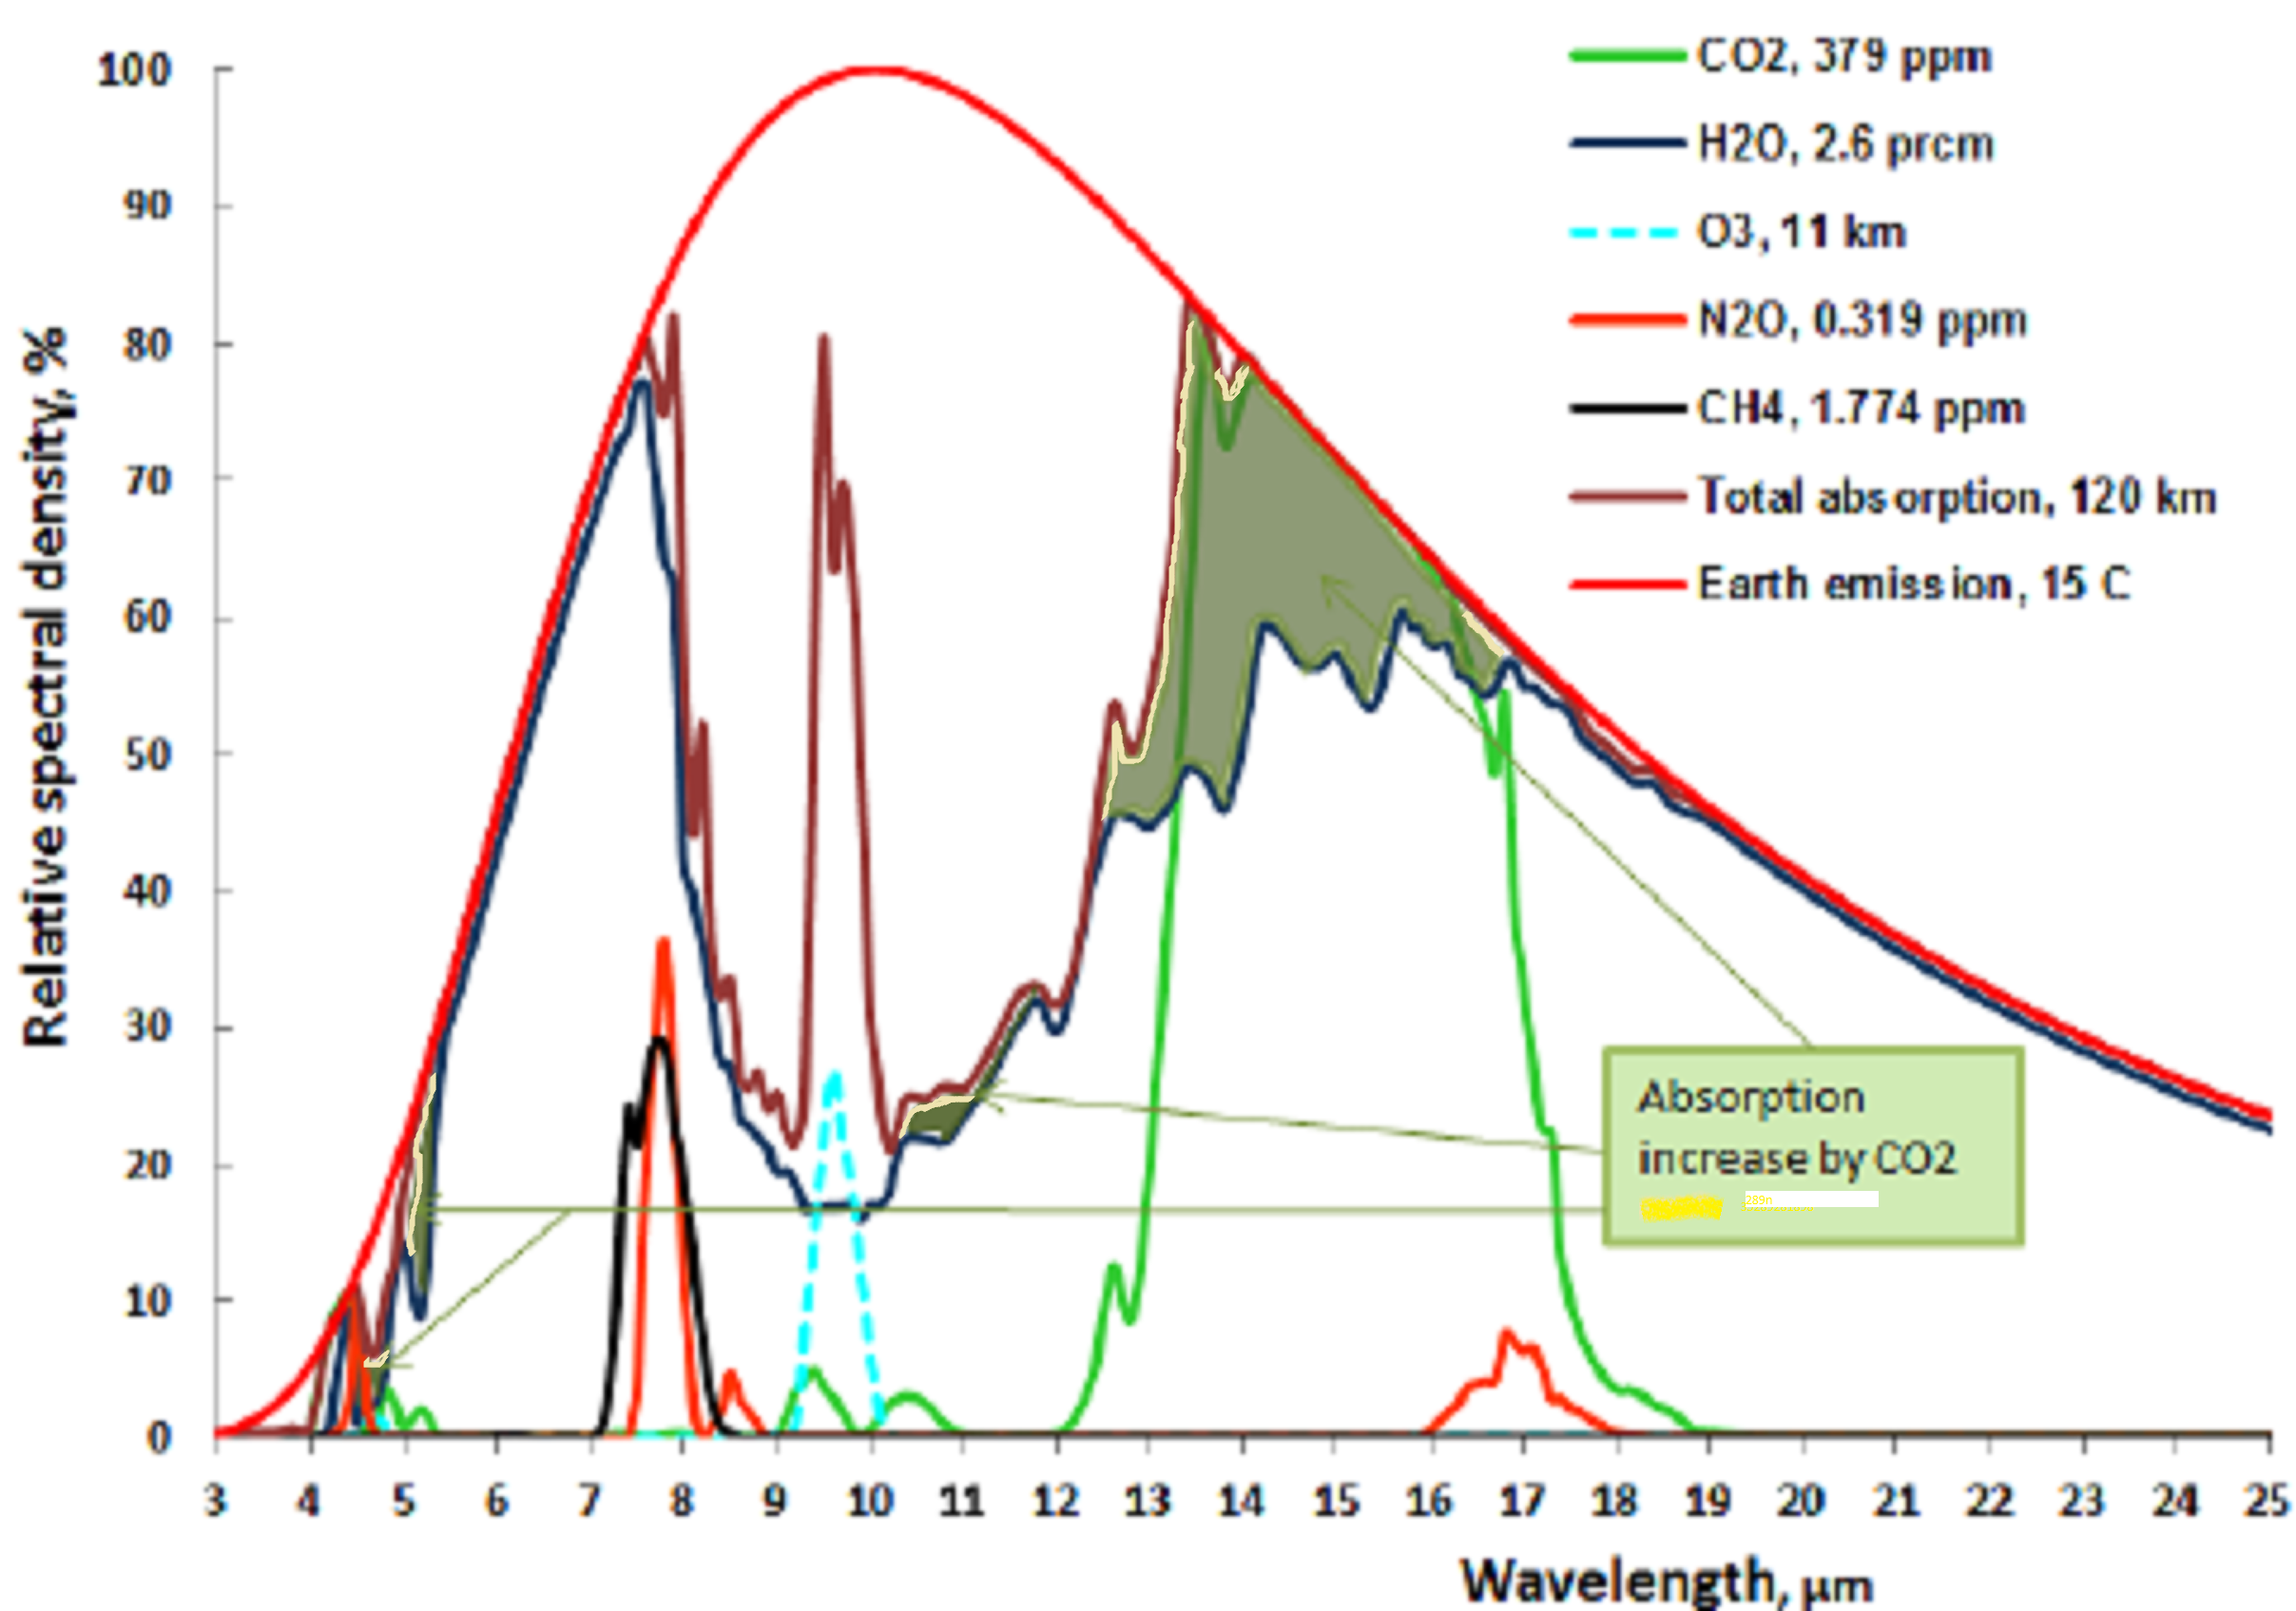
The first thing to notice is that no absorption exceeds 100% , so at 14.9 micron wavelength CO2 absorbed 100%, and water vapor absorbed another 80%, the total sum is still 100%. Therefore between the wavelengths 14 and 16 microns all energy was absorbed regardless of CO2 concentration and water vapor concentration. The olive area represents the extra absorption of CO2 at 280 ppm when the water vapor is taken out (you cannot absorb more than 100%). The small yellow slivers represent the extra CO2 absorption at 415 ppm. The white area between the brown total absorption area and the red earth emission line is the total emitted energy through the atmospheric window.. the Methane and N2O gas greenhouse absorptions occur at wavelengths where water vapor already absorbs nearly 100%, so their contribution to greenhouse gases is negligible. Likewise Ozone absorption occurs where O2 also absorbs. From the picture below (thanks, NASA) we can see that the total amount of energy escaping through the atmospheric window from clouds and from the ground is on average (29.9 + 40.1) = 70 W/m2. In pre-industrial times the value would have been around 70.6 to 71 w/m2.
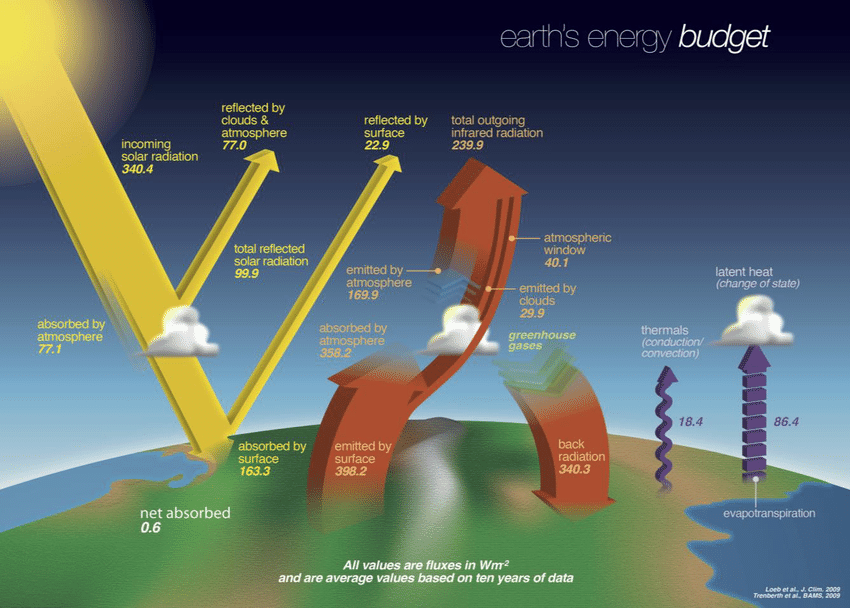
NASA has made a good estimate of the earth’s energy budget. Total incoming energy is 340.4 W/m2 and escaping through the atmospheric window is 70 W/m2, or 20.56%. Before the industrial age the value was about 70.8 W/m2 or 20.80%, an increase of 0,24%. A black body radiation is proportional to the fourth power of absolute temperature (Kelvin). The current average temp on earth is 287 degree Kelvin, so the temperature rise since pre-industrial times from the sum of increasing Co2, Methane, Nitrous oxide and ozone is 287 * fourth root of (1-0.0024) = 286.83 K, a decrease of 0.17 degree Celsius.
This is but a small portion of the temperature rise experienced, and it so happens that there exists a good measuring point, where the all dominant greenhouse gases are CO2, Methane, NO2 and O3. At the South Pole in the winter the air is clean, there is almost no water vapor and the winter temperature at the Amundsen–Scott South Pole Station between April and September 2021, a frigid minus-78 degrees (minus-61 Celsius), was the coldest on record, dating back to 1957, and the trend is 1 C colder per century.
In future blog posts I will examine the temperature effects of clouds, land use changes, water use, and water and air pollution.
Congress has passed the anti-inflation bill that included over 300 billion to fight climate change, and it included more solar panels and wind turbine motors to be imported from China. The experience from Europe is that electricity from solar panels and windmills is 5.7 times as expensive as conventional power generation.
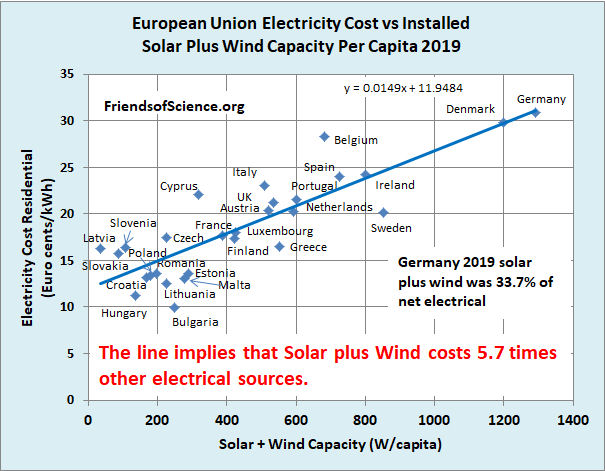
This analysis was done for 2019, before COVID. The situation is much worse now, with electricity rares up to 80 c/kWh, topping $1 /kWh this winter in some countries. It would be better not to import any solar panels and wind power generators from China and let them pay for the extra cost rather than building more coal burning plants. After all they were planning to build over a thousand new plants between now and 2030, all legal under the Paris accord. This would benefit the world climate much more, since Chinese coal plants are far more polluting, since China has far less stringent environmental regulations than U.S.
U.S. uses 13.5% of the world’s coal, and eliminating U.S. CO2 emissions would in time reduce the world temperature by 0.023C, providing no other country, such as China and India would increase their use of Coal.
It is folly to mandate electric cars before the electric grid is strengthened and upgraded. There are far better ways to solve the climate crisis, and that involves land and water use changes, as well as developing other energy sources as well as drastically change the regulatory environment..
