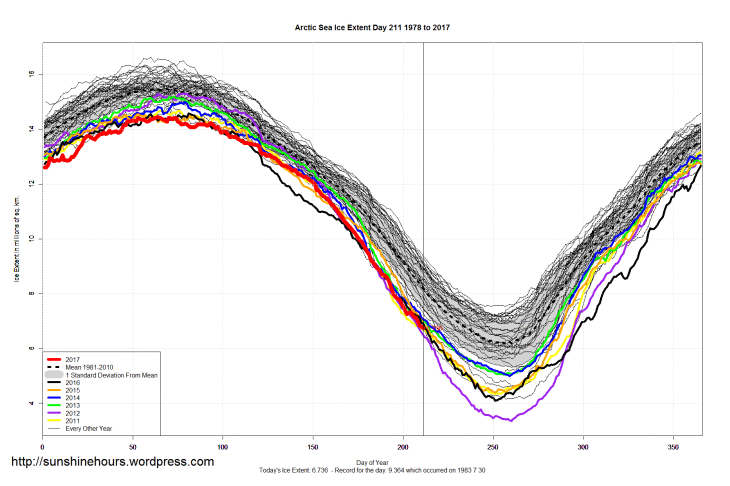
It was very warm in the Arctic above the 80th latitude last winter. Late summer two hurricane strength storms broke up a lot of ice up and transported it south to areas where it was bound to melt. The ice area reached a new low, except for the year 2012, but the ice volume hit a new all time low on Sep 9 2016.
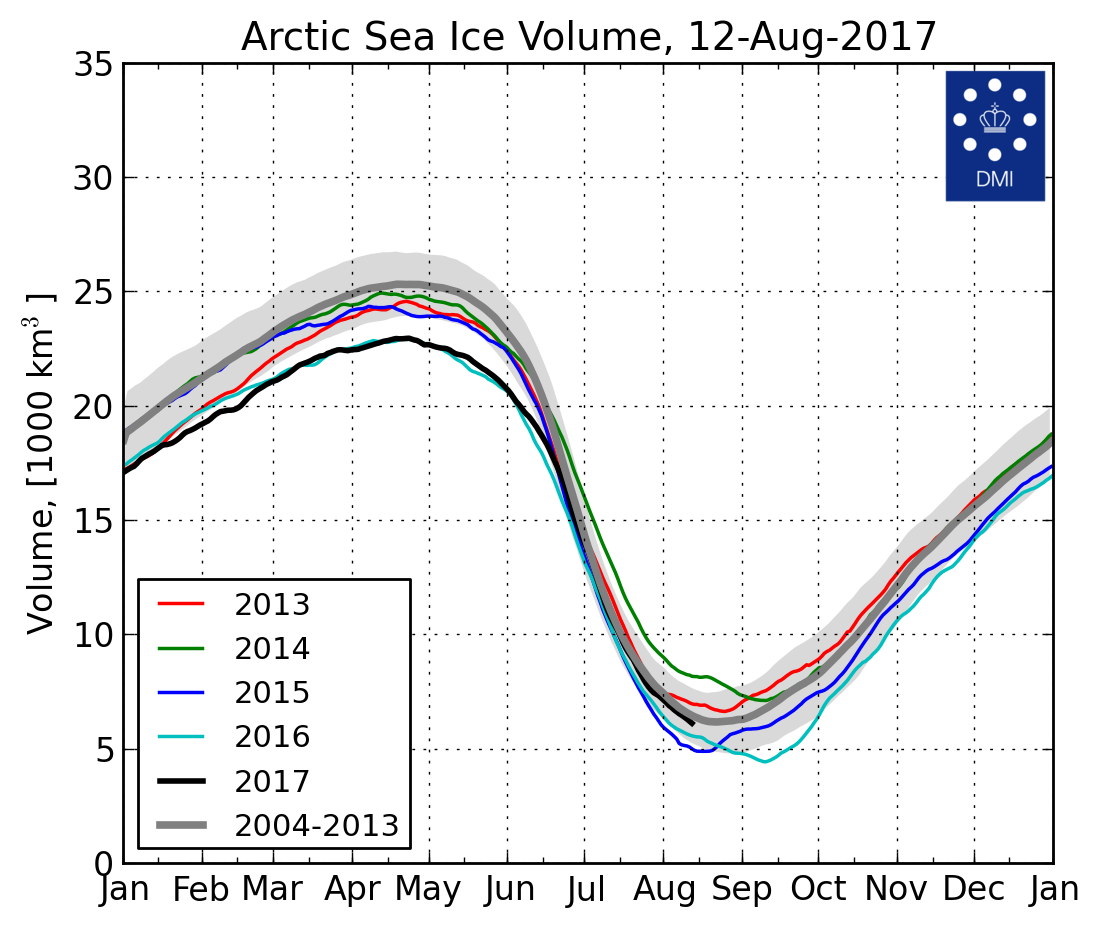 Since then the ice volume has recovered to equal the previous all time winter low around April 20, 2017, but the ice area hit an all time low maximum as early as March 5.
 What happened?
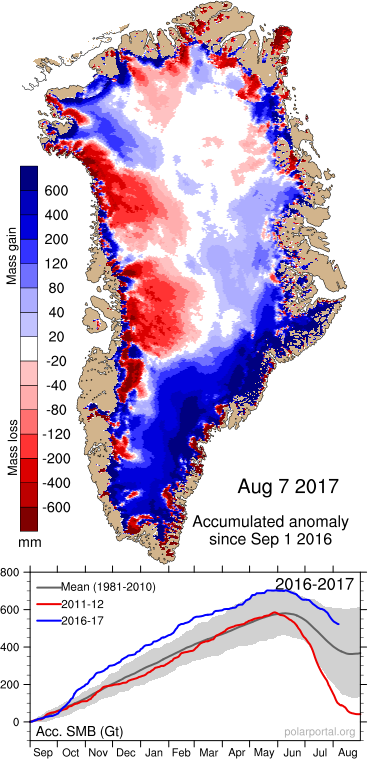
The unusually warm temperatures averaging 7 degrees C above normal with a spike as high as 20 degrees C above normal and no days below was not because of increased CO2, but because it snowed. Anyone that has shoveled snow knows that while it snows it is usually not that cold, especially if the winds are calm. Then, when the snowing stops it gets cold indeed. Nowhere is that shown better than what happened on Greenland this winter. It snowed and snowed from one winter storm after another starting in the Philippines, raining and snowing over California, regaining strength from the Mexican Gulf and then racing up the Eastern Seaboard snowing out over Greenland.
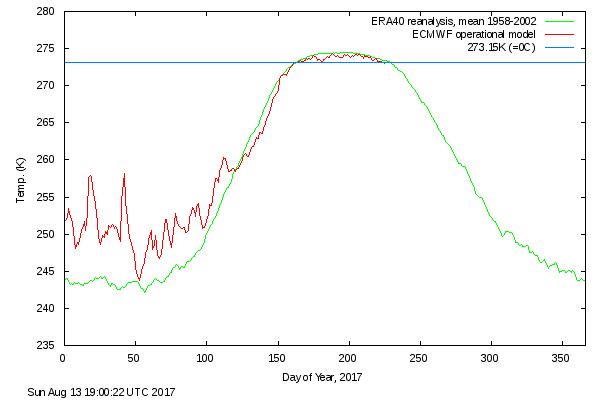
Then on May 5 it all changed. From having been warmer than normal the Arctic became colder than normal, in fact there has been no day since then that temperatures has been above normal. Today, Aug 13 it even dipped below freezing for the first time since summer max, five days before normal.
 The ice area will still decrease for another month or so since sea ice does not start forming until temperatures are -4 degree C, but the ice volume is near its minimum since snow season in the Arctic has already started, and new snow on ice stays, and fresh snow has a higher albedo than old, tired ice.
How much more ice? As of today the sea ice volume is 500 to 1000 km3 larger than last two years, not much, but enough to make a trend. In addition the ice on Greenland has increased by 150 km3, reversing many years of decline.
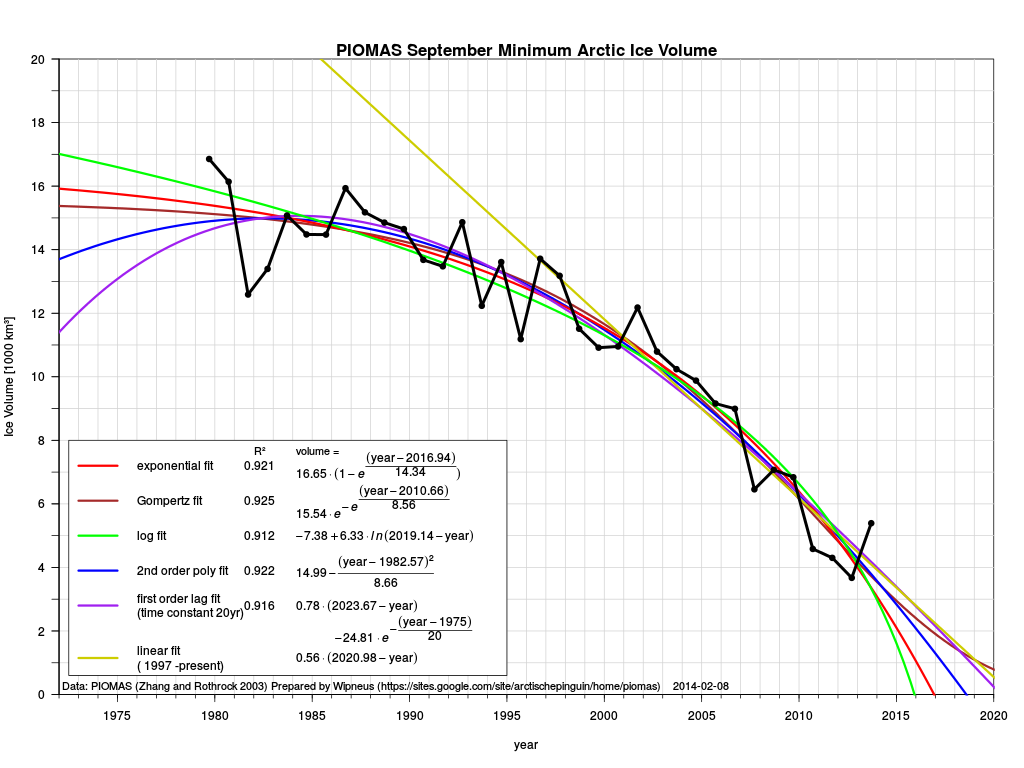
The prediction that the Arctic ice would be melted by 2016 was foolish extrapolation, but the chart looked good at the time.
 This year’s minimum will be about 6,000 km3.
The moral of this story. Beware of extrapolations. Don’t trust models, go with observations.
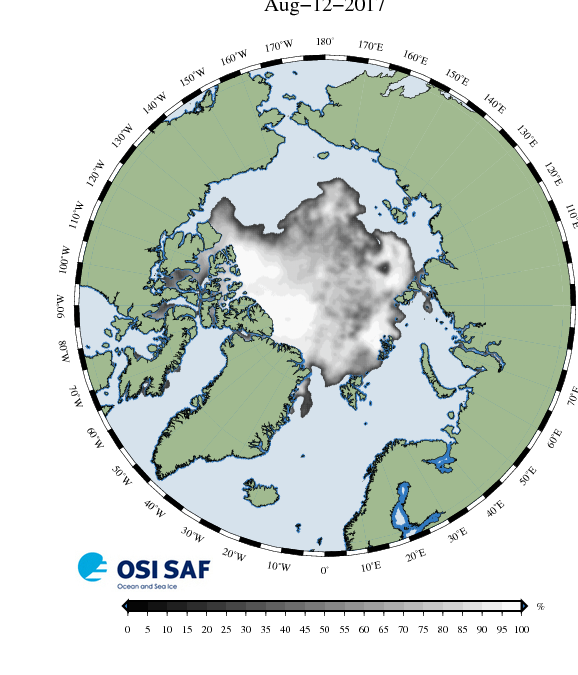
And one more thing. In 2016 the sailboat Polar Ocean Challenge managed to sail through both the North East Passage and the North West Passage in the same season. In 2015 it would have been no problem The North East Passage choke point Cape Chelyuskin was ice free late July. In 2016 it was still ice covered Aug 5, but the first summer storm cleared out the ice plug. This year Cape Chelyuskin is still full of ice
 This year they could not have made the journey. There is not enough time left until the North West Passage freezes over.
