Luke 19:1-27 starts with the story of Zacchaeus ( a wee little man), then is recorded Jesus’ parable of the minas. One take home from that parable is: “Take from him the pound, and give it to him that hath ten pounds. (And they said unto him, Lord, he hath ten pounds.)”
1 Kings 18. This chapter alone makes the reading of 1 Kings up to now worthwhile. Elijah met Obadiah and sent a message to King Ahab. When they met, Elijah challenged Ahab to a competition: Four hundred fifty prophets of Baal and four hundred prophets of Asherah against Elijah alone on Mount Carmel to see whose God is victorious! You know the rest, enjoy reading!
Luke 18 starts by Jesus telling the parable of the persistent widow, meaning we should always pray, then he added: “When the Son of man cometh, shall he find faith on the earth?” After that he taught us humility with the parable of the pharisee and the tax collector, reinforced by Jesus blessing the little children, “for the Kingdom of God belongs to such as these”. A rich young ruler wanted to inherit eternal life but was not willing to pay the price to follow Jesus. With men it is impossible to have eternal life , but all things are possible with God. Then Jesus predicted His death, and finally a blind beggar received his sight.
1 Kings 17. With Baal worship in full swing Elijah prayed for a multi-year drought. He then went into the wilderness by a brook and was fed by ravens. But the brook dried up so he went to a widow in Zarephath. He asks her for water and some bread. That was the last of the flower she had, but she gave it to Elijah anyway. Later the widow’s son died and Elijah revived him. The jar of flour and the jug of oil never emptied as long as Elijah was in the house, miracle upon miracle!
Luke 17. Jesus told about the consequences of sin, the importance of faith and the call of duty. Then is recorded the story of ten lepers healed but only one came back and thanked Jesus, and he was a Samaritan! Finally Jesus spoke of the Coming of the Kingdom of God and the end times.
Not much good in 1 Kings 14, it tells of judgment on the house of Jeroboam and his death, and Rehoboam taking over power and his death.
1 Kings 15, the evil king Abijam reigned in Judah. After his death Asa became king over Judah and he was a good king. Meanwhile in Israel Nadab reigned, and after him Baasha both doing evil things in the eyes of the LORD.
1 Kings 16 displays a depressing list of kings over Israel, Baasha, Elah, Zimri, one worse the the other, finally culminating with Ahab, the worst of them all, setting up Baal worship in Israel.
Luke 16. Jesus told the parable of the unjust steward to show it is not enough to follow the practices of the land, one must be above reproach in spiritual things, even if you are following the Law and the Prophets to the letter you will fail. He ended with the parable of the rich man and Lazarus.
1 Kings 12 tells of the revolt against Rehoboam and Jeroboam’s Golden Calves at Bethel and Dan. They were put up so Rehoboam didn’t have to go to Jerusalem to sacrifice.
1 Kings 13. From Judah came a Man of God with a message. It did not go over well, so through lies and intrigues the Man of God was killed by a lion. One quote from this chapter: “After this thing Jeroboam returned not from his evil way, but made again of the lowest of the people priests of the high places: whosoever would, he consecrated him, and he became one of the priests of the high places.” Large portions of the Old Testament describes how not to worship, let this be a warning for us.
Luke 15 is deceptively simple. Just three parables; the lost sheep, the lost coin, and finally the lost son, the most famous story of redemption of them all.
In 1 Kings 10 the Queen of Sheba visited Solomon and praised him “The half had not been told”; of Solomon’s great wisdom and wealth.
1 Kings 11. Solomon’s heart turned from the LORD, ( blame the foreign women and their idolatry). It records Solomon’s adversaries, Jeroboam’s rebellion, and Solomon’s death.
In Luke 14, again on the Sabbath, at a Pharisee’s house no less, Jesus healed a man with dropsy. Noticing how the people competed for the best places Jesus spoke of the lowly place to be sought rather than the place of honor, and as an object lesson he gave us the parable of the Great Supper and the cost of following Christ. Finally Jesus mentioned the value of good salt and the worthlessness of salt that lost its savor.
1 Kings 8. It was celebration time when the Ark was brought into the Temple, Solomon gave a great speech and a prayer of dedication. Then he blessed the Assembly and dedicated the Temple with lots of sacrifices and it finished with a fourteen day feast.
1 Kings 9 tells of God’s second appearance to Solomon, this time with a promise and a warning. Solomon and Hiram exchanged gifts and the chapter lists more of Solomon’s achievements.
Luke 13. Jesus kept telling the religious Jews “Unless you repent you all perish.” The fig tree is a symbol of Israel, and until then God has been patient with the barren Fig Tree. Moving on, like Jesus so often did, a woman was healed on a Sabbath, which made the ruler of the Synagogue angry. Jesus took issue with that, asking why can you save animals on Sabbath but not people? He then told the parable of faith like the Mustard Seed, the Leaven and the narrow Gate and explained why not all will enter. Finally, Jesus lamented over Jerusalem.
1 Kings 6 retells in great detail how Solomon had the Temple built.
And the retelling continues in 1 Kings 7, how Solomon had his palace and the other buildings built. He hired Hiram the Craftsman, and he completed the bronze pillars for the Temple, the Sea and the Oxen, The Carts and the Lavers, and had all the temple furnishings made.
“The future must not belong to those who slander the prophet of Islam.”
The quote comes from a speech that President Obama delivered to the United Nations General Assembly on 25 September 2012 about the death of U.S. ambassador Chris Stevens and three others in an attack on the U.S. consulate in Benghazi. At that time he still blamed a video.
Muslims claim, and the religion of Islam demands that Muhammad was “The Prophet”. This claim comes from what Muhammad called “the Book”, Deuteronomy 18: 17-22
17 The Lord said to me (Moses) : “What they say is good.18 I will raise up for them a prophet like you from among their fellow Israelites, and I will put my words in his mouth. He will tell them everything I command him. 19 I myself will call to account anyone who does not listen to my words that the prophet speaks in my name. 20 But a prophet who presumes to speak in my name anything I have not commanded, or a prophet who speaks in the name of other gods, is to be put to death.”
21 You may say to yourselves, “How can we know when a message has not been spoken by the Lord?” 22 If what a prophet proclaims in the name of the Lord does not take place or come true, that is a message the Lord has not spoken. That prophet has spoken presumptuously, so do not be alarmed.
After Muhammad fled from Mecca to Medina he started to proclaim he was “The Prophet” His new followers wanted to make sure he was “the Prophet” so they asked the Jews. The Jews immediately answered “No, he is not The Prophet. The Prophet must be an Israelite, and Muhammad is an Ishmaelite, so he is an impostor”. That didn’t sit well with Muhammad, so he ordered his followers to start praying to Mecca instead of praying to Jerusalem, as had been their practice until then. His always cooperating archangel provided a convenient revelation that that was indeed so. Since then Muslims have prayed to Mecca instead of Jerusalem, and been on the warpath against the Jews.
So, Muhammad was not “The Prophet”. Was he even a Prophet?
Everything a prophet proclaims must come true for him to qualify as a Prophet. One miss, and you are out. One prophecy Muhammad claimed was that the Jews would never be a unified nation again, and that they would not be able to fight militarily against the Muslims.
“They [the Jewish people] will not fight you (even) together, except in fortified townships, or from behind walls. Strong is their fighting (spirit) amongst themselves: thou wouldst think they were united, but their hearts are divided: that is because they are a people devoid of wisdom.” (Surah 59:14).
The seven day war and other wars since the formation of Israel in 1948 proves this prophecy wrong. (The opposite of what was prophecised has occurred)
Logic demands that Muhammad was not a prophet.
The Muslims have chosen another explanation: Israel does not exist, will never exist, has no right to exist and all fighting that has occurred in the Mideast can be explained by other means. There never was a genocide of Armenians, the holocaust never occurred and so forth.
After President Anwar Sadat of Egypt signed the peace accord with Israel together with Begin and President Carter, he was promptly assassinated by the Muslim Brotherhood.
It is my opinion that the only solution possible for peace in the Middle East is a reformation of the Muslim faith, accepting the violent history of Islam, its slavery and oppression, abandoning all physical claims to future world dominance, separating out the spiritual claims, and abandoning their geographical dreams of physically conquering the world. There are plenty of Muslims here in the USA willing to work towards that goal, but unfortunately they are not accepted by President Obama, who still prefers to work with the Muslim Brotherhood and their affiliates.
This is my take on it: Judge for yourselves.
“The future must not belong to those who slander the prophet of Islam.”
The quote comes from a speech that former President Obama delivered to the United Nations General Assembly on 25 September 2012 about the death of U.S. ambassador Chris Stevens and three others in an attack on the U.S. consulate in Benghazi. At that time he still blamed a video.
Muslims claim, and the religion of Islam demands that Muhammad was “The Prophet”. This claim comes from what Muhammad called “the Book”, Deuteronomy 18: 17-22
17 The Lord said to me (Moses) : “What they say is good. 18 I will raise up for them a prophet like you from among their fellow Israelites, and I will put my words in his mouth. He will tell them everything I command him. 19 I myself will call to account anyone who does not listen to my words that the prophet speaks in my name. 20 But a prophet who presumes to speak in my name anything I have not commanded, or a prophet who speaks in the name of other gods, is to be put to death.”
21 You may say to yourselves, “How can we know when a message has not been spoken by the Lord?” 22 If what a prophet proclaims in the name of the Lord does not take place or come true, that is a message the Lord has not spoken. That prophet has spoken presumptuously, so do not be alarmed.
After Muhammad fled from Mecca to Medina he started to proclaim he was “The Prophet” His new followers wanted to make sure he was “the Prophet” so they asked the Jews. The Jews immediately answered “No, he is not The Prophet. The Prophet must be an Israelite, and Muhammad is an Ishmaelite, so he is an impostor”. That didn’t sit well with Muhammad, so he ordered his followers to start praying to Mecca instead of praying to Jerusalem, as had been their practice until then. His always cooperating archangel Gabriel provided a convenient revelation that that was indeed so. Since then Muslims have prayed to Mecca instead of Jerusalem, and been on the warpath against the Jews.
So, Muhammad was not “The Prophet”. Was he even a Prophet?
Everything a prophet proclaims must come true for him to qualify as a Prophet. One miss, and you are out. One prophecy Muhammad claimed was that the Jews would never be a unified nation again, and that they would not be able to fight militarily against the Muslims.
“They [the Jewish people] will not fight you (even) together, except in fortified townships, or from behind walls. Strong is their fighting (spirit) amongst themselves: thou wouldst think they were united, but their hearts are divided: that is because they are a people devoid of wisdom.” (Surah 59:14).
The seven day war and other wars since the formation of Israel in 1948 proves this prophecy wrong. (The opposite of what was precised has occurred)
Logic demands that Muhammad was not a prophet.
The Muslims have chosen another explanation: Israel does not exist, will never exist, has no right to exist and all fighting that has occurred in the Mideast can be explained by other means. There never was a genocide of Christian Armenians, the holocaust never occurred and so forth.
After President Anwar Sadat of Egypt signed the peace accord with Israel together with Begin and President Carter, he was promptly assassinated by the Muslim Brotherhood.
It is my opinion that the only solution possible for peace in the Middle East is a reformation of the Muslim faith, accepting the violent history of Islam, its slavery and oppression, abandoning all physical claims to future world dominance, separating out the spiritual claims, and abandoning their geographical dreams of physically conquering the world. There are plenty of Muslims here in the USA willing to work towards that goal, but unfortunately they are not accepted by Ex President Obama, who still prefers to work with the Muslim Brotherhood and their affiliates.
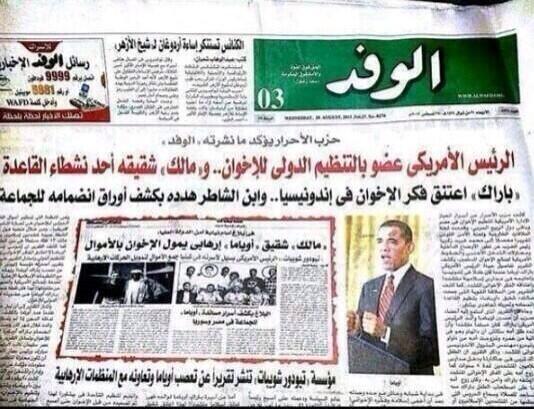
The second hint that Barack Obama is a member of the Muslim Brotherhood.
On September 1 2014 Egypt’s largest newspaper claimed on its front page that Obama is a full fledged member of the Muslim Brotherhood.
The Muslim Brotherhood called for “a long, uncompromising jihad” in Egypt just days after a delegation of the Islamist group’s key leaders and allies met with the State Department, according to an official statement released last week.
While the President himself did not attend (as far as we know) the State Department meeting was attended by a deputy assistant secretary for democracy, human rights, and labor and other State Department officials.
The Muslim Brotherhood statement also was issued just two days before a major terror attack Thursday Jan 29 in Egypt’s lawless Sinai region that killed at least 25.
“It is incumbent upon everyone to be aware that we are in the process of a new phase, where we summon what is latent in our strength, where we recall the meanings of jihad and prepare ourselves, our wives, our sons, our daughters, and whoever marched on our path to a long, uncompromising jihad, and during this stage we ask for martyrdom,” the statement from the Muslim Brotherhood reads.
Then February 4 2015 ex President Barack Obama met with Muslim leaders in the East Room of the White House, off limit to reporters. We were not to know the content of the President’s message, only that it is none of our business, neither are we to know who attended the meeting, “since they are private citizens and their privacy needs to be protected”.
This does not pass the smell test.
Which leads to verse 22 of the Obama Impeachment song (sung to the tune of “Please release me, let me go”)
These are my opinions and I do not attribute any of them to Kathy Barnette, except that she has been accused to hold the view that Islam and Christianity are incompatible, you cannot hold both views.
Oh, and one more thing: Kathy Barnette just tweeted:
I have released all my military records. Has Dr. Mehmet Oz released released all his Turkish military records?
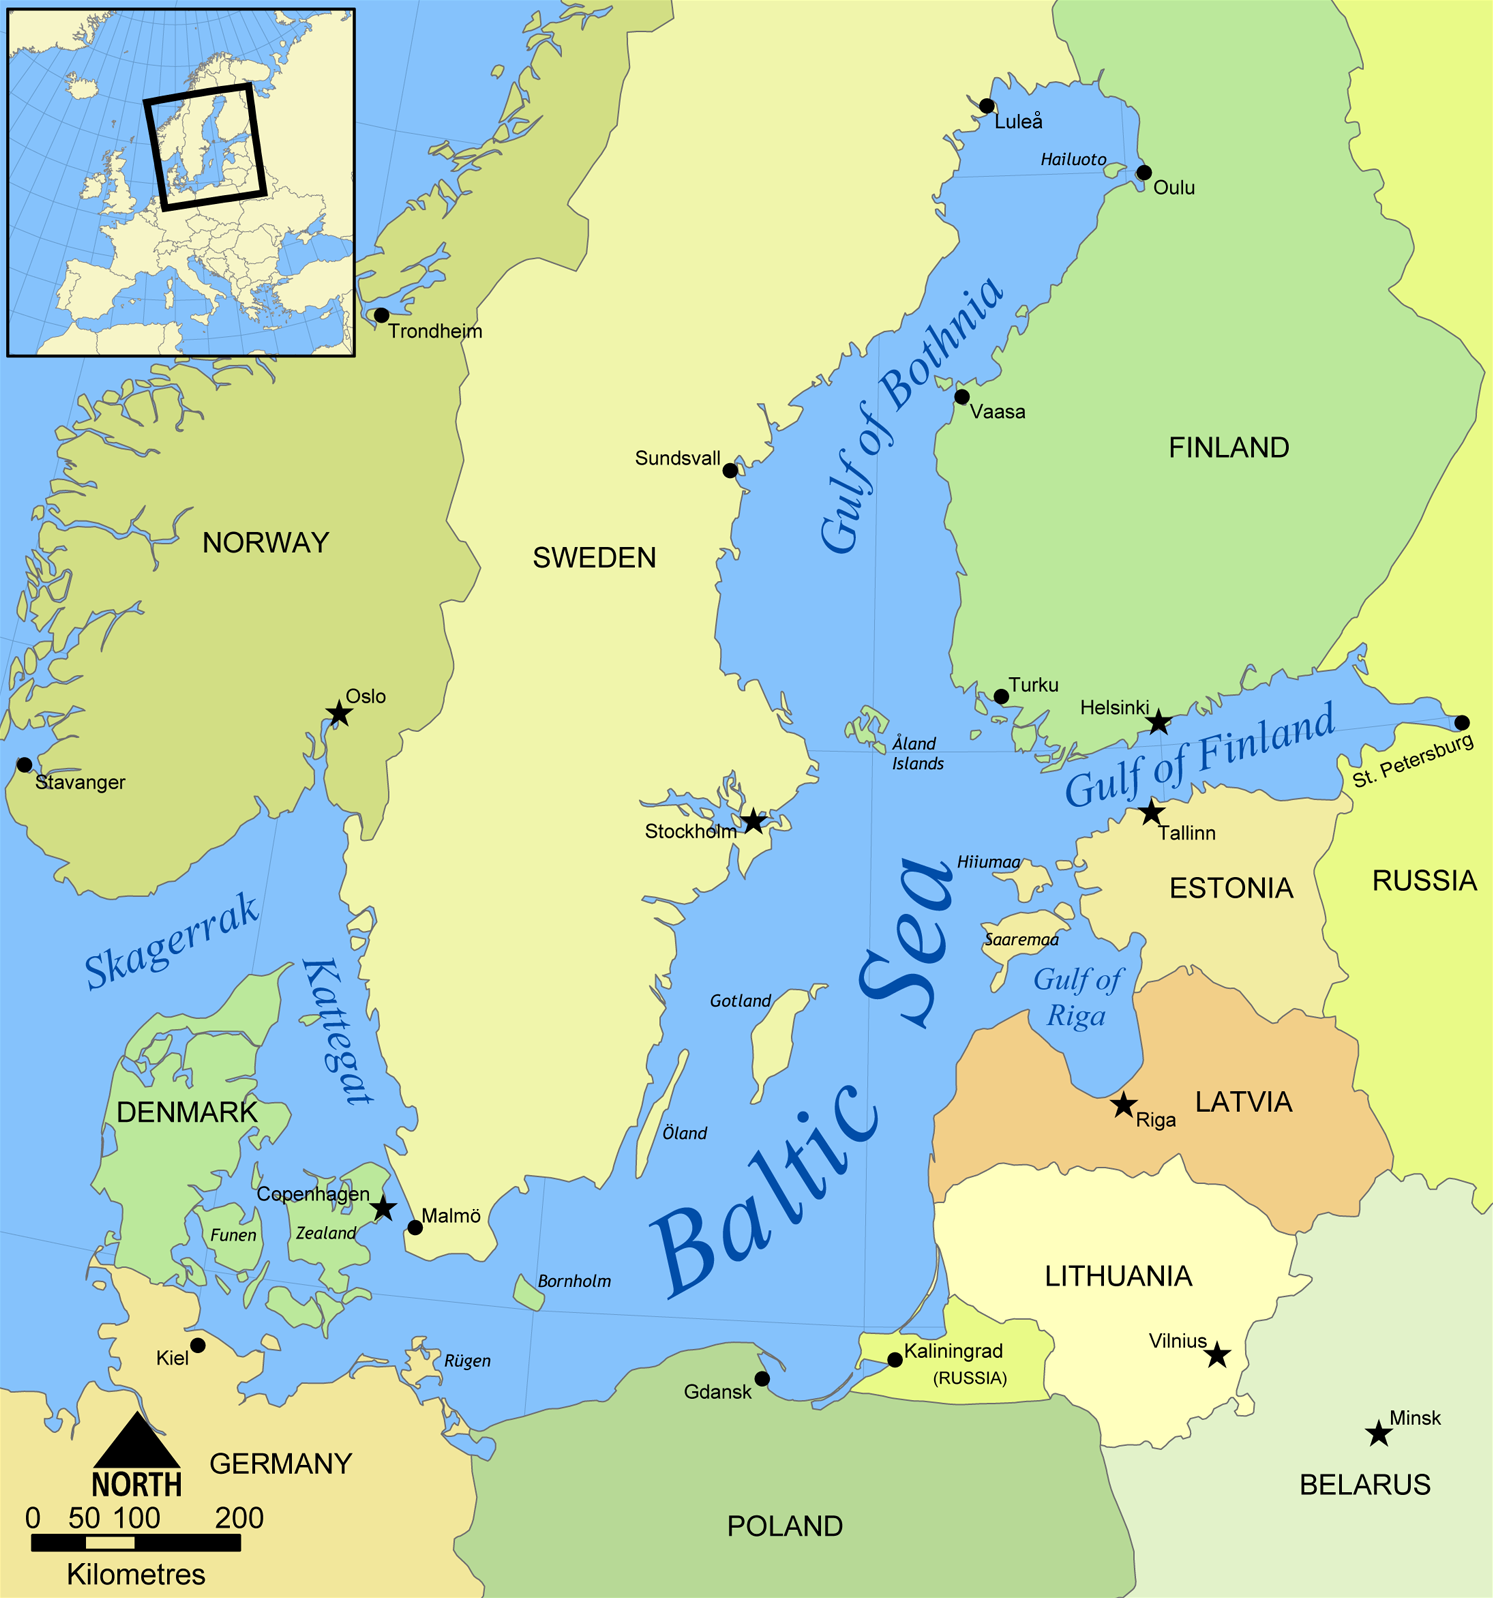
Finland has received 10% of its electricity from Russia. Because Finland refused to pay in Rubles Russia refuses to deliver any more. Big deal. This is spring season in northern Sweden and Finland. As they say: Spring is not a season, it is a natural disaster. The spring floods rush down the rivers and hydro-power is maxed out for up to two months. Sweden can easily replace the needed electricity. Finland relies on Russian natural gas is near 100%, and May 25 is the deadline to pay in Rubles, or it will be cut off too. In addition Russia has threatened Finland to not even think of joining NATO, or there will be unspecified military action.
This has led to unprecedented diplomatic communication between Finland, Sweden and NATO, and not only are they conducting joint Baltic military exercises right now, but both Sweden and Finland may apply for full membership in NATO as early as Monday. Finland is fully on board, and in Sweden only the true Socialists, “Vänsterpartiet” is against it, but they are only a small minority. With this, the Baltic Sea will be fully in NATO hands, fully encircling the Russian enclave of Kaliningrad.
For Finland this is the end of the Russian dependence and for Sweden this is the final death blow to the Olof Palme doctrine, alliance free at all cost.
When I emigrated from Sweden in 1968 Sweden had three major recipients for their foreign aid: North Vietnam, Cuba and for some reason Tanzania, one country on each continent.
Luke 12:35-59. This passage tells what it means to be the faithful and watchful servant, not the evil and drunken one. Finally, Christ explains that he will bring division, even among family members, so discern the times and make peace.
1 Kings 4 lists Solomon’s administration, gives an account of Solomon’s prosperity and extols Solomon’s wisdom.
1 Kings 5. The wars had ended and Solomon prepared to build the Temple, as it was promised.