Luke 19:28-48. Jesus entered what is called “Holy Week”, beginning with the triumphal entry. Seeing Jerusalem, Jesus wept over it, and after entering Jerusalem Jesus cleansed the Temple.
1 Kings 19. After the fantastic victory at Mount Carmel Elijah fled from Jezebel, the “exhibit A” of names of evil women featured in literature and films. He fled, got strengthened by an angel that fed him a meal that gave him enough strength to go all the way to Mount Horeb. There he heard “The Still Small Voice.” God reminded Elijah that “I have left me seven thousand in Israel, all the knees which have not bowed unto Baal, and every mouth which hath not kissed him.” Leaving Mount Horeb Elijah met Elisha and called him to follow Elijah.
Luke 19:1-27 starts with the story of Zacchaeus ( a wee little man), then is recorded Jesus’ parable of the minas. One take home from that parable is: “Take from him the pound, and give it to him that hath ten pounds. (And they said unto him, Lord, he hath ten pounds.)”
1 Kings 18. This chapter alone makes the reading of all of 1 Kings worthwhile. Elijah met Obadiah and sent a message to King Ahab. When they met, Elijah challenged Ahab to a competition: Four hundred fifty prophets of Baal and four hundred prophets of Asherah against Elijah alone on Mount Carmel to see whose God is victorious! You know the rest, enjoy reading!
Luke 18 starts by Jesus telling the parable of the persistent widow, meaning we should always pray, then he added: “When the Son of man cometh, shall he find faith on the earth?” After that he taught us humility with the parable of the pharisee and the tax collector, reinforced by Jesus blessing the little children, “for the Kingdom of God belongs to such as these”. A rich young ruler wanted to inherit eternal life but was not willing to pay the price to follow Jesus. With men it is impossible to have eternal life , but all things are possible with God. Then Jesus predicted His death, and finally a blind beggar received his sight.
1 Kings 17. With Baal worship in full swing Elijah prayed for a multi-year drought. He then went into the wilderness, finding a brook and was fed by ravens. But the brook dried up so he went to a widow in Zarephath. He asks her for water and some bread. That was the last of the flower she had, but she gave it to Elijah anyway. Later the widow’s son died and Elijah revived him. The jar of flour and the jug of oil never emptied as long as Elijah was in the house, miracle upon miracle!
Luke 17. Jesus told about the consequences of sin, the importance of faith and the call of duty. Then is recorded the story of ten lepers healed but only one came back and thanked Jesus, and he was a Samaritan! Finally Jesus spoke of the Coming of the Kingdom of God and the end times.
Not much good in 1 Kings 14, it tells of judgment on the house of Jeroboam and his death, and Rehoboam taking over power and his death.
1 Kings 15, the evil king Abijam reigned in Judah. After his death Asa became king over Judah and he was a good king. Meanwhile in Israel Nadab reigned, and after him Baasha both doing evil things in the eyes of the LORD.
1 Kings 16 displays a depressing list of kings over Israel, Baasha, Elah, Zimri, one worse the the other, finally culminating with Ahab, the worst of them all, setting up Baal worship in Israel.
By far, the strongest greenhouse gas is water vapor, not because it is very strong of itself, but it absorbs nearly all outgoing energy in the infrared spectrum except in the so called atmospheric window, where it only partially absorbs. Yet water vapor is missing from the IPCC calculations. Instead is put in a forcing multiplier to account for the water vapor
IPCC has consistently treated the effect of greenhouse gasses as additive, but it is impossible to absorb more than 100% of all emitted energy for a given wavelength. This leads to an overestimation of absorption when 2 or more gases are present. For example, if CO2 absorbs 90% of available energy at 13 μm and water vapor another 50%, the sum is 90% + (1 -0.9} * 0.5 = 95%, not 140%. To see more how the calculations are made, see here.
We have valid satellite data from 1979, and they give very good global averages. so as a test I took a quick look at the temperature rise from 1980 to 2022 and compared what the rise would be, if all greenhouse and other factors would add up to, and to my surprise the result came within 4% of real data, see here.
Between 2022 and 2050 CO2 concentration is expected to increase from 415 ppm to 460 ppm and Methane from 1.9 ppm to 2.23 ppm. these are the most important greenhouse gases after water vapor. The calculations are here.
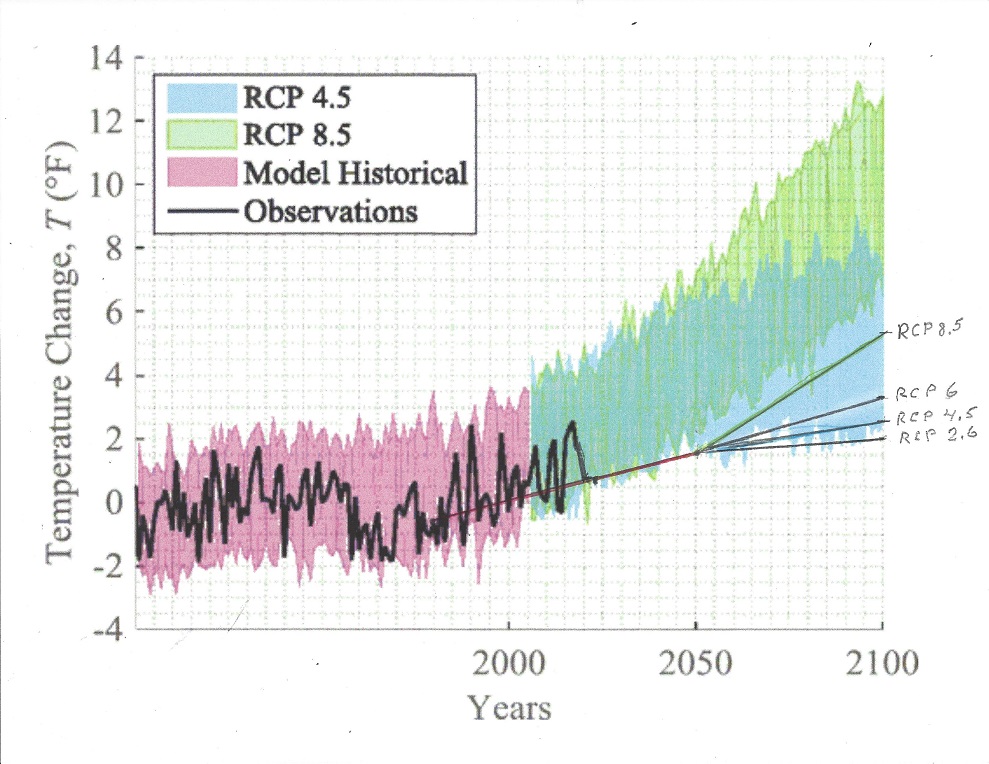
Extended to 2100 IPCC has given 4 scenarios for future temperature development. RCP 8.5 assumes that all future energy growth is provided by fossil fuel, and at least most nuclear energy is phased out. the 8.5 stands for W/m2 for CO2 increase as per IPCC calculation. See further here.
RPC 6 and RPC 4.5 are intermediate stages , while RPC 2.6 achieves net CO2 decline by 2100, but still rising temperature. Here is a figure for the different scenarios.
Calculations:
Scenario 1: RCP 8.5, CO2 1370 ppm, CH4 4 ppm, N2O+20%, HFC +20%, air pollutants -50%, population 12 billion, GDP 170 Trillion$ (2000)
Summary of all greenhouse effect causes for temperature rise from 2050 until 2100:
Effect from water vapor increase: 2.22 C or 10.54 W/m2;
Effect from rising CO2: 0.40C or 1.89 W/m2;
Effect from rising Methane: 0.09C or 0.43 W/m2,
Effect from rising N2O: 0.005C or 0.024 W/m2
Effect from rising Ozone: 0.0005C or 0.002 W/m2
Effect from rising HFCs : 0.006 C or 0.027 W/m2
TOTAL TEMPERATURE CHANGE 2050 to 2100: 2.72 C or 12.9 W/m2
Summary of all non-greenhouse effect causes for climate change from 2050 to 2100:
Long term warming of the sun: 0.0000005C
Temperature decrease from the Milankovitch cycle: – 0.02C or – 0.10 W/m2
Temperature increase from changing solar spot activity + 0.007 C or 0.033 W/m2
Temperature rise from decreasing cloud cover of 0.05 C or 0.24 W/m2.
Change from temperature rise of the Arctic 0.05 C or 0.24 W/m2
Pollution aerosols cause a temperature decrease of – 0.03 C or – 0.12 W/m2
Temperature increase from greening of the earth 0.004C or 0.020 W/m2
Temperature decrease from areas of desertification – 0.001C or 0.005 W/m2.
TOTAL TEMPERATURE RISE FROM OTHER THAN GREENHOUSE GASES FROM 2050 to 2100: 0.060 C or 0.308 W/m2
TEMPERATURE CHANGE FROM 2050 TO 2100 FROM ALL CAUSES: 2.78 C or 13.2 W/m2
Scenario 2: RCP 6.5, CO2 850 ppm, CH4 1.9 ppm, N2O-10%, HFC +20%, air pollutants -50%, population 9.5 billion, GDP 160 T$
Summary of all greenhouse effect causes for temperature rise from 2050 until 2100:
Effect from water vapor increase: 1.28C or 5.95 W/m2;
Effect from rising CO2: 0.20 C or 0.93 W/m2;
Effect from falling Methane: – 0.02C or 0.08 W/m2,
Effect from rising N2O: 0.001C or 0.005 W/m2
Effect from rising Ozone: 0.0005C or 0.002 W/m2
Effect from rising HFCs : 0.006 C or 0.027 W/m2
TOTAL TEMPERATURE CHANGE 2050 to 2100: 1.4665 C or 6.83 W/m2
Summary of all non-greenhouse effect causes for climate change from 2050 to 2100:
Long term warming of the sun: 0.0000005C
Temperature decrease from the Milankovitch cycle: – 0.02C or 0.10 W/m2
Temperature increase from changing solar spot activity + 0.007 C or 0.033 W/m2
Temperature rise from decreasing cloud cover of 0.05 C or 0.24 W/m2.
Change from temperature rise of the Arctic 0.05 C or 0.24 W/m2
Less pollution aerosols cause a temperature increase of 0.05 C or 0.24 W/m2
Temperature increase from greening of the earth 0.002C or 0.010 W/m2
Temperature decrease from areas of desertification – 0.001C or 0.005 W/m2.
TOTAL TEMPERATURE RISE FROM OTHER THAN GREENHOUSE GASES FROM 2050 to 2100: 0.138 C or 0.658 W/m2
TEMPERATURE CHANGE FROM 2050 TO 2100 FROM ALL CAUSES: 1.6 C or 7.5 W/m2
Scenario 3: RCP 4, CO2 650 ppm, CH4 2.0 ppm, N2O-10%, HFC 0%, air pollutants -50%, population 8.7 billion, GDP 280 T$
Summary of all greenhouse effect causes for temperature rise from 2050 until 2100:
Effect from water vapor increase: 0.88 C or 4.19 W/m2;
Effect from rising CO2: 0.08 C or 0.40 W/m2;
Effect from stable Methane: 0.0 C or 0.0 W/m2,
Effect from falling N2O: 0.004C or 0.02 W/m2
Effect from stable Ozone: 0.0 C or 0.0 W/m2
Effect from stable HFCs : 0.0 C or 0.0 W/m2
TOTAL TEMPERATURE CHANGE 2050 to 2100: 0.964C or 4.61 W/m2
Summary of all non-greenhouse effect causes for climate change from 2050 to 2100:
Long term warming of the sun: 0.0000005C
Temperature decrease from the Milankovitch cycle: – 0.02C or 0.10 W/m2
Temperature increase from changing solar spot activity + 0.007 C or 0.033 W/m2
Temperature rise from decreasing cloud cover of 0.05 C or 0.24 W/m2.
Change from temperature rise of the Arctic 0.05 C or 0.24 W/m2
Pollution aerosols cause a temperature increase of 0.05 C or 0.24 W/m2
Temperature increase from greening of the earth 0.002C or 0.010 W/m2
Temperature decrease from areas of desertification – 0.001C or 0.005 W/m2.
TOTAL TEMPERATURE RISE FROM OTHER THAN GREENHOUSE GASES FROM 2050 to 2100: 0.135 C or 0.658 W/m2
TEMPERATURE CHANGE FROM 2050 TO 2100 FROM ALL CAUSES: 1.1 C or 5.3 W/m2
Scenario 4: RCP 2.6, CO2 490 ppm, CH4 1.5 ppm, N2O-15%, HFC -10%, air pollutants -75%, population 9 billion, GDP 320 T$
Summary of all greenhouse effect causes for temperature rise from 2050 until 2100:
Effect from water vapor increase: 0.55 C or 2.55W/m2;
Effect from rising CO2: 0.02C or 0.07 W/m2;
Effect from declining Methane: – 0.01C or 0.06 W/m2,
Effect from stable N2O: 0.0 C or 0.0 W/m2
Effect from stable Ozone: 0.0 C or 0.0 W/m2
Effect from stable HFCs : 0.0 C or 0.0 W/m2
TOTAL TEMPERATURE CHANGE 2050 to 2100: 0.56 C or 2.56 W/m2
Summary of all non-greenhouse effect causes for climate change from 2050 to 2100:
Long term warming of the sun: 0.0000005C
Temperature decrease from the Milankovitch cycle: – 0.02C or 0.10 W/m2
Temperature increase from changing solar spot activity + 0.007 C or 0.033 W/m2
Temperature rise from decreasing cloud cover of 0.02 C or 0.10 W/m2.
Change from temperature rise of the Arctic 0.05 C or 0.24 W/m2
Pollution aerosols cause a temperature increase of 0.08 C or 0.36 W/m2
Temperature increase from greening of the earth 0.002C or 0.010 W/m2
Temperature decrease from areas of desertification – 0.001C or 0.005 W/m2.
TOTAL TEMPERATURE RISE FROM OTHER THAN GREENHOUSE GASES FROM 2050 to 2100: 0.138 C or 0.64 W/m2
TEMPERATURE CHANGE FROM 2050 TO 2100 FROM ALL CAUSES: 0.70 C or 3.2 W/m2
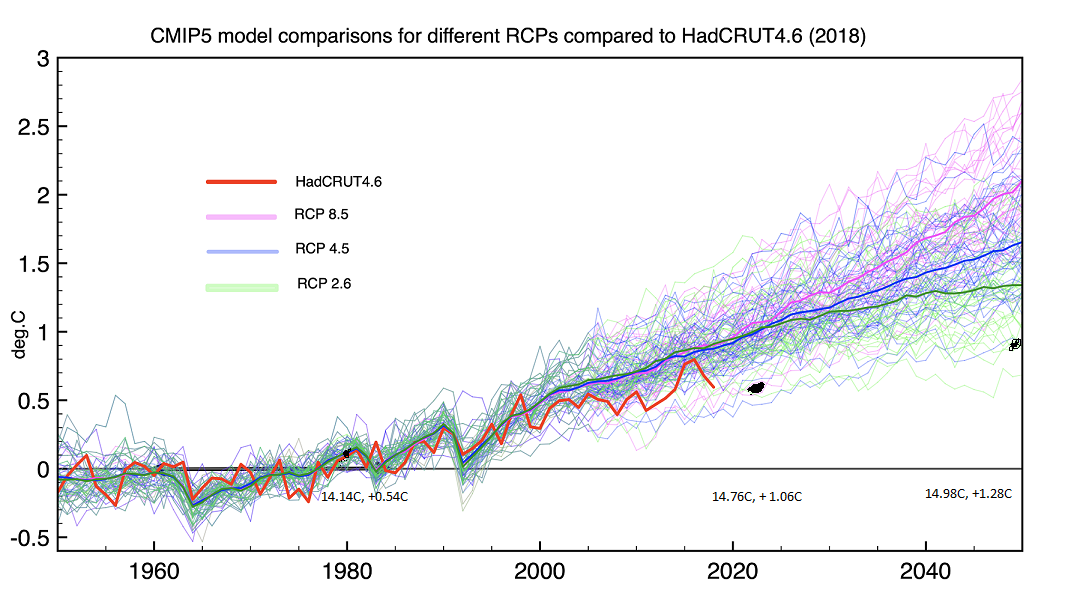
The temperature data from 1980 to 2022 is the control group, and is based on real data.It was then the basis for doing the 2022 to 2050 calculation assuming no mitigation efforts, the most likely result if none of the Paris accord is implemented. The climate target is to stay under + 1.5 C, and this model, that worked better than 95% accurate between 1980 and 2022, comes up with a temperature rise of 1.28C, well below the 1.5C maximum rise since the 1800s
Luke 16. Jesus told the parable of the unjust steward to show it is not enough to follow the practices of the land, one must be above reproach in spiritual things, even if you are following the Law and the Prophets to the letter you will fail. He ended with the parable of the rich man and Lazarus.
1 Kings 12 tells of the revolt against Rehoboam and Jeroboam’s Golden Calves at Bethel and Dan. They were put up so Rehoboam didn’t have to go to Jerusalem to sacrifice.
1 Kings 13. From Judah came a Man of God with a message. It did not go over well, so through lies and intrigues the Man of God was killed by a lion. One quote from this chapter: “After this thing Jeroboam returned not from his evil way, but made again of the lowest of the people priests of the high places: whosoever would, he consecrated him, and he became one of the priests of the high places.” Large portions of the Old Testament describes how not to worship, let this be a warning to us.
Luke 15 is deceptively simple. Just three parables; the lost sheep, the lost coin, and finally the lost son, the most famous story of redemption of them all.
In 1 Kings 10 the Queen of Sheba visited Solomon and praised him “The half had not been told”; of Solomon’s great wisdom and wealth.
1 Kings 11. Solomon’s heart turned from the LORD, ( blame the foreign women and their idolatry). It records Solomon’s adversaries, Jeroboam’s rebellion, and Solomon’s death.
In Luke 14, again on the Sabbath, at a Pharisee’s house no less, Jesus healed a man with an edema. Noticing how the people competed for the best places Jesus spoke of the lowly place to be sought rather than the place of honor, and as an object lesson he gave us the parable of the Great Supper and the cost of following Christ. Finally Jesus mentioned the value of good salt and the worthlessness of salt that lost its savor.
1 Kings 8. It was celebration time when the Ark was brought into the Temple, Solomon gave a great speech and a prayer of dedication. Then he blessed the Assembly and dedicated the Temple with lots of sacrifices and it finished with a fourteen day feast.
1 Kings 9 tells of God’s second appearance to Solomon, this time with a promise and a warning. Solomon and Hiram exchanged gifts and the chapter lists more of Solomon’s achievements.
Luke 13. Jesus kept telling the religious Jews “Unless you repent you all perish.” The fig tree is a symbol of Israel, and until then God had been patient with the barren Fig Tree. Moving on, like Jesus so often did, a woman was healed on a Sabbath, which made the ruler of the Synagogue furious. Jesus took issue with that, asking why you can save animals on Sabbath but not people? He then told the parable of faith like the Mustard Seed, the Leaven and the narrow Gate and explained why not all will enter. Finally, Jesus lamented over Jerusalem.
1 Kings 6 retells in great detail how Solomon had the Temple built.
And the retelling continues in 1 Kings 7, how Solomon had his palace and the other buildings built. He hired Hiram the Craftsman, and he completed the bronze pillars for the Temple, the Sea and the Oxen, The Carts and the Lavers, and had all the temple furnishings made.
By far, the strongest greenhouse gas is water vapor, not because it is very strong of itself, but it absorbs nearly all outgoing energy in the infrared spectrum except in the so called atmospheric window, where it only partially absorbs. Yet water vapor is missing from the IPCC calculations. instead they put in a forcing multiplier to account for the addition of water.
IPCC has consistently treated the effect of greenhouse gasses as additive, but it is impossible to absorb more than 100% of all emitted energy for a given wavelength. This leads to an overestimation of absorption when 2 or more gasses are present. For example, if CO2 absorbs 90% of available energy at 13 μm and water vapor another 50%, the sum is 90% + (1 -0.9} * 0.5 = 95%, not 140%.
Between 2022 and 2050 CO2 concentration is expected to increase from 415 ppm to 460 ppm and Methane from 1.9 ppm to 2.23 ppm. these are the most important greenhouse gasses except water vapor.
Summary of all greenhouse effect causes for temperature rise from 2022 until 2050:
Effect from water vapor increase: 0.13 C or 0.62 W/m2;
Effect from rising CO2: 0.025C or 0.12 W/m2;
Effect from rising Methane: 0.02C or 0.08 W/m2,
Effect from rising N2O: 0.004C or 0.02 W/m2
Effect from rising Ozone: 0.0011C or 0.005 W/m2
Effect from rising HFCs : 0.0060 C or 0.027 W/m2
TOTAL TEMPERATURE CHANGE 2022 to 2050: 0.1861C or 0.8720 W/m2
Summary of all non-greenhouse effect causes for climate change from 2022 to 2050:
Long term warming of the sun: 0.0000005C
Temperature decrease from the Milankovitch cycle: – 0.011 C or 0.05 W/m2
Temperature decrease from changing solar spot activity – 0.007 C or 0.021 W/m2
Temperature rise from decreasing cloud cover of 0.05 C or 0.24 W/m2.
Change from temperature rise of the Arctic 0.05 C or 0.24 W/m2
Pollution aerosols cause a temperature decrease of – 0.05 C or 0.24 W/m2
Temperature increase from greening of the earth 0.0035C or 0.017 W/m2
Temperature decrease from areas of desertification – 0.0008C or 0.004 W/m2.
TOTAL TEMPERATURE RISE FROM OTHER THAN GREENHOUSE GASES FROM 2022 to 2050: 0.0363 C or 0.182 W/m2
TEMPERATURE CHANGE FROM 2022 TO 2050 FROM ALL CAUSES: 0.2224 C or 1.054 W/m2
Summary of all causes for climate change from now until 2050:
Long term warming of the sun: 0.000005C
Effect from the potential Eddy Grand Solar minimum: 0 to – 1C. Yes,that’s cooler
Effect from the Milankovitch cycles: – 0.0135C
Effect from reversing the magnetic poles: undetermined.
Direct effect from rising CO2: 0.025C
Effect from increasing CO2 increasing water vapor : 0.03 C
All other greenhouse gasses combined 0.032 C
Temperature rise from decreasing cloud cover 0.27C
Temperature increase from greening of the earth 0.063C
Temperature decrease from areas of desertification 0.0015C
TOTAL TEMPERATURE CHANGE 2023 to 2050: 0.384 C rise to 0,616 C decrease if the Dodd grand solar minimum occurs
The temperature data from 1980 to 2022 is the control group, and is based on real data.It was then the basis for doing the 2022 to 2050 calculation assuming no mitigation efforts, the most likely result if none of the Paris accord is implemented. The climate target is to stay under + 1.5 C, and this model, that worked better than 95% accurate between 1980 and 2022, comes up with a temperature rise of 1.28C, well below the 1.5C maximum rise since the late 1800s